Apple Near Key Support — Long Setup DevelopingIntroduction:
Apple NASDAQ:AAPL is approaching a critical support zone that has consistently held over the past two months. As price retraces toward this level, it presents a potential long opportunity for traders looking to position ahead of the next bullish leg.
Technical Setup:
Support Zone: $193 – $196
This area has acted as a strong demand zone, providing multiple bounce points since April.
Price is now pulling back into this region, offering a potential entry for a long trade.
Trade Idea:
Entry: $193 – $196 (on confirmation of support holding)
Take Profit Targets:
First Target: $210 – $215
Second Target: $225 – $233
Stop Loss: Just below $184 (to protect against a breakdown from support)
#AAPL #Apple #Stocks #TechnicalAnalysis #SupportZone #LongSetup #TradingStrategy #NASDAQ #TechStocks #RiskReward
Stocks

Coinbase Shares Rise Following Stablecoin Legislation ApprovalCoinbase (COIN) Shares Rise Following Stablecoin Legislation Approval
Shares in Coinbase Global (COIN) surged by 11% yesterday, making the company the top performer in the S&P 500 index (US SPX 500 mini on FXOpen).
The sharp rise was driven by news that the US Senate has approved the GENIUS stablecoin bill, which sets out a regulatory framework for the use of stablecoins — crypto assets whose value is pegged to another currency or financial instrument, such as the US dollar.
The bill (which still requires approval from the House of Representatives) would pave the way for banks, fintech companies, and other financial market participants to use stablecoins. This development acted as a strong bullish catalyst for COIN shares.
Technical Analysis of Coinbase (COIN) Share Price Chart
In our previous analysis of the COIN share price chart, we:
→ identified an ascending channel (shown in blue);
→ suggested that the COIN share price could rise towards the psychological level of $300.
That projection has played out — the price is now very close to the $300 mark. So, what comes next?
In a bold, optimistic scenario, buyers may hope for a continuation of the rally, with the share price pushing towards the upper boundary of the long-term ascending channel, especially following the recent news. In the medium term, the blue ascending channel may remain relevant, given the strong signal of improved cryptocurrency regulation in the US legislative framework.
However, we also note some vulnerability to a pullback, as:
→ the $300 level may act as significant resistance;
→ the price is approaching the upper boundary of the blue channel, which also shows resistance characteristics;
→ once the initial wave of positive sentiment fades, some investors may look to take profits, especially given the more than 20% rise in Coinbase (COIN) shares since the beginning of the month.
This article represents the opinion of the Companies operating under the FXOpen brand only. It is not to be construed as an offer, solicitation, or recommendation with respect to products and services provided by the Companies operating under the FXOpen brand, nor is it to be considered financial advice.

What Is T-Distribution in Trading? What Is T-Distribution in Trading?
In the financial markets, understanding T-distribution in probability is a valuable skill. This statistical concept, crucial for small sample sizes, offers insights into market trends and risks. By grasping T-distribution, traders gain a powerful tool for evaluating strategies, risks, and portfolios. Let's delve into what T-distribution is and how it's effectively used in the realm of trading.
Understanding T-Distribution
The T-distribution in probability distribution plays a crucial role in trading, especially in situations where sample sizes are small. William Sealy Gosset first introduced it under the pseudonym "Student". This distribution resembles the normal distribution with its bell-shaped curve but has thicker tails, meaning it predicts more outcomes in the extreme ends than a normal distribution would.
A key element of T-distribution is the concept of 'degrees of freedom', which essentially refers to the number of values in a calculation that are free to vary. It's usually the sample size minus one.
The degrees of freedom affect the shape of the T-distribution; with fewer degrees of freedom, the distribution has heavier tails. As the degrees of freedom increase, the distribution starts to resemble the normal distribution more closely. This is particularly significant in trading when dealing with small data sets, where the T-distribution provides a more accurate estimation of probability and risk than the normal distribution.
T-Distribution vs Normal Distribution
T-distribution and normal distribution are foundational in statistical analysis, yet they serve different purposes. While both exhibit a bell-shaped curve, the T-distribution has thicker tails, implying a higher probability of extreme values. This makes it more suitable for small sample sizes or when the standard deviation is unknown.
In contrast, the normal distribution, with its thinner tails, is ideal for larger sample sets where the standard deviation is known. Traders often use T-distribution for more accurate analysis in small-scale or uncertain data scenarios, while normal distribution is preferred for larger, more stable datasets, where extreme outcomes are less likely.
Application in Trading
In trading, T-distribution is a valuable tool for analysing financial data. It is primarily used in constructing confidence intervals and conducting hypothesis testing, which are essential for making informed trading decisions.
For instance, a trader might use T-distribution to test the effectiveness of a new trading strategy. Suppose a trader has developed a strategy using the technical analysis tools and wants to understand its potential effectiveness compared to the general market performance. They would collect a sample of returns from this strategy over a period, say, 30 days. Given the small sample size, using T-distribution is appropriate here.
The trader would then calculate the mean return of this sample and use T-distribution to create a confidence interval. This interval would provide a range within which the true mean return of the strategy is likely to lie, with a certain level of confidence. If this confidence interval shows a higher mean return than the market average, the trader might conclude that the strategy is potentially effective. However, it's important to note that this is an estimation and not a guarantee of future performance.
How to Plug Probability and Normal Distribution in Your T-Calculation
To use a T-calculator for integrating probability and normal distribution, follow these steps:
- Input Degrees of Freedom: For T-distribution, calculate the degrees of freedom (sample size minus one).
- Convert Z-Score to T-Value: If using normal distribution data, convert the Z-score (standard deviation units from the mean in a normal distribution) to a T-value using the formula: T = Z * (sqrt(n)), where 'n' is the sample size.
- Enter T-Value: Input this T-value into the calculator.
- Calculate Probability: The calculator will then output the probability, providing a statistical basis for trading decisions based on the T-distribution.
Limitations and Considerations of T-Distribution
While T-distribution is a powerful tool in trading analysis, it's important to recognise its limitations and considerations:
- Sample Size Sensitivity: T-distribution is most effective with small sample sizes. As the sample size increases, it converges to a normal distribution, reducing its distinct utility.
- Assumption of Normality: T-distribution assumes that the underlying data is approximately normally distributed. This may not hold true for all financial data sets, especially those with significant skewness or kurtosis.
- Degrees of Freedom Complications: Misestimating degrees of freedom can lead to inaccurate results. It's crucial to calculate this correctly based on the sample data.
- Outlier Sensitivity: T-distribution can be overly sensitive to outliers in the data, which can skew results.
Advanced Applications of T-Distribution in Trading
T-distribution extends beyond basic trading applications, playing a role in advanced financial analyses:
- Risk Modelling: Utilised in constructing sophisticated risk models, helping traders assess the probability of extreme losses.
- Algorithmic Trading: Integral in developing complex algorithms.
- Portfolio Optimisation: Assists in optimising portfolios by estimating returns and risks of various assets.
- Market Research: Used in advanced market research methodologies to analyse small sample behavioural studies.
The Bottom Line
The T-distribution is a powerful tool, offering nuanced insights in scenarios involving small sample sizes or uncertain standard deviations. Its ability to accommodate real-world data's quirks makes it invaluable for various trading applications, from strategy testing to risk assessment. However, understanding its limitations and proper application is crucial for accurate analysis.
This article represents the opinion of the Companies operating under the FXOpen brand only. It is not to be construed as an offer, solicitation, or recommendation with respect to products and services provided by the Companies operating under the FXOpen brand, nor is it to be considered financial advice.

High Dividend Stock on the Move? COH – Eyes on 351.51 Cochlear Limited (ASX: COH) is showing strong bullish potential after price tapped into a respected Monthly Order Block (OB). This region aligns with a historically strong demand zone, offering a prime entry opportunity for longer-term investors and SMC traders alike.
From a Smart Money Concept (SMC) perspective, the structure remains bullish:
- Price swept a low into the Monthly OB, indicating engineered liquidity grab.
- The reaction shows strong displacement to the upside, validating the OB.
- Volume also suggests institutional interest at this level.
- There’s now a clean path toward Equal Highs at 351.51, a natural draw for buy-side liquidity.
With COH offering consistent dividend payouts, this could be a double win – capital appreciation + income.
🧠 As always: Do Your Own Research (DYOR).

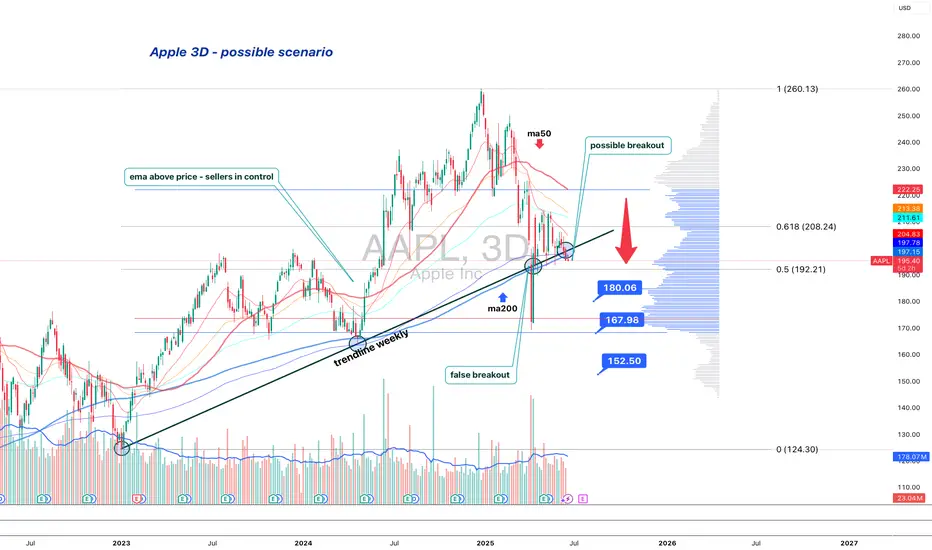
Apple is standing at the edgeApple (AAPL) is losing its long-term structure — second retest of the broken trendline suggests a bearish setup
On the 3D chart, Apple shows signs of structural breakdown. The weekly trendline from 2023 was broken and retested — twice. The price failed to regain it and now trades below, with candles showing weakness: low body closes, upper wicks, and no upside follow-through.
MA200 is now above price, and all EMAs are turning down. Volume Profile shows a heavy resistance block near $197. If the price remains below, sellers are in control.
Key levels:
— $192.20 = 0.5 Fibo support.
— Breakdown ➝ targets: $180 → $167 → $152.
Fundamentals:
Apple's recent reports show decelerating growth, weak China demand, and compressed margins. While AI buzz supports sentiment, institutional flow suggests distribution. BigTech may be topping out, and Apple is positioned for pullback.
Strategy:
Short below $196 with confirmation. Stop: $198. Targets: $180 / $167 / $152.
Failure to reclaim $192–197 = broken trend confirmed.
This is not a growth setup. This is where trends end — and profit-taking begins.
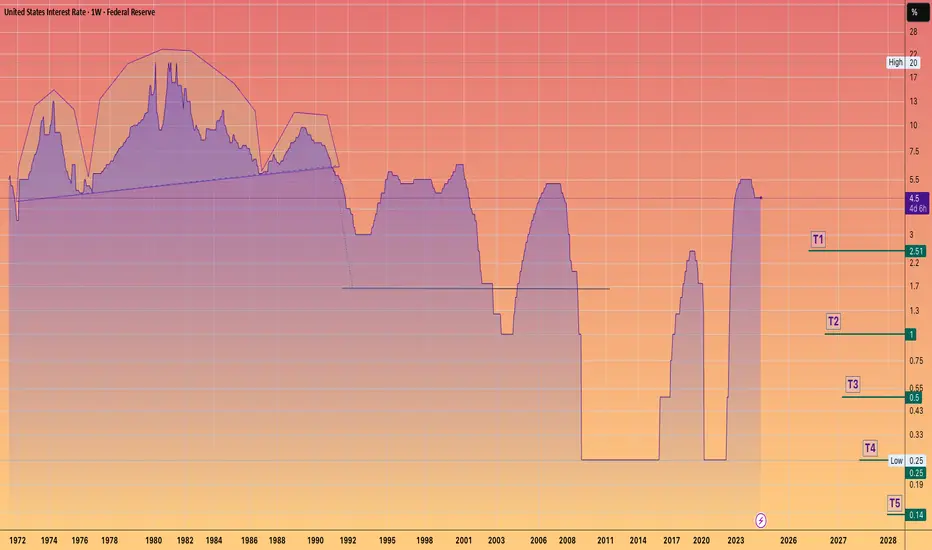
Mr. LATE drop the RATE!!"Jerome Powell aspires to be remembered as a heroic Federal Reserve chair, akin to Tall Paul #VOLKER.
However, Volker was largely unpopular during much of his tenure.
The primary function of the Federal Reserve is to finance the federal #government and ensure liquidity in US capital markets.
Controlling price inflation should not rely on costly credit.
Instead, it should be achieved by stimulating growth and productivity through innovation and by rewarding companies that wisely allocate capital, ultimately leading to robust cash flows... innovation thrives on affordable capital.
While innovation can lead to misallocations and speculative errors, this is a normal aspect of the process.
(BUT it is crucial that deposits and savings are always insured and kept separate from investment capital.)
By maintaining higher interest rates for longer than necessary, J POW is negatively impacting innovators, capital allocators, small businesses that need cheap capital to function effectively, job creators, and the overall growth environment.
Addressing price inflation is a far more favorable situation than allowing unemployment to soar to intolerable levels.
"Losing my job feels like a depression".
But if I have to pay more for eggs, I can always opt for oats.
Great Depression 2.0 Starting in 2030?Looking at the Dow Jones, we can see clear cycles forming on this index. I believe we could see one more major run on the Dow between now and 2030, followed by a repeat of the Great Depression. I could easily be wrong, but the charts suggest this is a very real possibility.
So, between now and our potential top in 2030, we have an opportunity to make a significant amount of money in markets like crypto.
As always, stay profitable.
– Dalin Anderson

TESLA: Can double its price ($640) by the end of the year.Tesla is neutral on its 1D technical outlook (RSI = 51.064, MACD = 4.910, ADX = 24.971), consolidating for the past week, but remains over its 1D MA50 and 1D MA200 nonetheless. Since the major market bottom on January 6th 2023, it's been trading inside a Channel Up and this is its 3rd bullish wave. The 2 prior rose by +196.67% from the bottom of the pattern (despite the 2nd breaking marginally under it). Consequently, this suggests that Tesla can rise by +100% from the current $320 level, before the Channel Up tops (HH) again. We are bullish, TP = 640.
See how our prior idea has worked out:
## If you like our free content follow our profile to get more daily ideas. ##
## Comments and likes are greatly appreciated. ##

Palo Alto Formed Bullish Pattern with 80% Return PotentialPalo Alto Networks (PANW) has technically formed a pattern similar to its 2019–2021 flat period. Back then, after two tops (points 1 and 2) and a sharp bear trap breakdown below the current range (point 3), PANW retested the upper side of the range once more (point 4), which was followed by a massive breakout. From point 3 to the top, PANW rallied 361.8% of the range width, delivering more than a 130% return in about a year and a half.
Currently, PANW appears to be forming a smaller version of that same pattern. Points 1, 2, and 3 seem to be in place, and we are now at point 4. Excluding fundamentals, if the same pattern completes, the technical target could be around $367, an over 80% potential return from current levels. However, it may be wise to wait for a confirmed breakout for validation.
On the fundamental side, PANW appears to be trading at a high valuation compared to both its historical averages and sector peers. The 2-year forward P/E average is 51.2x, while the current forward P/E sits at 55.5x not drastically higher, but still elevated. That said, Palo Alto is expected to post 14.29% year-over-year revenue growth with a strong operating margin in the upcoming earnings report.

ATI Still Has More Upside PotentialATI broke out above the key $67.35 resistance level in early May and is now attempting to consolidate its recent surge. While the stock has nearly reached the consensus analyst price target—suggesting limited near-term upside—the recent Middle East visit by Trump may have changed the outlook.
ATI is a U.S.-based specialty materials and components manufacturer, focused on high-performance metals for the aerospace, defense, and energy sectors. During Trump’s visit, large aerospace orders were announced, especially for NYSE:BA and NYSE:GE . The total value of these orders is expected to reach $115 billion.
ATI could be one of the main beneficiaries of this deal, as nearly 16% of its revenue comes from sales to Boeing and GE. In addition, broader demand growth in the aerospace and defense industries may directly or indirectly support ATI’s business.
From a valuation standpoint, ATI is currently trading at 13.9x forward earnings—26% above its two-year average. However, many valuation models and forecasts remain outdated and may not yet reflect the impact of recent developments.
If ATI pulls back to retest the $67.35 breakout level, it could present a strong buying opportunity with a close stop. The upper boundary of the trend channel, currently near $90, may serve as a medium-term target.

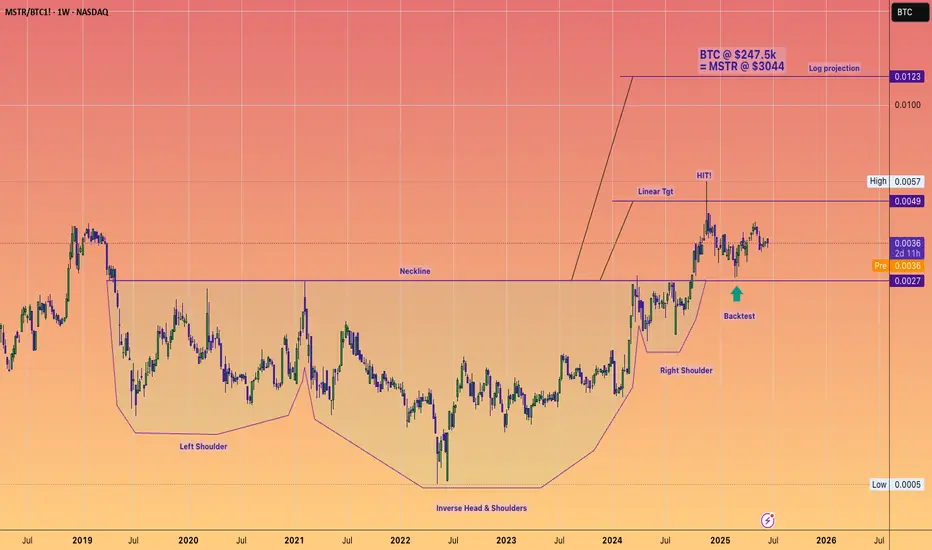
Could Microstrategy be a 1 Trillion dollar mcap company?!Microstrategy and Michael Saylor evoke a spectrum of opinions, with analysts offering a diverse range of potential future valuations.
High risk, high reward!
The destiny of Microstrategy’s market capitalization is clearly linked to Bitcoin’s performance. The company has been utilizing debt to acquire the cryptocurrency, aiming to create significant spreads. This leverage is the reason why the stock has significantly outperformed Bitcoin throughout 2024.
I am confident that Bitcoin can indeed reach $200k, with a potential upper price target of $250K for this cycle, indicating a potentially explosive Q3 and Q4.
The lingering question is how much additional FOMO and premium Saylor can cultivate for his leveraged vehicle in such an environment?
That's why charting is such a key component to any personal investing strategy IMHO, as we navigate these markets.
$6 to $27 in minutes after market open $CERONASDAQ:CERO went $6 to $27. All I did was just take safest piece of the move, bought right before halt and sold into easy gap up blowout after halt 🎯

Nightly $SPY / $SPX Scenarios for June 18, 2025🔮 Nightly AMEX:SPY / SP:SPX Scenarios for June 18, 2025 🔮
🌍 Market-Moving News 🌍
💼 Business Inventories Flat in April
U.S. business inventories held steady in April, indicating stable consumer and wholesale demand. That suggests production won't need to cut sharply in the near term, supporting GDP outlook
🏭 Industrial Production Slips
Industrial output declined 0.2% in May, signaling ongoing weakness in factory activity amid less favorable global trade conditions .
🌐 Geopolitical Pressures Persist
Heightened tension in the Middle East continues to pressure risk assets. Investors remain focused on safe-haven flows into gold, Treasuries, and defensive equities, with analysts noting the risk backdrop remains tilted to the downside
📊 Key Data Releases 📊
📅 Wednesday, June 18:
8:30 AM ET – Housing Starts & Building Permits (May)
Measures new residential construction — leading indication of housing sector health.
8:30 AM ET – Initial Jobless Claims
Tracks the weekly count of new unemployment filings — useful for spotting early labor-market weakening.
2:00 PM ET – FOMC Interest Rate Decision
The Federal Reserve is expected to hold steady. Market focus will be on any commentary that hints at future tightening or easing plans.
2:30 PM ET – Fed Chair Powell Press Conference
Investors will parse Powell’s remarks for guidance on rate paths, inflation trends, and economic risks.
⚠️ Disclaimer:
This is for educational/informational purposes only and does not constitute financial advice. Consult a licensed advisor before making investment decisions.
📌 #trading #stockmarket #economy #housing #Fed #geo_risk #charting #technicalanalysis

SMCI: First 1D Golden Cross in years just formed.Super Micro Computer turned marginally bullish on its 1D technical outlook (RSI = 55.363, MACD = 1.620, ADX = 16.124) but is essentially neutral, consolidating practically for the past month. They big news is that today it is forming the first 1D Golden Cross since June 1st 2020, the period after the COVID crash recovery. Trading inside a Channel Up and given the Inverse Head and Shoulders being formed, we expect the stock to target its 2.0 Fibonacci extension (TP = 83.00).
## If you like our free content follow our profile to get more daily ideas. ##
## Comments and likes are greatly appreciated. ##

Let's Buy Reddit TodayTrading Fam,
After missing an initial entry on Reddit when my indicator gave me a buy, we double-topped and then came back down into our liquidity block. This has given me a second chance for a decent entry. I will be targeting $158-170 with a SL currently set at $75.
Stew

MU Options Insight: Bulls Eyeing $123Fundamental Overview
Micron Technology's $200 billion expansion plan aligns with the broader push for domestic semiconductor manufacturing. The company is investing $150 billion in fabrication plants across Idaho, New York, and Virginia, while $50 billion is allocated for high-bandwidth memory packaging and R&D. This move strengthens Micron’s position in AI-driven demand and supply chain resilience.
The CHIPS and Science Act funding of $6.4 billion and eligibility for the Advanced Manufacturing Investment Credit further bolster Micron’s financial outlook. CEO Sanjay Mehrotra emphasized that this expansion will create tens of thousands of jobs and reinforce U.S. tech leadership.
Technical Analysis
Micron’s stock is currently near a 12-month high, up 37% year to date. The momentum remains strong, with institutional activity suggesting bullish sentiment.
- Options Flow Insight: A vertical bull spread was spotted in Times & Sales, with 118 strike contracts executed on the ask and 123 strike contracts executed on the bid simultaneously. This suggests a bullish stance, as traders anticipate further upside.
- Expiration Consideration: The June 20 expiration (4 days away) indicates a short-term bullish outlook, likely targeting a breakout above $123.
- Institutional Positioning: The 500 additional contracts at 118 reinforce the bullish bias. If MU moves beyond $123, traders holding the spread still profit, confirming strong conviction in upside potential.

Nightly $SPY / $SPX Scenarios for June 17, 2025🔮 Nightly AMEX:SPY / SP:SPX Scenarios for June 17, 2025 🔮
🌍 Market-Moving News 🌍
📈 U.S. Retail Spending Holds Firm
May’s retail sales were flat month-over-month, defying expectations of a slowdown. Core retail sales (ex-autos) edged up +0.2%, signaling resilience in consumer purchases—an encouraging sign for economic momentum
🤖 Tesla’s Robotaxi Buzz Accelerates
Tesla stock surged after a weekend robotaxi video surfaced ahead of its planned Austin launch. A viral clip showed a Model Y “robotaxi” navigating traffic autonomously, sparking fresh investor enthusiasm despite safety debates
📊 BoJ Holds Rates; Dollar Edges Higher
Japan’s central bank left policy unchanged at 0.5%, maintaining its dovish bias. This lifted the dollar slightly versus the yen, drawing focus to global interest-rate divergence
📊 Key Data Releases 📊
📅 Tuesday, June 17:
8:30 AM ET – Retail Sales (May)
Consumer purchases are tracked, excluding autos. Monitor if activity stays steady despite inflation and rate pressures.
9:15 AM ET – Industrial Production & Capacity Utilization (May)
Provides insight into factory activity and plant usage—a gauge of economic health amid global slowdown concerns.
10:00 AM ET – Business Inventories (April)
Shows stock levels held by wholesalers and manufacturers. Higher inventories with weaker sales may signal slowing demand.
⚠️ Disclaimer:
This information is for educational and informational purposes only and should not be construed as financial advice. Always consult a licensed financial advisor before making investment decisions.
📌 #trading #stockmarket #economy #news #trendtao #charting #technicalanalysis

Markets rally as missiles fly | how long can risk be ignored? Markets may be underpricing Israel and Iran risk.
Despite continued fighting—including high-impact strikes and rising casualties—global equities moved higher to start the week.
U.S. indices led the advance, with the Nasdaq gaining 1.5%, followed by the S&P 500 and Dow. Earlier in the session, European and Asian markets also closed higher, with Germany’s DAX up 0.8% and Japan’s Nikkei rising 1.3%. Now Asian markets are set to open for the second trading day of the week.
Tensions escalated further on Monday as Israel launched drone strikes on Iran’s state-run IRINN television headquarters in Tehran, interrupting a live broadcast. Additional Israeli attacks hit the South Pars gas field. In retaliation, Iran launched a fresh wave of missile attacks into Israel, killing at least five people.

AMD First touch of 1W MA50 after 8 months!Advanced Micro Devices (AMD) hit today its 1W MA50 (blue trend-line) for the first time in almost 8 months (since October 28 2024). This is a crucial test as the las time this level broke as a Resistance following a Channel Up bottom rebound was on the week of January 30 2023.
When that happened, the Bullish Leg extended the upside to complete a +143.12% rise, before the next 1W MA50 pull-back.
As a result, if we close the week above the 1W MA50, we expect to see $185 before the end of the year.
-------------------------------------------------------------------------------
** Please LIKE 👍, FOLLOW ✅, SHARE 🙌 and COMMENT ✍ if you enjoy this idea! Also share your ideas and charts in the comments section below! This is best way to keep it relevant, support us, keep the content here free and allow the idea to reach as many people as possible. **
-------------------------------------------------------------------------------
💸💸💸💸💸💸
👇 👇 👇 👇 👇 👇

HUGE $1.45 to $10.84 in hours +647% run with Double Buy! $SRMMentioned it in chat early premarket, then warned again as it started setting up. Buy Alert twice with $5.86 average price and waiting for the new highs blowout.
Huge win into the strong push 💸✈️ NASDAQ:SRM

$3 to $20 in 1 day! 517% verticalPrice action was signaling $20 so I alerted a buy in teens and said if you don't mind swings give it a chance for $20. Soon after we got the $20 for an awesome win! NASDAQ:RBNE

Oracle (ORCL) shares surge 24% in a week, hitting all-time highOracle (ORCL) shares surge 24% in a week, hitting an all-time high
Last week, Oracle (ORCL) shares:
→ rose by approximately 24% — marking the strongest weekly gain since 2001;
→ broke through the psychological level of $200 per share;
→ reached an all-time high, with Friday’s session closing above $215. It is possible that a new record may be set this week.
What’s driving Oracle (ORCL) shares higher?
The main catalyst was the quarterly earnings report released last week:
→ Earnings per share ($1.70) exceeded analysts’ expectations ($1.64);
→ CEO Safra Catz projected revenue growth of 12–14% in upcoming quarters;
→ Company founder Larry Ellison highlighted “astronomical” demand for data centres, as well as Oracle’s competitive edge in building and servicing them.
Notably, Oracle provides infrastructure services for both OpenAI and Meta Platforms.
Technical analysis of ORCL shares
ORCL shares have shown high volatility throughout 2025, largely influenced by news surrounding Donald Trump. His promises to strengthen the US position in AI served as a bullish signal, while plans to impose international trade tariffs had a bearish impact.
As a result, a broad upward channel has formed on the chart, with the following key observations:
→ the price has repeatedly bounced sharply from the lower boundary (1), indicating strong demand;
→ by early June, the price had risen and stabilised near the channel’s median line (2).
Currently, the ORCL chart shows that the earnings-driven rally has pushed the price into the upper quartile (3) of the channel.
With the RSI indicator at extreme highs, it is reasonable to assume that ORCL may be vulnerable to a pullback. However, if a correction does occur, it is unlikely to be deep — perhaps testing the psychological $200 level — given the company’s strong fundamentals.
This article represents the opinion of the Companies operating under the FXOpen brand only. It is not to be construed as an offer, solicitation, or recommendation with respect to products and services provided by the Companies operating under the FXOpen brand, nor is it to be considered financial advice.

NAS100 - Stock market awaits an important week!The index is above the EMA200 and EMA50 on the 4-hour timeframe and is trading in the specified pattern. If it does not rise again above the broken trend line, I expect a correction.
If the index returns above the broken trend line, we can expect a new ATH to be recorded on the Nasdaq. It is better to wait for confirmation on the breakout in order to control further risk.
Last week, U.S. stock markets—particularly the Nasdaq index—experienced significant volatility, driven by a combination of economic and geopolitical factors:
• A reduction in trade tensions due to ongoing U.S.-China negotiations
• The release of inflation indicators
• Heightened geopolitical tensions
According to Politico, as G7 leaders meet in Canada, the escalating conflict between Israel and Iran will top the agenda. Politico reported that leaders of the free world have gathered in the Rocky Mountains to discuss the very real threat of a full-scale war in the Middle East. The initial sessions of the G7 summit will take place in Kananaskis, where the worsening Israel-Iran conflict will be the primary focus. Donald Trump, who in recent days has fueled tensions through social media, is now expected to join discussions aimed at de-escalation.
On the economic front, lower-than-expected inflation in May could encourage the Federal Reserve to cut interest rates sooner than markets had previously anticipated. On Wednesday, the Bureau of Labor Statistics reported that inflation rose 2.4% in May compared to a year earlier. Housing costs were identified as the primary driver of this inflation, while price increases in categories most affected by high tariffs were not as pronounced as economists had expected. So far this year, the Fed has refrained from cutting its benchmark interest rate, citing concerns that tariffs might push consumer prices higher. While the likelihood of a rate cut at this week’s meeting remains low, the latest report could ease some of these worries and accelerate the timeline for potential cuts.
Meanwhile, Bloomberg reported that a growing group of President Trump’s advisers is urging him to consider Besant for the Fed chair position. Jerome Powell’s current term extends until May 2026, and he was originally nominated by Trump in November 2017. Other names reportedly under consideration include Kevin Warsh (considered a favored candidate), Kevin Hassett (head of the White House National Economic Council), Christopher Waller (a current Fed board member), and David Malpass (former World Bank president).
After a week dominated by U.S. inflation data, investor attention in the coming days will shift toward central bank decisions and potential signals regarding the future path of interest rates. The trading week kicks off Monday with the Empire State Manufacturing Index, offering an initial snapshot of the industrial sector in New York. Later that day, the Bank of Japan will announce its first interest rate decision, an event that could shape Asian market trends and the yen’s valuation.
On Tuesday, May’s U.S. retail sales data will be released—a key indicator of consumer strength. Signs of weakness in this report could bolster expectations for rate cuts. Wednesday will be the focal point of the week, as the Federal Reserve announces its policy decision. While markets have already priced in a pause in tightening, investors will scrutinize Jerome Powell’s remarks for clues on the likelihood of rate cuts in the months ahead. Additionally, data on May housing starts and weekly jobless claims will also be released that day.
On Thursday, with U.S. markets closed for Juneteenth, attention will turn to monetary policy decisions from the Swiss National Bank and the Bank of England. Changes in tone or interest rates from these key European central banks could influence currency market volatility. Finally, the week will conclude Friday with the release of the Philadelphia Fed Manufacturing Index—a leading indicator closely watched by traders for insights into the health of the manufacturing sector in the U.S. East.
