Apple (AAPL) share price slips towards psychological $200 levelApple (AAPL) share price slips towards psychological $200 level
Yesterday, Apple shares (AAPL) fell by 2.5%, edging closer to the key psychological threshold of $200. Moreover, the stock is underperforming the broader market, which reached new highs earlier this week — a move AAPL has yet to replicate.
Why is AAPL’s stock price declining?
According to media reports, investors may have grown concerned after OpenAI acquired a startup founded by Jony Ive, Apple’s former chief designer, for $6.5 billion.
The move is being interpreted as OpenAI’s first step toward launching a physical AI-powered device — one that could, eventually, pose a challenge to Apple’s hardware, even if not in the near term.
Technical analysis of the AAPL chart
Bulls may be hoping the AAPL price finds support at the confluence of two key levels:
→ the psychological $200 mark;
→ support from the second half of May (the lower blue trendline).
However, the broader technical context raises some bearish concerns:
→ the $215–222 zone, which previously acted as support, is now capping price advances (as highlighted by the arrows);
→ the red descending channel appears to define the current trend trajectory — and its relevance may be reinforced if the price drops and consolidates near its median line, signalling a balance between buying and selling pressure.
This article represents the opinion of the Companies operating under the FXOpen brand only. It is not to be construed as an offer, solicitation, or recommendation with respect to products and services provided by the Companies operating under the FXOpen brand, nor is it to be considered financial advice.
Stocks

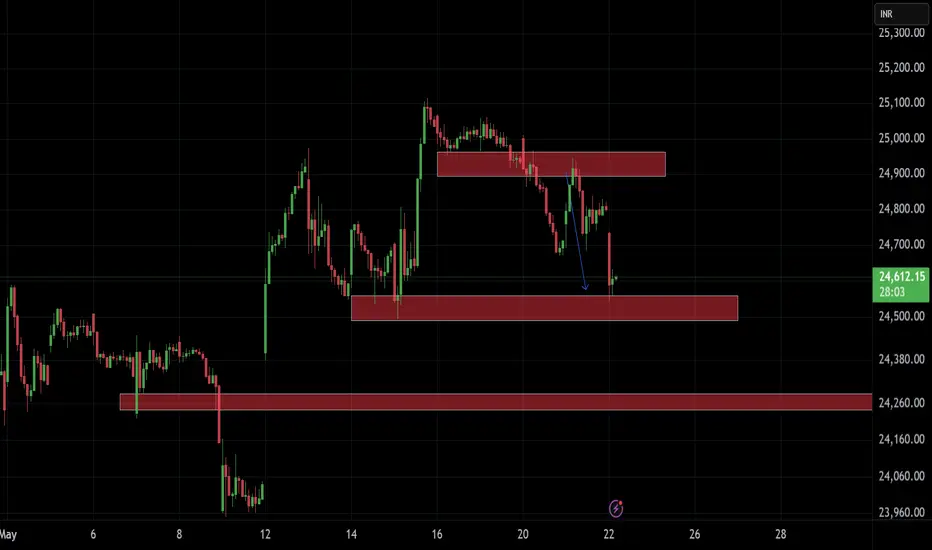
NIFTYI see these levels on Nifty. Forgot to paste the good shorting trade opportunity yesterday, however shared 2 charts with analysis of gift nifty which hinted short for market from past 2 days. Don't go into patterns and take early trades trade only when levels break or sustain.
Nightly $SPY / $SPX Scenarios for May 22, 2025 🔮 Nightly AMEX:SPY / SP:SPX Scenarios for May 22, 2025 🔮
🌍 Market-Moving News 🌍
📈 Treasury Yields Surge Amid Weak Bond Auction
U.S. Treasury yields continued their upward trajectory, with the 10-year yield nearing 4.6% and the 30-year yield surpassing 5%, marking the highest levels since early 2023. This increase followed a weak $16 billion auction of 20-year bonds, which attracted less investor demand and sold at higher-than-expected yields. Factors contributing to the rise include fading recession fears, persistent inflation concerns, and growing fiscal worries related to potential tax cut extensions.
📉 Stock Market Declines as Tech Stocks Retreat
The stock market experienced significant losses, with the Dow Jones Industrial Average dropping 1.9%, falling below its 200-day moving average. The S&P 500 and Nasdaq fell 1.6% and 1.4%, respectively.
💼 Snowflake ( NYSE:SNOW ) Reports Strong Earnings
Snowflake Inc. reported record quarterly revenue of $1.04 billion, surpassing expectations. Product revenue increased 26% year-over-year to $996.8 million. The company raised its full-year forecast to $4.325 billion, reflecting a 25% year-over-year increase. Despite a GAAP net loss of $430 million, Snowflake posted an adjusted profit of 24 cents per share, exceeding the 21-cent estimate.
📊 Morgan Stanley Turns Bullish on U.S. Stocks
Morgan Stanley has shifted to a bullish stance on U.S. stocks and bonds, raising its outlook due to signs of market stabilization and improving growth conditions. The bank maintains a base target of 6,500 for the S&P 500 by mid-2026, with a bullish scenario projecting 7,200.
📊 Key Data Releases 📊
📅 Thursday, May 22:
8:30 AM ET: Initial Jobless Claims
9:45 AM ET: S&P Global Flash U.S. Services PMI for May
10:00 AM ET: Advance Services Report (First Quarter 2025)
⚠️ Disclaimer:
This information is for educational and informational purposes only and should not be construed as financial advice. Always consult a licensed financial advisor before making investment decisions.
📌 #trading #stockmarket #economy #news #trendtao #charting #technicalanalysis

TESLA: Can it worth $4,000 a share buy end of 2026?Tesla is bullish on its 1D technical outlook (RSI = 65.527, MACD = 22.160, ADX = 43.922, being on a bullish wave to recover the ATH. Since the 2019 low the prevailing long term pattern is a Channel Up and the recent Feb-March correction resembles COVID's in March 2020. If that's the case then the stock is on a powerful long term bullish wave that can reach the 4.5 Fibonacci extension before the 5.0 time Fib. This implies that TSLA price per share can be $4,000 by the end of 2026. Do you think that's realistic?
See how our prior idea has worked out:
## If you like our free content follow our profile to get more daily ideas. ##
## Comments and likes are greatly appreciated. ##

At this point market successfully taped into the!Gold Market Analysis – Bullish Momentum Building
Gold has recently broken through a significant call option (CE) resistance level, signaling heightened bullish aggression among market participants. This breakout suggests that buyers are currently in control, pushing prices decisively above the CE threshold.
At this point, the market has successfully tapped into the previous swing low liquidity and appears to be forming buy-side liquidity above the current price action. With this structure, we anticipate a potential move toward the Fair Value Gap (FVG) zone marked on the chart. A clean breakout above this FVG, followed by a retest and successful hold of that level, would serve as a strong confirmation of continued bullish intent.
Should this scenario play out, our next upside targets lie in the 3320–3330 range. Traders are advised to monitor price action closely and wait for confirmation signals before making entries. Strategic decision-making is key—avoid emotional trading and prioritize high-probability setups.
Disclaimer: This analysis is for educational and informational purposes only and does not constitute financial advice. Always conduct your own research (DYOR) before making any investment decisions.

Encounter Resistance And Reverse Direction Educational Forex Trading Insight – EUR/USD Potential Bearish Scenario
This content is intended for educational purposes only and aims to help traders understand how a possible sell setup in the EUR/USD currency pair might be analyzed. It is not a signal or financial advice, but rather a breakdown of a potential market scenario based on technical observations.
---
Currency Pair: EUR/USD
Market Outlook: Bearish (Short Position Scenario)
Suggested Sell Zone:
A possible area of interest for initiating a short position lies between 1.13430 and 1.13520, where the price may encounter resistance and reverse direction. This zone could offer a favorable risk-to-reward setup for experienced traders identifying signs of bearish confirmation.
Risk Management – Stop Loss:
A stop-loss order should be placed based on your personal trading strategy and risk tolerance. It is generally advisable to position it above the resistance area to account for potential volatility or fake breakouts.
Potential Price Targets:
First Target (TP1): 1.13159 – Near-term support level
Second Target (TP2): 1.12970 – Deeper retracement zone
Third Target (TP3): 1.12800 – Stronger historical support
Additional downside may develop if bearish momentum continues beyond these levels
---
Important Notice:
This analysis is for informational and educational purposes only. Trading foreign exchange on margin carries a high level of risk and may not be suitable for all investors. Always conduct your own research (DYOR) and consider consulting a licensed financial advisor before making any trading decisions. Proper risk management and discipline are essential for long-term success in the markets.

+60% gain overnight with Buy & Hold overnight $4 to $6.50 $EDBLEASY 💰 +60% profit overnight with BUY & HOLD Alert sent at market close yesterday $4.00 🚀 this morning it's up at $6.50+
🤑 NASDAQ:EDBL
The technical analysis was simply too good to miss out on, the pop was either going to happen after hours, premarket or right after market open today so it only made sense to get in for after hours to be sure!

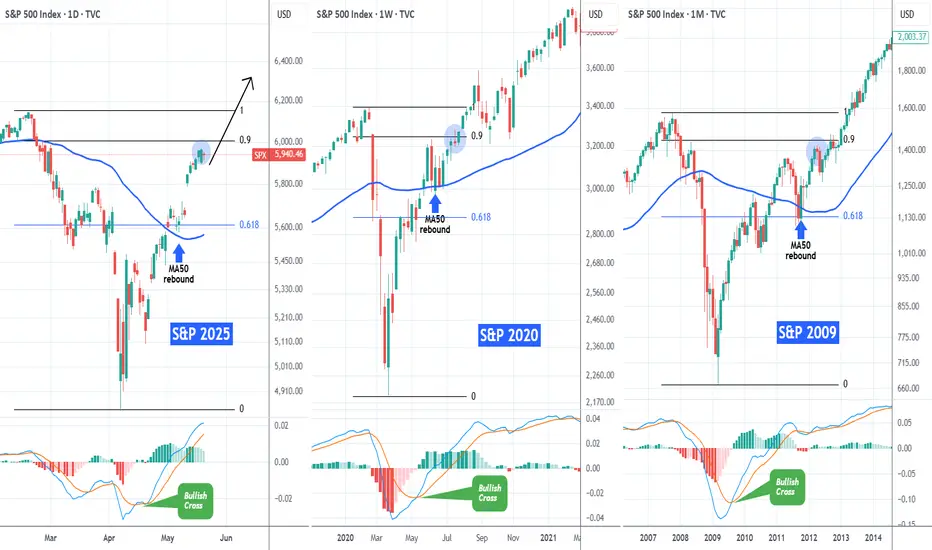
S&P500 Same recovery path with 2020 and 2009The S&P500 index (SPX) has recovered almost 90% of its losses since the February 19 2025 All Time High (ATH) and many have already started calling for a technical correction.
If we compare however this 2025 Tariff fueled correction with the recent most aggressive ones (COVID crash in 2020 and Housing Crisis 2008/2009) we see a different picture.
On their respective 0.9 Fibonacci levels (close to which we are today), both of those market recoveries went straight to new ATHs, without testing their MA50 (blue trend-line) until the next Cycle peak. They had that tested before when the price was trading near (or on)the 0.618 Fib. Notice also how a MACD Bullish on all three charts, confirmed the aggressive recovery pattern straight after the bottom.
Instead of a correction, history shows that we might be looking at new ATH soon.
-------------------------------------------------------------------------------
** Please LIKE 👍, FOLLOW ✅, SHARE 🙌 and COMMENT ✍ if you enjoy this idea! Also share your ideas and charts in the comments section below! This is best way to keep it relevant, support us, keep the content here free and allow the idea to reach as many people as possible. **
-------------------------------------------------------------------------------
💸💸💸💸💸💸
👇 👇 👇 👇 👇 👇
Angel One: Watch for Breakout or Pullback!Current Price: ₹2866
Resistance: ₹3000 🔼
Support: ₹2578 🔽
📊 Technical Snapshot:
Angel One is hovering near the crucial ₹2866 level. With resistance at ₹3000, a break above could signal a strong bullish breakout. On the flip side, if rejected, we may revisit the ₹2578 support zone for a possible bounce.
📌 Trade Ideas:
Bullish: Entry above ₹2900 with a target of ₹3000–₹3050. SL: ₹2840
Bearish: Short near ₹2990 with tight SL above ₹3010. Target: ₹2750–₹2600
🔍 What to Watch:
Volume near ₹3000
Price action around ₹2578 if correction sets in
RSI/Daily trend for momentum confirmation
💬 Your View? Are you bullish or bearish on Angel One this week?
#AngelOne #TradingView #StockAnalysis #AngelOneShare #TechnicalAnalysis #NSEStocks #BreakoutAlert #SupportAndResistance #SwingTrade #DayTradingIdeas

Tesla (TSLA) Shares Rebound on Musk’s CommentsTesla (TSLA) Shares Rebound on Musk’s Comments
According to media reports, speaking via video link at the Qatar Economic Forum, Elon Musk stated that he plans to:
→ remain Tesla’s CEO for another five years;
→ reduce his focus on politics, saying he feels he has already done enough;
→ increase his stake in the company from 12.5% to 25%.
These comments, which came alongside news that Tesla will begin testing robotaxis in Texas in June, sparked renewed interest in Tesla (TSLA) shares. TSLA stock outperformed other MAG7 members, climbing above the $353 mark at yesterday’s peak — its highest level since late February 2025.
Just ten days ago, when the price was still below the psychological $300 level, we highlighted TSLA’s strength following its rebound from the $220 support area and suggested a bullish outlook. But is the picture still as optimistic today?
Technical Analysis of TSLA Chart
The chart shows that TSLA is trading within an ascending channel (highlighted in blue), with the price currently near the upper boundary — an area that often acts as resistance. Price action supports this: note the two large candlesticks with closes near their lows (indicated by arrows), suggesting strong bearish pressure.
This gives reason to believe that sellers may take advantage of the roughly 22% rise in the TSLA stock price to lock in profits — a potentially bearish signal. Traders should therefore consider a correction scenario in which the local support at point Q could be tested for resilience.
This article represents the opinion of the Companies operating under the FXOpen brand only. It is not to be construed as an offer, solicitation, or recommendation with respect to products and services provided by the Companies operating under the FXOpen brand, nor is it to be considered financial advice.

Nightly $SPY / $SPX Scenarios for May 21, 2025🔮 Nightly AMEX:SPY / SP:SPX Scenarios for May 21, 2025 🔮
🌍 Market-Moving News 🌍
🇺🇸 G7 Finance Ministers Convene Amid Tariff Tensions
Finance ministers from G7 nations are meeting in Banff, Alberta, focusing on restoring global stability and growth. Discussions are expected to address excess manufacturing capacity, non-market economic practices, and financial crimes. Tensions may arise due to recent U.S. tariffs affecting multiple G7 nations.
🛢️ Oil Prices Rise on Geopolitical Concerns
Oil prices increased over 1% following reports that Israel may be preparing a military strike on Iranian nuclear facilities. Such actions could disrupt Middle East oil supplies, particularly if Iran blocks the Strait of Hormuz, a vital passage for crude exports.
📈 Retail Earnings in Focus
Major retailers, including Lowe's ( NYSE:LOW ), Target ( NYSE:TGT ), and TJX Companies ( NYSE:TJX ), are set to report earnings today. Investors will be closely monitoring these reports for insights into consumer spending patterns amid ongoing economic uncertainties.
📊 Key Data Releases 📊
📅 Wednesday, May 21:
10:00 AM ET: State Employment and Unemployment (Monthly) for April 2025
10:30 AM ET: EIA Crude Oil Inventory Report
⚠️ Disclaimer:
This information is for educational and informational purposes only and should not be construed as financial advice. Always consult a licensed financial advisor before making investment decisions.
📌 #trading #stockmarket #economy #news #trendtao #charting #technicalanalysis

Tesla Faces Resistance, Conclusion: 1,206 New All-Time High?The Tesla stock, TSLA, is facing resistance right now; what to expect?
Expect additional growth but...
Good afternoon my fellow trader, Tesla will continue growing, mark my words.
Volume has been rising now since January 2024, that's a long time. Almost a year and a half with more and more action joining this stock and this is one of the most traded stocks in the whole world. Increasing volume is a very strong bullish signal.
The highest volume session came on the 7-April week and this week closed green. It produced the highest volume since February 2023.
Back in 2023, trading volume started to rise in January and this signaled the start of a long-term bullish trend, higher highs and higher lows. This trend is still valid today.
The bullish bias is confirmed. Let me show you.
» EMAs:
TSLA trades above all moving averages, short-term and long-term. Incl. SMA200 and EMA89/55.
» MACD bullish cross:
This is a very strong signal. Last week the MACD produced a bullish cross and is now coming out of the bearish zone. This is bullish for two reasons, the histogram turns green and there is plenty of room available for additional growth. In a way, this signal shows that the bullish wave is only starting now and that it will continue long-term. This MACD signal doesn't show up unless a bullish wave is coming. You can look back at the weekly MACD and confirms this for yourself. Each time the b-cross is in, this stock grows for months.
» RSI bullish zone (57.63):
To be honest, I don't like how the RSI is looking but we have the classic higher highs and higher lows pattern. The reading is bullish and shows plenty of room available for growth. It could be better though but still, leaning up and supporting more up.
» RENKO (weekly):
Clearly bullish. This confirms TSLA is in an uptrend now and will keep going higher.
» RENKO (daily):
In the daily RENKO chart the bullish bias/signal is even more pronounced, meaning, no room for doubts.
» To end this 'it is obvious Tesla will continue rising technical analysis', let's consider the monthly timeframe:
— We have a perfect rising channel.
— There is a rounded bottom (orange) which is a reversal signal.
— There is a hammer candlestick last month which is also a reversal signal.
— This month is full green which confirms both the hammer and rounded bottom as reversal signals.
All these signals are saying that the bullish trend will continue now.
Last month produced the highest volume since June 2023.
» Tesla (TSLA) is going up.
Namaste.

Nu Holdings (NU, 1D) — Technical AnalysisNu Holdings (NU, 1D) — Technical Analysis: Trendline Breakout, EMA/MA Confirmation, Recovery Toward Key Levels
On the daily chart, Nu Holdings has broken out of a descending trendline, signaling a potential structural reversal. The breakout was confirmed by a close above key exponential and simple moving averages (EMA 50/100/200), with the EMAs beginning to align in a bullish sequence. The price has held above the critical Fibonacci retracement level at $11.73 (0.618), which now serves as a key demand zone. Volume shows signs of increasing during upward impulses, suggesting accumulation interest. The current recovery structure indicates potential targets at $12.58 (0.5 Fibonacci), followed by $13.42 (0.382) and $14.46 (0.236). A more extended move could lead toward the previous supply zone near $16.15 if momentum persists.
From a fundamental standpoint, Nu Holdings continues to attract investor attention within the fintech sector, especially amid broader rotation back into growth and tech-driven financial platforms. The company's expanding market presence and improving financial metrics may support the current technical setup. As long as the price holds above the broken trendline and maintains strength above the key $11.73 level, the bullish scenario remains in focus with targets pointing toward the $13.42–$14.46 range and potentially higher in the medium term.

EVLV 1WEVLV — a rectangle pattern has formed, and the 100 MA has crossed above the 200 MA, signaling the start of a potential trend reversal. Targets: $8.29 and $12.94.
As of May 2025, the fundamental outlook for Evolv Technologies Holdings Inc. (ticker: EVLV) is as follows:
The company continues to show strong revenue growth and improving key financial metrics, despite remaining unprofitable. Revenue for 2024 reached $103.9 million, up 31% from 2023, while the net loss was halved to $54 million. EBITDA improved to -$21 million from -$51.8 million the year before. Annual recurring revenue (ARR) grew by 39% to $99.4 million. The company maintains a strong financial position with $51.9 million in cash and zero debt.
The stock is currently trading at $4.44, above its estimated intrinsic value of $2.76 according to AlphaSpread. Analysts remain optimistic, giving EVLV a “Strong Buy” rating and forecasting an average price target of $5.31, suggesting about 19.6% upside potential.
However, investors should keep in mind that the company is still unprofitable, and the current market valuation exceeds its fundamental value.

CATL’s HK Debut IGNITES EV Revolution Tesla’s Secret Weapon?🔥 CATL’s HK Debut IGNITES EV Revolution Tesla’s Secret Weapon?
BOOM! Chinese battery king CATL ($CATL.HK) just skyrocketed in its Hong Kong debut, defying Pentagon blacklists. Powering Tesla, VW, and Mercedes, it’s the EV supply chain’s 800-lb gorilla. Funds are pouring in for global domination miss this, and you’re sidelined!
⚡️ Pro Tip: EV stocks are heating up, but US-China tensions could crash the party. Watch NYSE:NIO , NASDAQ:LI too!
🚀 Share this if you’re bullish on EVs! What’s your top EV pick?

$3's to $7's catching easiest vertical part of the chart $SYTAGot to let the stock evolve properly, once enough of shortsellers are trapped inside they can only try to manipulate with crash attempts and when even those don't work out they're forced to cover (buy to exit their short position) into vertical push, and those amounts cannot be just clicked out in a second, it takes time to scale in and it takes time to scale out. The only problem is when it's in a bullish uptrend it gets faster and wilder.
Sent out Buy Alert for $3.80 buy expecting vertical and we got it! NASDAQ:SYTA

NVIDIA The 1W MA100 rebound is targeting $225 at least.NVIDIA Corporation (NVDA) broke last week above its 1W MA50 (blue trend-line) for the first time in 2.5 months and all this is generated by April's bottom rebound on the 1W MA100 (green trend-line).
The 1W MA100 has been intact since January 23 2023, so this rebound technically initiates a new Bullish Leg. Since the December 2018 bottom (previous U.S. - China Trade War), the minimum rise on such a Bullish Leg has been +156.11%. As a result, NVIDIA can now target $225 at least before the end of 2025.
-------------------------------------------------------------------------------
** Please LIKE 👍, FOLLOW ✅, SHARE 🙌 and COMMENT ✍ if you enjoy this idea! Also share your ideas and charts in the comments section below! This is best way to keep it relevant, support us, keep the content here free and allow the idea to reach as many people as possible. **
-------------------------------------------------------------------------------
💸💸💸💸💸💸
👇 👇 👇 👇 👇 👇

UnitedHealth (UNH) Share Price ReboundsUnitedHealth (UNH) Share Price Rebounds
A month ago, in our analysis of the UNH chart, we:
→ highlighted that UnitedHealth shares had lost nearly 23% in value;
→ drew a descending channel and suggested that bearish pressure could continue, threatening the support level around $450, which had held since early 2022.
Since then, UNH’s stock price decisively broke below that level (as marked by the arrow), falling to around $250 — its lowest point since spring 2020 — before staging a sharp rebound. This steep price movement was driven by a series of fundamental developments, including:
→ the resignation of the CEO and news of a Department of Justice investigation into potential Medicare fraud;
→ UnitedHealth withdrawing its earnings guidance for the coming year;
→ political debates over the Medicaid programme as part of the 2025 budget negotiations;
→ President Trump’s directive to cut prescription drug prices.
Recent news that the new CEO and several top executives have bought tens of millions of dollars’ worth of UNH shares appears to have renewed investor confidence — the share price rose above the $300 mark yesterday.
Technical Analysis of UNH Share Chart
These latest developments justify an update to the descending channel configuration. Of particular note is the gradual decline with limited volatility — a sign that the price is moving along the channel's median line (highlighted on the chart).
In this setup:
→ the bounce from the $250 level points to the lower boundary of the channel;
→ traders may consider a scenario where the current recovery pushes UnitedHealth stock towards the median, after which supply pressure may return and offset the recent dominance of demand.
It’s also possible that the key psychological level of $300 could now act as support.
This article represents the opinion of the Companies operating under the FXOpen brand only. It is not to be construed as an offer, solicitation, or recommendation with respect to products and services provided by the Companies operating under the FXOpen brand, nor is it to be considered financial advice.

Apple respite before sell offApple bounced straight of major support at circa $170, with the SMI now also rising we could see a few weeks of short term respite before continuing down to test the major support line again. Also notice a backtest of the rising trend at around 21%.
Long term view is still bearish, don't think we've seen the yearly bottoms yet. Will be interesting to see how this plays out especially with bonds.

Bitcoin has recently touched its weekly Fair Value GapBitcoin (BTC) Market Update
Bitcoin has recently touched its weekly Fair Value Gap (FVG) and is now showing upward momentum. This price behavior is aligning with a potential transition from an Intermediate Reversion Level (IRL) to an Extended Reversion Level (ERL), suggesting the formation of a structured bullish model.
Given the current positive market sentiment surrounding BTC and the fact that the asset has already absorbed significant sell-side liquidity, the potential for further upward movement remains strong. There is a possibility that the market could aim for the 110K level in the near term if bullish conditions persist.
Investors and traders are advised to monitor the market closely as this structure develops, considering both technical indicators and macroeconomic influences to make informed decisions.
DYOR!

Nightly $SPY / $SPX Scenarios for May 20, 2025🔮 Nightly AMEX:SPY / SP:SPX Scenarios for May 20, 2025 🔮
🌍 Market-Moving News 🌍
📉 Bear Market Concerns Emerge
Veteran investor David Kotok warns of a potential bear market, projecting that tariffs could reduce S&P 500 earnings per share from $260 to $230 over the next year. This outlook suggests a possible decline of the index to the 4,000–4,400 range, with elevated Treasury yields further pressuring valuations.
🚢 Retail Inventory Challenges Amid Tariff Uncertainty
The Port of Los Angeles reports potential lower inventories for retailers due to ongoing U.S.-China tariff uncertainties. Despite a temporary 90-day tariff reduction, complexities in forecasting cargo volumes persist, potentially leading to fewer product choices and rising prices for consumers.
🛍️ Retail Earnings Spotlight
Major retailers, including Home Depot ( NYSE:HD ), are set to report earnings today. Investors will closely monitor these reports for insights into consumer spending patterns amid economic uncertainties.
💬 Federal Reserve Officials Scheduled to Speak
Federal Reserve officials, including Richmond Fed President Tom Barkin and Boston Fed President Susan Collins, are scheduled to speak today. Their remarks will be scrutinized for indications of future monetary policy directions.
📊 Key Data Releases 📊
📅 Tuesday, May 20:
10:00 AM ET: Labor Force Characteristics of Foreign-born Workers (Annual 2024)
10:00 AM ET: State Job Openings and Labor Turnover for March 2025
⚠️ Disclaimer:
This information is for educational and informational purposes only and should not be construed as financial advice. Always consult a licensed financial advisor before making investment decisions.
📌 #trading #stockmarket #economy #news #trendtao #charting #technicalanalysis

zSpace (IPO) NEW LISTINGA tech company called zSpace priced very low inline with the types of people that like to buy low cost stock, i.e. cryptocurrency investors. As for what the company does and if the company will succeed, only time will tell.

etoro (new listing)stock listing of ETORO to NASDAQ, I've heard of this company. Most of the time when a company that most people have heard of is listed there is a higher chance of the company doing well. As of right now the price is only in the red since the date of listing. The listing price was supposed to be around $46-$50 so officially the stock market, as usual, is not showing the truth; based on being compared to cryptocurrency prices. The listing shows that the price started at a peak which was probably after a bunch of pre-market trades happened and bumped the price up. That was not the true entry IPO list price.
