$2.55 to $9.30 $VEEE$2.55 to $9.30 NASDAQ:VEEE was just one of awesome movers to give great payday if you weren't too greedy 💵
Stocks that make +300% +500% moves in a day out of nowhere can also come out with offering news as company tries to get paid from the move which just happened in the market. That is the reason of stock drop and it usually happens outside of regular hours so if you buy in the morning you can ride it whole day if you want, but it's smart to lock some if not all of the massive profit into end of day and the get back in again next morning if no offering news.
Stocks

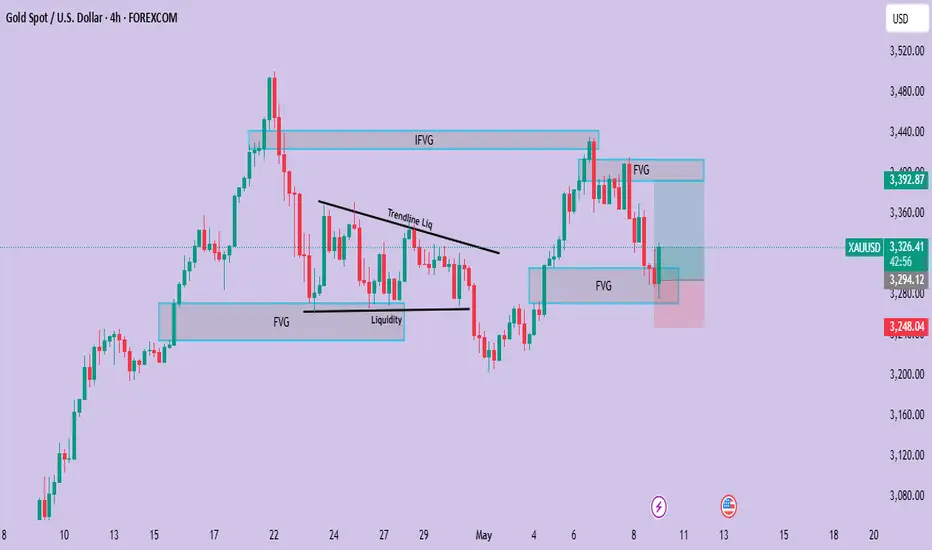
From this point, there is potential for an upward move.Gold (XAUUSD) Analysis
Recently, we’ve seen Gold consistently respecting Fair Value Gaps (FVG). Whenever a bullish FVG forms, price tends to just touch it before moving upward. Similarly, when a bearish FVG appears, the market tends to reject from that point.
Interestingly, we also observed that the market has cleared previously built liquidity right as it tapped the FVG — including both buy-side and sell-side liquidity. Currently, after dropping from a bearish FVG, price is rebounding from a bullish FVG.
From this point, there is potential for an upward move, with a target around $3375. A potential entry zone lies between $3302 and $3280. It's important to watch the market closely and, as always, do your own research (DYOR)!
Nightly $SPY / $SPX Scenarios for May 9, 2025 🔮 Nightly AMEX:SPY / SP:SPX Scenarios for May 9, 2025 🔮
🌍 Market-Moving News 🌍
🚢 Maersk Adjusts Outlook Amid U.S.-China Trade Tensions
Global shipping giant Maersk reported better-than-expected Q1 profits but lowered its forecast for global container volume growth, citing uncertainties from the ongoing U.S.-China trade war. CEO Vincent Clerc highlighted that while U.S.-China shipping volumes have declined, the rest of the world remains stable.
🇺🇸 Fed Officials to Speak Post-Meeting
Following the Federal Reserve's decision to maintain interest rates, eight Fed officials are scheduled to make public appearances today. Investors will be keenly observing their remarks for insights into future monetary policy directions.
📈 Markets React to Trade Developments
U.S. markets closed higher yesterday, with the Dow gaining 250 points, as investors responded to President Trump's encouragement to 'buy stocks now' amidst ongoing trade negotiations.
🛠️ U.S.-U.K. Trade Deal Finalized
The U.S. and the U.K. have agreed on a trade deal involving reduced tariffs and adjustments to digital services taxes. This development is expected to influence sectors ranging from automotive to digital services.
📊 Key Data Releases 📊
📅 Friday, May 9:
3:00 PM ET: Consumer Credit (March)
⚠️ Disclaimer:
This information is for educational and informational purposes only and should not be construed as financial advice. Always consult a licensed financial advisor before making investment decisions.
📌 #trading #stockmarket #economy #news #trendtao #charting #technicalanalysis

JOHNSON AND JOHNSON: Re-accumulation is targeting $175.JNJ is neutral on its 1D technical outlook (RSI = 49.991, MACD = -1.040, ADX = 18.184) as it's only trading around its 1W MA50 but having made an impressive rebound 4 weeks ago inside the Demand Zone. This is the 4th time this Demand Zone provided a rally and the last one even crossed over the 3 year LH trendline that kept the stock on a downtrend since 2022. The breakout confirmed the emergence of a HH trendline which is taking the stock on a new multiyear bullish path. We expect at least one more high on the HH before the end of the year (TP = 175.00).
## If you like our free content follow our profile to get more daily ideas. ##
## Comments and likes are greatly appreciated. ##

AAPL – Long Trade Setup (Support-Based Reversal Opportunity)Apple (AAPL) is pulling back toward a key support zone between $197–$198, aligning with both previous structural support and potential demand zone behavior. This setup offers a favorable risk-to-reward profile for a swing long entry.
🔹 Entry Zone:
$197 – $198
🎯 Take Profit Targets:
🥇 $210 – $215
🥈 $225 – $233
🛑 Stop Loss:
Just below $190

HOOD daily chart: breakout or fakeout? Key zone approaching.Robinhood's stock has formed a falling wedge pattern on the daily chart, indicating a potential bullish reversal. The price has broken above the 0.618 Fibonacci level at $44.00, suggesting further upside potential. Next targets are $48.40, $52.79, $58.22, and $67.00. RSI and MACD indicators confirm bullish momentum.
Fundamental Factors:
Robinhood continues to show revenue and profit growth, supporting positive investor sentiment. The company is expanding its services and attracting new users, strengthening its market position.
Scenarios:
Main scenario: continued rise to $48.40, then to $52.79 and higher.
Alternative scenario: pullback to $39.71 with potential decline to $36.00.

Uptrend Stock / Swing and Run Trend / SE (NYSE)Uptrend Stock / Swing and Run Trend
SE (NYSE)
Fundamental
Sea Limited operates in three highly attractive business segments:
Sea Money – The company’s digital financial services arm offers consumer and SME lending, mobile wallets, and payment processing services.
Shopee – The largest e-commerce platform in Southeast Asia and Taiwan, with strong market presence and growth.
Garena – The company’s digital entertainment division, providing access to popular mobile and PC games. It also promotes eSports. Garena has developed its own successful game titles such as Free Fire, a globally popular battle royale game.
Sea Limited's key strength lies in its integrated platform that combines e-commerce, digital finance, and digital entertainment under one umbrella. This synergy allows the company to cross-leverage its customer base—for example, using Shopee users to promote Sea Money's financial services.
Technical
The price has been forming accumulation patterns at the bottom and gradually rallying upwards.
It’s showing a sideways-up structure, where the price bases sideways and then continues to rally upward in steps.
This setup allows for buy-the-dip opportunities using an indicator called Regression Trend to identify the trading channel.
For swing trading, one could buy on dips near the lower support band and sell at resistance on the upper band.
As shown in the chart (with circles marked), I’ve been buying on dips along the way.
In the most recent phase, you can consider buying around $139. If the price breaks out, the next support levels to watch would be around $143 and $147.
Target prices:
First target: $150
Next targets: $160 and $170
Stop Loss:
If the price drops below $120 and breaks the price structure, that would be the stop level.
As the quarterly earnings announcement approaches, the price is rallying in anticipation, and it's showing strong momentum within an uptrend—very positive sign.

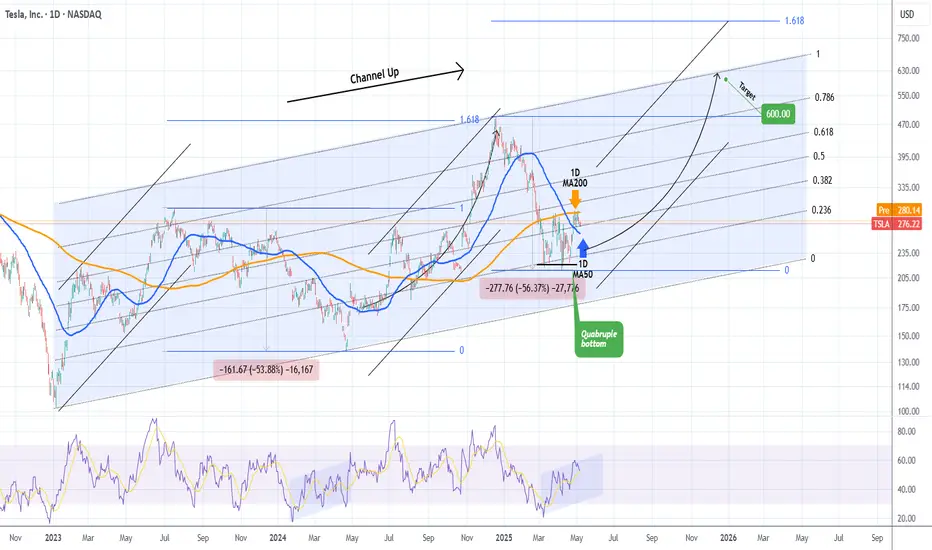
TESLA Is a $600 price tag a pipe dream?Tesla (TSLA) is seeing a steady recovery from the April 21 2025 Low, which has been a Quadruple Bottom, and has found itself consolidating the last 10 days within the 1D MA200 (orange trend-line) and the 1D MA50 (blue trend-line).
The 2.5 year pattern is a Channel Up and this Quadruple Bottom took place exactly on its 0.236 Fibonacci level, with a 1D RSI sequence that resembles the Bullish Divergence of its previous bottom on April 22 2024. The similarities don't stop there as the Bearish Legs that led to those bottoms have almost been identical (-53.88% and -56.37% respectively).
As a result we can technically assume that the current Bullish Leg that will be confirmed with a break above the 1D MA200, will be symmetrical to the previous one, which made a Higher High on the 1.618 Fibonacci extension from the bottom. That is now at $823 but falls outside of the 2.5-year Channel Up, so our long-term Target for the end of the year is $600, which is right at the top of the pattern.
-------------------------------------------------------------------------------
** Please LIKE 👍, FOLLOW ✅, SHARE 🙌 and COMMENT ✍ if you enjoy this idea! Also share your ideas and charts in the comments section below! This is best way to keep it relevant, support us, keep the content here free and allow the idea to reach as many people as possible. **
-------------------------------------------------------------------------------
💸💸💸💸💸💸
👇 👇 👇 👇 👇 👇
BTC – Liquidity Sweep, Fair Value Gap Reactions & Potential LongMarket context and structure
This BTCUSDT 1-hour chart from BYBIT illustrates a methodical transition from a phase of consolidation to bullish expansion, guided by smart money principles. Price initially consolidates beneath a well-defined resistance level, with an Imbalance Fair Value Gap (IFVG) forming inside the range. This IFVG signals an inefficient zone where institutional players may be positioned. The eventual breakout above this range indicates a structural shift and the beginning of a directional move, setting the stage for further bullish development.
Break of structure and liquidity sweep
Following the breakout, BTC sweeps the buy-side liquidity resting above a prior swing high. This liquidity grab is a common maneuver in smart money trading, designed to trigger stop orders and breakout entries to facilitate larger institutional fills. The aggressive price movement results in the creation of several Fair Value Gaps (FVGs), which are regions where price moved with such momentum that no overlap between candles occurred. These FVGs are crucial areas of interest where future re-entries or continuations might originate.
Fair value gaps and demand zones
The chart highlights multiple FVGs formed during the bullish impulse. The uppermost FVG, located just below the most recent liquidity sweep, acts as a shallow retracement zone and has already been partially mitigated. A mid-range FVG extends further down, providing a secondary support layer within the current price structure. The largest and deepest FVG lies closer to the breakout origin and represents a significant unfilled demand zone. These FVGs help to outline institutional footprints, revealing where unfulfilled orders may still reside and where price might return to rebalance.
Re-entry strategy and projection
An ideal re-entry area is labeled “Entry at IFVG,” situated near the recently swept liquidity. The projection suggests that price may retrace slightly into this IFVG, consolidate, and then continue its upward trajectory. This anticipated movement reflects a bullish continuation pattern rooted in the idea of reaccumulation, where price revisits areas of imbalance before pushing higher. The visual path drawn on the chart captures this idea, showing a measured retracement followed by a continuation of the trend.
Interpretation and tactical bias
The overall structure and price behavior support a smart money-based bullish outlook. The clean break of structure, the successful sweep of liquidity, and the presence of multiple fair value gaps provide a foundation for continued upside potential. Price respecting these imbalance zones on pullbacks reinforces demand and highlights ongoing institutional involvement. This setup encourages a patient, context-aware approach to trading, focusing on inefficiencies, order flow, and the narrative of price rather than arbitrary indicators.

btc . tue . recapApproaching the cmLow during 2/4pm (utc+2) on tuesday, brought the tiny SFP liquidity and and a NO LOOK BACK push upwards. The SHORT wasn't taken as the the bounce showed no weakness
The intraday LONG turned out to be a runner.
entry . 93454
tp1 . 94854 . +1.5%
- this seems a 'too early tp', correct but: thought as an intraday . securing the daily minimum: PROFIT TAKEN
tp2 . 100477 . +7.5%
tp3 . 103626 . +10.8%
The long entry is now at average 94863 . ish prv tp1
- I was waiting for lower, to add LONG position size
But upon not seeing follow through and strong bounces on lower TFs, I went with a 30% of original trade size addition during wednesday 8/10pm.
Now it's 10:30am, we've just pushed another 1h leg higher. I'll ride this to my next TPs, bigger reactions at this point I see only at higher prices.
This thing is BULLISH
(always hungry for good SHORT trades, but paytient for reactions)

Alphabet (GOOGL) Shares Drop Over 7% in a Single DayAlphabet (GOOGL) Shares Drop Over 7% in a Single Day
According to the Alphabet (GOOGL) stock chart, yesterday’s main trading session opened around $163.70 but then saw a sharp decline, hitting an intraday low of approximately $148 per share. By the close, bulls managed to recover only a small portion of the losses. As a result, Alphabet (GOOGL) shares fell by more than 7% during the session – marking the worst performance among the S&P 500 constituents (US SPX 500 mini on FXOpen).
Why Did GOOGL Shares Fall?
The drop followed remarks by Eddy Cue, Apple’s Senior Vice President of Internet Software and Services, who:
→ noted a decline in search traffic on Safari;
→ revealed plans to expand Safari’s search capabilities using artificial intelligence.
These developments heightened concerns over Google’s dominance in search and its advertising revenue. According to media reports, analysts are warning of rising competition from AI-powered search platforms such as OpenAI, Grok, and Perplexity.
Technical Analysis of Alphabet (GOOGL) Shares
In our 23 April analysis, we identified a descending price channel and emphasised the psychological significance of the $150 level, which had served as a key support in 2024.
Since then, bulls showed confidence by pushing the price above the red channel. In addition, the chart has begun to outline a potential ascending trend channel (marked in blue).
However, yesterday’s statement from competitors shifts the outlook. The current GOOGL stock price is positioned at the lower boundary of the blue channel – which could act as support, reinforced by the psychological $150 level.
On the other hand, a bearish breakout below this area may revive the downtrend that began in February, potentially paving the way for a test of this year’s lows.
This article represents the opinion of the Companies operating under the FXOpen brand only. It is not to be construed as an offer, solicitation, or recommendation with respect to products and services provided by the Companies operating under the FXOpen brand, nor is it to be considered financial advice.

Nifty preparing itself for Big Momentum Today 8may 2025 Nifty traded in just tiny range even on expiry Day. so, what will be next Move?
it is ready for bearish momentum ?
First reason: I have noticed multiple weakness through Wick which is representing by arow on chart.
Second reason: whenever market traded in narrow range (around 8-10 hourly candle) in past few days it gave breakdown represented drawing 4 yellow area see on chart.

What Does Lump Sum Investing Mean for Investors and Traders?What Does Lump Sum Investing Mean for Investors and Traders?
Lump sum investing is when an investor or trader commits a significant amount of capital to the market in one go rather than spreading it over time. This approach is believed to provide strong long-term returns but also comes with risks, particularly in volatile markets. This article explores how lump sum investing works, why investors and traders use it, potential risks, and strategies to manage exposure in different market conditions.
What Is Lump Sum Investing?
Lump sum investing is when an investor puts a significant amount of capital into the market at once, rather than spreading it over time. This approach is common when someone receives a windfall—such as an inheritance, bonus, or proceeds from closing an effective position—and decides to invest the full amount immediately.
Unlike dollar-cost averaging (DCA), which involves dividing an investment into smaller, regular parts, lump sum investing seeks to maximise market exposure from day one. The key argument of investors is that markets tend to rise over time. By investing upfront, capital has more time to grow, rather than sitting on the sidelines waiting to be deployed.
Lump sum investing isn’t limited to equities. It applies across asset classes, including forex, commodities, and fixed income. A trader taking a large position in a currency pair based on a strong technical setup is, in effect, making a lump sum investment—allocating its capital at once rather than scaling in gradually.
Institutional investors also use lump sum strategies, particularly when allocating large amounts into funds or rebalancing portfolios. However, while this method is believed to have strong long-term potential, it exposes investors and traders to market volatility, making risk management a key consideration.
Why Some Investors and Traders Use Lump Sum Investing
Lump sum investing is often used because it puts capital to work immediately, giving it more time to grow. Historical market data supports this approach—studies, including research from Vanguard, have claimed that potential returns are higher in lump sum vs dollar-cost averaging in most market conditions. This is because markets tend to rise over the long term, and waiting to invest can mean missing out on early gains.
Long-term investors typically deploy lump sums when they have high conviction in an asset or when a large amount of capital becomes available. For example, a fund manager rebalancing a portfolio or an individual investing an inheritance may decide to allocate the full amount upfront rather than spreading it out.
In Trading
Traders use lump sum investing differently. While some may use an approach similar to dollar-cost averaging and scale into a position, most traders will deploy capital when they see a high-probability setup. For instance, instead of spreading 1% risk across several trades, they will typically open a position with the entire 1% all at once.
Institutional investors also use lump sum strategies when making block trades or adjusting asset allocations. For example, a pension fund investing in equities after a market downturn may deploy capital in one move to take advantage of lower prices.
However, investing a lump sum of money isn’t just about maximising potential returns—it also involves risk, particularly in volatile markets. The next section explores the potential downsides of this approach.
Potential Risks of Lump Sum Investing
Lump sum investing comes with risks—particularly in volatile markets. The decision to invest everything at once means full exposure from day one, which can work against investors if the market moves against them after deployment. Some key risks to consider include:
Market Timing Risk
Investing a lump sum relies on deploying capital at a single point in time, making it sensitive to short-term market fluctuations. If an investor enters at a peak—such as before the 2008 financial crisis or the early 2022 market downturn—they could face an immediate drawdown. While long-term investors may recover, traders working on shorter timeframes have less room to absorb losses.
Volatility and Psychological Impact
Markets rarely move in a straight line. Lump sum investments can see rapid swings in value, which can be difficult for some investors to handle. Seeing a portfolio drop sharply after investing can lead to emotional decisions, such as panic selling or deviating from an original strategy. Traders face a similar issue when entering a full position—sudden volatility can trigger stop losses or force them to exit prematurely.
Liquidity Risk
For traders, placing a large order in a low-liquidity market can result in slippage, where the trade executes at a worse price than expected. This is especially relevant in forex, small-cap stocks, and commodities with lower trading volume.
How Lump Sum Investing Performs in Different Market Conditions
Market conditions play a major role in how lump sum investing performs. While historical data suggests it often outperforms spreading investments over time, short-term results can vary significantly depending on the broader trend.
Bull Markets
Lump sum investing tends to perform well in sustained uptrends. Since markets generally rise over time, deploying capital early allows one to take advantage of long-term growth. Research from Vanguard found that in about 68% of historical periods, lump sum investing outperformed dollar-cost averaging because assets had more time in the market. A strong bull market—like the one from 2009 to 2021—allowed lump sum investors to see considerable gains over time.
Bear Markets
Investing a lump sum just before a downturn exposes capital to immediate losses. For instance, an investor who entered the market in late 2007 would have faced steep drawdowns during the 2008 crash. Recovery took years, depending on the assets involved.
Although CFD traders can trade in rising and falling markets, the main challenge is to determine a trend reversal and avoid taking a full position just before it happens.
Sideways Markets
When prices move within a range without a clear trend, lump sum investing can be less effective. Investors may see stagnant returns if an asset moves sideways for extended periods, such as during the early 2000s. Traders in choppy markets often break positions into multiple entries to manage risk, rather than committing full capital at once.
Strategies to Potentially Reduce Risk with Lump Sum Investing
Lump sum investing involves full market exposure from the start, which means risk management plays a key role in avoiding unnecessary drawdowns. Understanding how to invest a lump sum of money wisely can help investors and traders potentially manage downside risks.
Assess Market Conditions
Deploying capital blindly can lead to poor outcomes. Investors often analyse valuations, interest rate trends, and macroeconomic factors before making large allocations. For traders, technical indicators such as support and resistance levels, moving averages, and momentum indicators help assess whether market conditions favour a full-position entry.
Diversification Across Assets and Sectors
One key concept in understanding how to invest a lump sum is diversification. Since allocating a lump sum to a single asset increases exposure to its price movements, some investors spread capital across multiple stocks, asset classes, or geographies to reduce concentration risk. A lump sum investment split between equities, bonds, and commodities can smooth out volatility, particularly in uncertain markets.
Hedging Strategies
Once they’ve decided what to do with a lump sum of money, some investors and traders hedge their positions. Opening opposite positions in correlated assets, trading stock pairs, or diversifying exposure across sectors in index trading can act as protection against downside moves, particularly in uncertain or high-volatility environments.
Position Sizing Adjustments
Traders concerned about volatility sometimes split a lump sum trade into staggered entries, adjusting size based on price action. This approach provides flexibility if market conditions shift unexpectedly.
The Bottom Line
Lump sum investing is a popular strategy among investors and traders, offering full market exposure from the start. While it has its advantages, managing risk is crucial, especially in volatile conditions.
FAQ
What Is Lump Sum Investment?
Lump sum investment is when an investor places a large amount of capital into an asset or market all at once instead of spreading purchases over time. This approach is common after receiving an inheritance, bonus, or proceeds from an asset sale. It provides immediate market exposure, which can be advantageous in rising markets but also increases the risk of short-term volatility.
What Is a Lump Sum Trading Strategy?
A lump sum trading strategy entails entering a trade with the entire position size in a single transaction, rather than gradually scaling in. Traders often use this approach when they have strong convictions in a setup. While it maximises potential returns if the market moves favourably, it also increases exposure to short-term price swings.
Is It Better to Invest Lump Sum or DCA?
Lump sum investing has historically outperformed dollar-cost averaging (DCA) in most market conditions because capital is exposed to growth sooner. However, DCA helps manage timing risk by spreading capital over time, making it a common choice for investors concerned about short-term market fluctuations.
What Are the Disadvantages of Lump Sum Investing?
The main risk is market timing—investing at a peak can lead to immediate losses. Lump sum investors also face higher short-term volatility, which can be psychologically challenging. In low-liquidity markets, executing large trades at once may lead to slippage, affecting execution prices.
This article represents the opinion of the Companies operating under the FXOpen brand only. It is not to be construed as an offer, solicitation, or recommendation with respect to products and services provided by the Companies operating under the FXOpen brand, nor is it to be considered financial advice.

Nightly $SPY / $SPX Scenarios for May 8, 2025🔮 Nightly AMEX:SPY / SP:SPX Scenarios for May 8, 2025 🔮
🌍 Market-Moving News 🌍
🇺🇸 Fed Holds Rates Steady Amid Economic Uncertainty
The Federal Reserve maintained its benchmark interest rate at 4.25%-4.5%, citing concerns over rising inflation and economic risks. Fed Chair Jerome Powell emphasized a cautious approach, indicating no immediate plans for policy changes.
🤝 U.S.-China Trade Talks Scheduled
Treasury Secretary Scott Bessent and chief negotiator Jamieson Greer are set to meet China's economic head He Lifeng in Switzerland, marking a potential step toward resolving trade tensions. The announcement has positively influenced global markets.
📈 Record $500 Billion Share Buyback Plans
U.S. companies have announced a record-breaking $500 billion in share buybacks, reflecting growing hesitation to make capital investments amid economic uncertainty driven by President Trump's trade policies. Major contributors include Apple ( NASDAQ:AAPL ), Alphabet ( NASDAQ:GOOGL ), and Visa ( NYSE:V ).
⚠️ Recession Warnings from Economists
Former IMF chief economist Ken Rogoff warns that a U.S. recession is likely this summer, primarily driven by President Donald Trump's aggressive tariff policies. He suggests that markets are overly optimistic and not adequately accounting for the risks.
📊 Key Data Releases 📊
📅 Thursday, May 8:
8:30 AM ET: Initial Jobless Claims
8:30 AM ET: Continuing Jobless Claims
8:30 AM ET: Nonfarm Productivity (Q1 Preliminary)
8:30 AM ET: Unit Labor Costs (Q1 Preliminary)
10:00 AM ET: Wholesale Inventories (March Final)
10:30 AM ET: Natural Gas Storage
⚠️ Disclaimer:
This information is for educational and informational purposes only and should not be construed as financial advice. Always consult a licensed financial advisor before making investment decisions.
📌 #trading #stockmarket #economy #news #trendtao #charting #technicalanalysis

CAE Breaking Out!CAE is Cracking out here from a three-year downtrend. Provided the market helps this stock by not collapsing any time soon, it can easily run to a new ATH.
This is a fairly simple setup with good risk-reward.

NVIDIA Corporation: Bullish ConsolidationThe NVDA stock is facing resistance at the 0.5 Fib. extension level. This resistance was met after a higher low and above 0.618 Fib. While this is a confirmed resistance zone, market conditions are bullish.
The RSI is now above 50. It is at its highest on a rise since late January earlier this year.
Local resistance on the RSI has been broken and this oscillator is trading straight up. This is a positive and strong signal. Here is the chart:
The yellow horizontal line is the local resistance which has been broken. On a drop, this same line would now work as support. A "magic" line I should say. :D
It is magical because it helps us predict the future with a high level of accuracy and certainty; so far so good.
These dynamics: The higher low, the small stop at resistance, the bullish RSI and overall bullish market conditions are all part of a bullish consolidation period.
Let me break it down for you; the market will continue to consolidate for a while, for as long as it needs, before moving higher to hit a new high. The conditions revealed by this chart setup is that the low that was hit 7-April remains the bottom. The market can shake, NVDA can go down, it can go up but this low will never be challenged, you can set your stop-loss below it. Any short-term movements against you is just noise. Wait patiently and eventually it will grow.
If you have any questions leave a comment it will be my pleasure to answer.
Thank you for reading again.
See you tomorrow, or the next day, or yesterday-more again.
Make sure to follow. My main focus is Cryptocurrency but I also do the SPX, NVDA and TSLA. (And sometimes Gold which is bearish now.)
Namaste.

COINBASE Can the 1D MA50 catapult it to $400?Coinbase (COIN) has been trading within a Fibonacci Channel Up ever since the Bull Cycle started on the January 06 2023 market bottom. The price made a Double Bottom on April 07 following the correction from its most recent High in early December.
That is a strong long-term market Support and a clear Demand Level as the stock's immediate rebound showed. The fact that it has currently flipped the 1D MA50 (blue trend-line) into a Support and is consolidating is a clear signal of a Re-accumulation Phase.
A break above its 1D MA200 (orange trend-line) will technically confirm the extension of the new Bullish Leg. The previous High was on the 0.786 Fibonacci Channel level and the one before that on the 1.0 Fib. If this declining rate continues, we should be expecting the next High to just hit the 0.618 Fib.
As a result, we have $400 as a medium-term Target, slightly above the stocks previous All Time High (ATH) at $370.
-------------------------------------------------------------------------------
** Please LIKE 👍, FOLLOW ✅, SHARE 🙌 and COMMENT ✍ if you enjoy this idea! Also share your ideas and charts in the comments section below! This is best way to keep it relevant, support us, keep the content here free and allow the idea to reach as many people as possible. **
-------------------------------------------------------------------------------
💸💸💸💸💸💸
👇 👇 👇 👇 👇 👇

STOCKS | MARKET WATCH | Why Long-Term Investing Still Wins🤯 The start of 2025 was a bit of a rollercoaster for stocks.
Global markets got seriously rattled in the first few months by some sudden jitters. When President Trump announced those aggressive tariffs, it caused significant concern among investors, sending stock markets tumbling and prompting a flight to safety. Like Reuters said, April was "epic" for crazy market swings – the VIX fear index shot up to levels we hadn't seen since 2020 and 2008, and then just as quickly dropped back down. Markets went wild.
But then, by late April, the panic kind of ... disappeared. Once President Trump paused the implementation of the most severe tariffs, stocks bounced back pretty sharply. The S&P 500 recovered most of what it lost. After that nasty drop, it ended April only about 5% lower than it started the year. The Nasdaq, with all its tech stocks, pretty much ended the month where it began. So, after all that drama, major US stock markets weren't far from their all-time highs, showing how fast that "fear" can vanish.
📊 How key indexes did
S&P 500 (USA): 📉 Dipped in early April but bounced back late. Ended April around -5% for the year, after almost hitting a bear market.
Nasdaq Composite (USA): 📉 Similar story. Tanked on the tariff scare, then rallied when things calmed down, ending April pretty much flat for the year.
MSCI World (Global developed markets): 🤷♂️ Had its ups and downs along with the US markets. By the end of April, it was pretty much flat for the year – no big moves for the overall world index.
MSCI Emerging Markets: 📉 Didn't do as well as developed markets. Asian stocks, especially, took a hit early April because of trade war worries, so this index lagged, even though it recovered a bit by the end of the month.
FTSE/JSE All-Share (South Africa): 🇿🇦 The odd one out! The JSE jumped about +5% in the first three months of 2025, mainly thanks to mining stocks. It even hit a record high in March. The April craziness shook it up too, but because it did so well earlier, it was still slightly up for the year by late April.
Takeaway? Global stocks were jumpy, but they mostly recovered. By late April, most major indexes were close to where they started the year. South Africa's market was the exception, having a good first quarter that helped it weather the April storm.
⏳ Staying invested beats trying to be a stock Wizard
All this back and forth can make investors nervous. You start thinking, "Should I just sell now before it drops even more?" But history usually says that's the wrong move. Just sticking with it usually works out better than trying to guess the market's next move. BlackRock's iShares recently pointed out that "waiting for the 'right time' to invest might mean missing out on the best days," while staying invested lets you benefit from that "compounding" thing and get through the short-term bumps. Simply put, if you sit on the sidelines during big swings, you often miss the big rebound days. One study even showed that if you missed just the five best market days over 20 years, you'd end up with way less money than someone who just stayed in the market.
The legendary investor Charlie Munger put it simply: "The first rule of compounding: never interrupt it unnecessarily." Trying to jump in and out of the market around all the volatility is super tough – the biggest up days often follow right after the biggest down days. On the other hand, patient investors who just ride out the noise tend to grab more of those long-term gains. After all, with compounding, those small gains build on each other over time.
💰 The awesome power of compounding over time
Compounding basically means the sooner you invest and the longer you stay invested, the more your returns build on each other like a snowball rolling downhill. For example, the total return JSE All-Share index was up almost 23% over the last year. That kind of gain shows how just staying invested during good times can really grow your wealth. If you'd panicked and pulled out, you would have missed most of that growth. Over longer periods, like 5 to 10 years, the JSE has almost always gone up. The big lesson is that it's about "time in the market," not trying to "time the market," that really makes your returns grow and smooths out those bumps along the way.
🌍 What's driving the markets and the economy
There were a few big things happening that explain why the markets moved the way they did.
🇺🇸 US GDP Slowdown: The US economy actually shrank a bit in the first quarter of 2025. A lot of people blamed this on a big surge in imports as businesses bought stuff ahead of those potential President Trump tariffs. Even though this news spooked the stock market briefly in late April, underlying consumer spending was still looking pretty decent.
📈 US Company Profits: On the bright side, US companies reported some pretty strong profits. Analysts were expecting good growth in earnings for the S&P 500 in the first quarter, even with the economic slowdown. And it turned out even better – a lot of companies beat expectations, and overall earnings were up quite a bit from last year. This helped keep stock prices from falling too much during the pullbacks.
🇪🇺 European Spending Boost: In Europe, governments are starting to spend more. Germany, for example, proposed a huge fund for infrastructure and energy. The EU is also loosening its spending rules and increasing defense budgets. Some experts think this could actually boost Europe's economic growth a bit each year, which would mean better profits for European companies. Some even think European companies might see faster profit growth than US companies in the next few years because of this spending.
🇨🇳 Asia and Trade Wars: Asia was the weak spot. China's economy showed some signs of trouble, with a survey suggesting its manufacturing activity might have shrunk in April after a couple of months of growth. This seemed to be a direct result of the US tariffs. Asian stock markets took a hit on the tariff news, which dragged down the overall emerging markets index. Basically, tariffs and trade tensions hurt growth in Asia and its markets, which then affected returns in emerging markets globally.
✅ The bottom line
Early 2025 reminded us that markets can freak out quickly – but they can often bounce back just as fast. The swings felt scary, but history tells us that just sticking with your investments usually pays off. Major stock markets are pretty much where they were a few months ago, while economies and company earnings are still moving forward. For long-term investors, that wild week in April just reinforced an old lesson: stay invested and let compounding do its thing. As some experts say, "get invested and stay invested" because the most volatile times often have the biggest market gains. By sticking to your plan, you avoid missing those big up days when the "fear" fades and markets recover.
_________________________
SP:SPX
Sources: Recent market reports and data including the April SATRIX 2025 market newsletter “Once Again, Volatility Blinked and Fear Lost., nasdaq.com, reuters.com, ishares.com, insight.factset.com, reuters.com, iol.co.za

From $1.37 to $8.48 in 5 hours +518% Massive start of the week with 2 Buy Alerts sent out right before vertical move!
$4.00 confirmed as important line in premarket trading already, then quickly set a strong support above it as soon as market opened and when it came down to re-test it again after initial pop it was showing strong hidden buying in that area which was confirming everything else we were looking and aiming for - power vertical squeeze to new highs.
Biggest stock gainer of the entire stock market today AMEX:GPUS
Get ready for next ones!

Eli Lilly (LLY) Shares Fall Over 15% in MayEli Lilly (LLY) Shares Fall Over 15% in May
The share price of Eli Lilly and Company (LLY), the world’s largest pharmaceutical company, has seen a sharp shift in market sentiment:
→ From its April low to high, LLY shares rose by over 30%;
→ However, since the start of May, the LLY stock price has dropped more than
15% — the closing price on the last trading day of April was around $895, while today the share is trading near $775.
Why Are Eli Lilly (LLY) Shares Falling?
The decline can be attributed to three key factors:
1→ Q1 Earnings Report: Although the company reported earnings per share above expectations ($3.34 vs $3.25), investors may have been concerned by significantly higher spending on research and development.
2→ Competitor Partnership: CVS Health’s announcement that it will offer Novo Nordisk’s Wegovy instead of Lilly’s Zepbound added further pressure to LLY shares.
3→ Sector Sentiment: Broader biotech sentiment turned negative following reports that the Trump administration is considering a pricing model that would cap drug prices based on lower rates in other countries.
The media is also discussing upcoming decisions from Vinay Prasad, the new head of the FDA division overseeing vaccines and gene therapy.
Technical Analysis: Eli Lilly (LLY) Share Chart
Key price movements (marked on the chart) justify the formation of a downward channel.
On the one hand, bearish sentiment may intensify in light of recent developments. The median line of the channel could act as resistance to any upward movement.
On the other hand, bulls may find support around the $765 level — a former resistance point and the boundary between two price gaps.
This article represents the opinion of the Companies operating under the FXOpen brand only. It is not to be construed as an offer, solicitation, or recommendation with respect to products and services provided by the Companies operating under the FXOpen brand, nor is it to be considered financial advice.

GOLD - Bullish Structure with Potential Continuation PlayThe current 1-hour chart of Gold (XAU/USD) demonstrates a clean bullish structure supported by an ascending channel and multiple unmitigated Fair Value Gaps (FVGs) acting as potential demand zones. This setup highlights the strength of the ongoing uptrend and offers insights into a high-probability continuation entry should price retrace.
Market Context and Trend Structure:
Following a prolonged downtrend visible in the earlier part of the chart, Gold reversed decisively with a bullish break of structure. Since then, price has been consistently printing higher highs and higher lows while respecting an ascending parallel channel. This channel, marked by two trendlines, encapsulates the short-term bullish momentum.
The current move is strong and impulsive, suggesting that institutional order flow is behind this leg. Candles are elongated with minimal wicks on the upside, reinforcing the idea of aggressive buying pressure.
Key Demand Zones and FVG Analysis:
Three major Fair Value Gaps (FVGs) have formed along the recent bullish leg, each potentially acting as a zone of reaccumulation. These FVGs are marked in green and correspond to areas where price left inefficiency after strong upward moves without immediate retracements.
* The most recent FVG, located just beneath current price, aligns with a minor structure support zone and overlaps partially with the lower boundary of the ascending channel. This area stands out as a prime candidate for a bullish continuation entry, particularly if price retraces and shows signs of holding.
* The middle FVG, slightly lower in the structure, represents a deeper mitigation level and could serve as a secondary entry in case the initial zone fails to hold.
* The lowest FVG is a broader inefficiency zone that formed near the base of the bullish reversal. If price returns this far, it would likely signify a temporary shift in momentum or deeper liquidity hunt before another leg upward.
Channel Structure and Momentum:
The ascending channel has been respected throughout the rally, offering visual confirmation of trend strength and the rhythm of pullbacks. The current price is near the upper boundary of the channel, and a short-term retracement is a logical expectation before continuation.
A pullback into the FVG + lower channel region would represent a convergence of structure, imbalance, and trendline support. These overlapping technical elements enhance the probability of a bounce from this zone.
Projected Path:
The chart also suggests a conservative bullish continuation projection, aiming toward the zone marked around 3449.12. This level appears to be a measured move extension and a safer target in relation to the overall structure. However, the note on the chart implies that the all-time high (ATH) could also be in play if momentum continues and market conditions remain supportive.
The key here is the behavior around the nearest FVG. If price retraces and holds this area—potentially forming a bullish engulfing or confirmation on lower timeframes—it may offer an ideal continuation entry with minimal drawdown.
Conclusion:
This Gold 1-hour chart reflects a strong bullish structure with clear institutional footprints left in the form of unmitigated FVGs. The alignment of ascending channel support and bullish imbalances creates a favorable setup for continuation traders. Watching the immediate FVG zone will be critical, as it may define the next impulsive leg toward higher targets. If that zone fails, deeper FVGs below offer secondary opportunities while maintaining the bullish bias as long as structural higher lows remain intact.

Nightly $SPY / $SPX Scenarios for May 7, 2025🔮 Nightly AMEX:SPY / SP:SPX Scenarios for May 7, 2025 🔮
🌍 Market-Moving News 🌍
🏛️ Fed Decision Day Amid Tariff Pressures
The Federal Reserve concludes its two-day meeting today, with expectations to maintain the benchmark interest rate at 4.25%-4.5%. Despite President Trump's calls for rate cuts, the Fed remains cautious due to inflationary risks from new tariffs and migration policies.
📈 U.S.-China Trade Talks Resume
U.S. stock futures rose overnight on news of upcoming high-level trade talks between the U.S. and China, marking the first discussions since the imposition of 145% tariffs on Chinese goods. Treasury Secretary Scott Bessent and U.S. Trade Representative Jamieson Greer are set to meet with senior Chinese officials later this week.
🛢️ Oil Prices Rebound on Demand Hopes
Oil prices climbed as U.S. production declined and demand in Europe and China showed signs of recovery. Brent crude rose 0.6% to $62.52 per barrel, while U.S. West Texas Intermediate increased 0.74% to $59.53 per barrel.
💼 Key Earnings Reports Ahead
Several major companies, including Uber ( NYSE:UBER ), Disney ( NYSE:DIS ), and Novo Nordisk ( NYSE:NVO ), are scheduled to report earnings today. Investors will be watching these reports for insights into corporate performance amid ongoing economic uncertainties.
📊 Key Data Releases 📊
📅 Wednesday, May 7:
2:00 PM ET: Federal Open Market Committee (FOMC) Meeting Announcement
2:30 PM ET: Fed Chair Jerome Powell Press Conference
3:00 PM ET: Consumer Credit Report (March)
⚠️ Disclaimer:
This information is for educational and informational purposes only and should not be construed as financial advice. Always consult a licensed financial advisor before making investment decisions.
📌 #trading #stockmarket #economy #news #trendtao #charting #technicalanalysis

$DJI & $NDX at MAJOR RESISTANCEDaily
The TVC:DJI has done well since April & we noticed a sentiment change. This is why we turned bullish. Only problem? Lack of volume. We can see that volume stayed under the pink dots. This is an average of 90 days.
We can also see this by the Money Flow. As of now the lowest peak since mid March on this indicator.
---
Weekly
The TVC:DJI RSI hasn't broken the halfway point. This is needed for more bullish momentum.
Money flow is slanting lower. The interesting tid bit is that volume for the week is not bad at all. But compare this to Jan 2024 and 4th quarter of the same year... LOWER.
Posted this yesterday, see profile for more info.
