SPY Short From Resistance! Sell!
Hello,Traders!
SPY went up again
To retest a wide horizontal
Resistance level of 551.00$
And as the political situation
Remains unstable we are
Bearish biased and we will
Be expecting a local move down
Sell!
Comment and subscribe to help us grow!
Check out other forecasts below too!
Disclosure: I am part of Trade Nation's Influencer program and receive a monthly fee for using their TradingView charts in my analysis.
Stocks

“Markets are strong” – Are they really?President Trump recently stated that "markets became very strong once they got used to tariffs."
But let’s look at the facts:
📊 AMEX:SPY is down -9% YTD, and major names like:
MSFT: -7.55%
AAPL: -18.66%
NVDA: -12.94%
Tech is bleeding, and the broader S&P 500 is clearly reflecting the pressure of trade policy uncertainty.
🟥 Tariffs = market stress
🟩 Market resilience = not the same as strength
What we’re seeing is not a “strong market” — it’s a market under pressure trying to survive political noise. The weekly chart shows a clear drop after the peak, followed by uncertainty, not conviction.
💭 Is this truly the “strength” investors want to see?

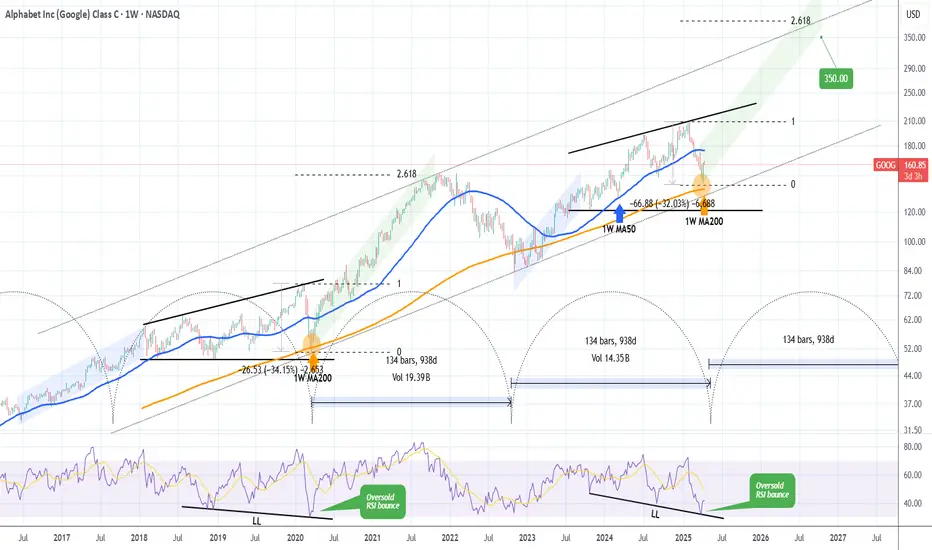
GOOGLE's generational bottom made. This is how it reaches $350.Alphabet Inc. (GOOG) almost tested last week its 1W MA200 (orange trend-line). That level has been holding for more than 2 years (since March 13 2023) and it's been the main Support of the Bull Cycle that followed the November 2022 Inflation Crisis bottom.
The pattern is almost like the Ascending Triangle that led to the March 2020 COVID crash, which was the most recent time before the late 2022 bottom that the stock made contact with the 1W MA200. As you realize, all those times have been what we call 'generational bottoms', thus extremely good long-term buy opportunities. And as you see they've been on extremely tight time symmetry, all took place roughly every 2.5 years.
If the pattern continues to repeat itself, then we may witness a rally (green Channel Up) similar to the one that peaked on November 2021 and reached the 2.618 Fibonacci extension. As a result, setting a $350 Target would be more than realistic based on this pattern.
-------------------------------------------------------------------------------
** Please LIKE 👍, FOLLOW ✅, SHARE 🙌 and COMMENT ✍ if you enjoy this idea! Also share your ideas and charts in the comments section below! This is best way to keep it relevant, support us, keep the content here free and allow the idea to reach as many people as possible. **
-------------------------------------------------------------------------------
💸💸💸💸💸💸
👇 👇 👇 👇 👇 👇
Price Action: Nasdaq NDX Monday 4/14/2025In this video, we will be looking at the Nasdaq (NDX) on the daily chart and its potential Movement throughout Monday 4/14/2025.

Quantum's PLTR Trading GuideSentiment: Bullish. AI and government contract hype drives enthusiasm, though valuation risks noted. Chatter lean bullish, citing growth momentum.
Outlook: Neutral, slightly bearish. Options pin $88, with $85 puts active. ICT/SMT eyes $86-$88 buys to $92 if $86 holds. Bearish below $86 risks $80.
Influential News:
Federal Reserve: Two 2025 cuts aid growth stocks, positive for $PLTR.
Earnings: Q1 due early May; no update today.
Chatter: Bullish on AI/contracts, some warn of pullback.
Mergers and Acquisitions (M&A): No confirmed NASDAQ:PLTR M&A; partnership expansions rumored.
Other: Tariff volatility hit tech; NASDAQ:PLTR resilient.
Indicators:
Weekly:
RSI: ~75 (overbought).
Stochastic: ~85 (overbought).
MFI: ~80 (overbought).
SMAs: 10-day ~$86 (above, bullish), 20-day ~$85 (above, bullish).
Interpretation: Overbought, bullish SMAs suggest pullback risk.
Daily:
RSI: ~72 (overbought).
Stochastic: ~80 (overbought).
MFI: ~75 (overbought).
SMAs: 10-day ~$86 (above, bullish), 20-day ~$85 (above, bullish).
Interpretation: Overbought, bullish SMAs but caution warranted.
Hourly:
RSI: ~70 (neutral).
Stochastic: ~75 (overbought).
MFI: ~70 (neutral).
SMAs: 10-day ~$86 (above, bullish), 20-day ~$85 (above, bullish).
Interpretation: Overbought, bullish momentum fading.
Price Context: $88.55, 1M: +2%, 1Y: +303%. Range $80-$92, testing $88 resistance.
Options Positioning (May 2025):
Volume:
Calls: $90 (10,000, 60% ask), $95 (8,000, 55% ask). Bullish bets on $90+.
Puts: $85 (7,000, 70% bid), $80 (5,000, 65% bid). Put buying grows.
Open Interest:
Calls: $90 (30,000, +5,000), $95 (20,000, +4,000). Bullish positions.
Puts: $85 (18,000, +3,000), $80 (15,000, +2,000). Hedging. Put-call ~0.7.
IV Skew:
Calls: $90 (45%), $95 (47%, up 3%). $95 IV rise shows upside bets.
Puts: $85 (40%, up 2%), $80 (38%). Rising $85 IV signals downside fear.
Probability: 60% $80-$92, 20% <$80.
Karsan’s Interpretation:
Vanna: Positive (~200k shares/1% IV). IV drop could pressure $88.
Charm: Positive (~100k shares/day). Pins $88.
GEX: +80,000. Caps upside.
DEX: +4M shares, bullish.
Karsan view: High GEX limits $92+; pullback to $85 likely.
ICT/SMT Analysis:
Weekly: Bearish at $88 OB, targets $85. Bullish > $92.
Daily: Bearish at $88 FVG, targets $85. Bullish > $90.
1-Hour: Bearish < $88, $85 target. MSS at $90.
10-Minute: OTE ($87-$88.50, $87.75) for sells, NY AM.
Trade Idea:
Bullish: 45%. ICT/SMT buys $86-$88 to $92. Options favor $90 calls. AI hype supports.
Neutral: 30%. $80-$92 range, balanced options.
Bearish: 25%. Below $85 likely with overbought signals. $85 put volume rises.

MARA Holdings, Inc.: Your Altcoin ChoiceThis is obviously not an Altcoin but it was requested in the Altcoin Choice session that we did recently, so here is the analysis.
MARA Holdings, Inc. (MARA) . It looks good.
A long-term higher low has been established. MARA produced a low first in October 2023. This was followed by a series of swings and waves. Reaching the later part of 2024, the action turned full bearish and now in April 2025 MARA Holdings seems to be ready to go bullish again. And here the stock printed a higher low.
A long-term higher low will lead to a long-term higher high. The last peak happened in February 2024 at 34.09. The next higher high at 42.86 is an easy one and should happen in 2025. It can definitely go higher but I am no stocks expert so can't dig any deeper for you.
In support of these signals, I looked for the RSI and found a small bullish divergence. It is only a month old but it is still a bullish divergence and it is valid. The reading on the RSI is also good and supports a new wave of growth. It seems Crypto and the stock market are now one.
Trading volume is standard and average and does not support our bullish bias, but it doesn't negate either. Average volume with no change on the upside or downside supports a neutral market. A market on autopilot. If there was a bearish move this bearish move is not strong as it is not supported by volume. So the early reversal signals can be good as there is nothing to hold the bearish wave. Things can change, but we are not talking about that, we are looking at the chart and what it currently says.
The chart is saying that MARA can start to grow in the coming weeks and days. If this growth develops, it can last months and end up in a new high, a higher high based on the long-term.
Thank you for reading and for your continued support.
Namaste.

This Aussie Tech Gem Is Screaming BUY – If This Zone Holds!SDR (SiteMinder) is showing massive potential both technically and fundamentally:
- Trading 75.4% below fair value
- Forecasted to grow 65.36% YoY
- Earnings up 28.2% p.a. over the last 5 years
- Analysts expect 91%+ upside
On the chart, we’re sitting right on a high-probability monthly FVG + OB zone. If respected, we could see a strong rally back toward the $6.90–$7.78 buyside liquidity levels and beyond.
Key Levels to Watch:
📍 FVG support: ~$3.50
📈 Targets: $6.90 – $7.78
🧠 Confirmation needed via strong candle closes
🔥 Could be a high-reward play — but as always, DYOR!

Weekly $SPY / $SPX Scenarios for April 14–17, 2025🔮 🔮
🌍 Market-Moving News 🌍:
🏦 Major Financial Earnings Reports: This week, investors will focus on earnings from prominent financial institutions, including Goldman Sachs, Bank of America, and Citigroup. These reports will provide insights into the financial sector's health amid recent market volatility.
📺 Tech and Healthcare Earnings: Key tech and healthcare companies such as Netflix, TSMC, and UnitedHealth Group are also scheduled to release earnings. Analysts will scrutinize these reports for indications of sector performance and future outlooks.
🏠 Housing Market Indicators: The release of housing starts data and a homebuilder confidence survey will shed light on the housing sector's response to recent economic conditions and tariff implementations.
🇪🇺 European Central Bank Meeting (April 17): The ECB is expected to address recent tariff developments and may announce interest rate decisions in response to economic pressures.
📊 Key Data Releases 📊
📅 Monday, April 14:
🗣️ Philadelphia Fed President Patrick Harker Speaks (6:00 PM ET): Insights into regional economic conditions and monetary policy perspectives may be provided.
🗣️ Atlanta Fed President Raphael Bostic Speaks (7:40 PM ET): Remarks may offer perspectives on economic developments and policy considerations.
📅 Tuesday, April 15:
📈 Import Price Index (8:30 AM ET):
Forecast: +0.1%
Previous: +0.4%
Measures the change in the price of imported goods, indicating inflationary pressures.
🏭 Empire State Manufacturing Survey (8:30 AM ET):
Forecast: -10.0
Previous: -20.0
Assesses manufacturing activity in New York State, providing early insights into industrial performance.
📅 Wednesday, April 16:
🛍️ Retail Sales (8:30 AM ET):
Forecast: +1.2%
Previous: +0.2%
Indicates consumer spending trends, a primary driver of economic growth.
🏭 Industrial Production (9:15 AM ET):
Forecast: -0.2%
Previous: +0.7%
Measures the output of factories, mines, and utilities, reflecting industrial sector health.
🏠 Homebuilder Confidence Index (10:00 AM ET):
Forecast: 38
Previous: 39
Gauges builder sentiment in the housing market, indicating construction activity trends.
📅 Thursday, April 17:
📈 Initial Jobless Claims (8:30 AM ET):
Forecast: 223,000
Previous: --
Reports the number of individuals filing for unemployment benefits for the first time, reflecting labor market conditions.
🏠 Housing Starts (8:30 AM ET):
Forecast: 1.41 million
Previous: 1.5 million
Tracks the number of new residential construction projects begun, indicating housing market strength.
🏭 Philadelphia Fed Manufacturing Survey (8:30 AM ET):
Forecast: 3.7
Previous: 12.5
Measures manufacturing activity in the Philadelphia region, providing insights into sector health.
🏦 European Central Bank Interest Rate Decision: The ECB will announce its interest rate decision, with markets anticipating a potential cut in response to tariff impacts.
⚠️ Disclaimer: This information is for educational and informational purposes only and should not be construed as financial advice. Always consult a licensed financial advisor before making investment decisions.
📌 #trading #stockmarket #economy #news #trendtao #charting #technicalanalysi

Quantum's NVDA Trading Guide 4/13/25Sentiment: Neutral. AI chip dominance drives optimism, but tariff risks and valuation concerns temper enthusiasm. Chatter posts split—bulls see growth, bears eye correction.
Outlook: Neutral, slightly bearish. Options pin $110, with $105 puts active. ICT/SMT eyes $108-$110 buys to $115 if $108 holds. Bearish below $108 risks $105.
Influential News:
Federal Reserve: Two 2025 cuts support growth stocks, positive for $NVDA.
Earnings: Q1 due May; no update today.
Chatter: Debates AI growth vs. tariff/supply chain risks.
Mergers and Acquisitions (M&A): No confirmed NASDAQ:NVDA M&A; AI chip partnerships rumored.
Other: Tariff volatility hit NASDAQ:NVDA ; stock swung (April 3-9).
Indicators:
Weekly:
RSI: ~50 (neutral).
Stochastic: ~45 (neutral).
MFI: ~40 (neutral).
SMAs: 10-day ~$112 (below, bearish), 20-day ~$115 (below, bearish).
Interpretation: Neutral, bearish SMAs signal weakness.
Daily:
RSI: ~48 (neutral).
Stochastic: ~50 (neutral).
MFI: ~45 (neutral).
SMAs: 10-day ~$112 (below, bearish), 20-day ~$115 (below, bearish).
Interpretation: Neutral, bearish SMAs suggest pullback.
Hourly:
RSI: ~45 (neutral).
Stochastic: ~55 (neutral).
MFI: ~50 (neutral).
SMAs: 10-day ~$112 (below, bearish), 20-day ~$115 (below, bearish).
Interpretation: Neutral, stabilizing.
Price Context: $110.93 (April 11), 1M: -9%, 1Y: +28%. Range $105-$120, testing $110 support.
Options Positioning (May 2025):
Volume:
Calls: $115 (12,000, 60% ask), $120 (10,000, 55% ask). Mild bullish bets.
Puts: $105 (8,000, 70% bid), $108 (6,000, 65% bid). Put selling supports $108.
Open Interest:
Calls: $115 (35,000, +6,000), $120 (25,000, +5,000). Bullish interest.
Puts: $105 (20,000, flat), $108 (22,000, +3,000). Hedging. Put-call ~1.0.
IV Skew:
Calls: $115 (40%), $120 (42%, up 3%). $120 IV rise shows upside hope.
Puts: $105 (35%, down 2%), $108 (36%). Falling $105 IV supports floor.
Probability: 60% $105-$120, 20% <$105.
Karsan’s Interpretation:
Vanna: Neutral (~300k shares/1% IV). IV drop could pressure $110.
Charm: Neutral (~150k shares/day). Pins $110.
GEX: +60,000. Stabilizes range.
DEX: +8M shares, neutral.
Karsan view: GEX holds $105-$120; tariff news key.
ICT/SMT Analysis:
Weekly: Neutral, $105 support, $120 resistance. No $NVDA/ NASDAQ:AMD divergence.
Daily: Bullish at $110 FVG, targets $115. Bearish < $108.
1-Hour: Bullish >$110, $115 target. MSS at $108.
10-Minute: OTE ($109-$111, $110) for buys, NY AM.
Trade Idea:
Bullish: 50%. ICT/SMT buys $108-$110 to $115. Options show $115 calls. Fed cuts aid.
Neutral: 35%. RSI (~50), SMAs (bearish), $105-$120 range.
Bearish: 15%. Below $105 possible with tariffs. $105 put volume grows

Quantum's TSLA Trading Guide 4/13/25Sentiment: Neutral. EV and AI optimism persists, but tariff risks and high valuation concern traders. Chatter split—bulls eye robotaxi, bears see pullback.
Outlook: Neutral, slightly bearish. Options pin $250, with $240 puts active. ICT/SMT eyes $245-$250 buys to $260 if $245 holds. Bearish below $245 risks $240.
Influential News:
Federal Reserve: Two 2025 cuts support growth stocks, positive for $TSLA.
Earnings: Q1 due late April; no update today.
Chatter: Debates tariff impact vs. AI/EV growth.
Mergers and Acquisitions: None; focus on internal projects.
Other: Tariff volatility hit NASDAQ:TSLA ; stock swung (April 3-9).
Indicators:
Weekly:
RSI: ~50 (neutral).
Stochastic: ~45 (neutral).
MFI: ~40 (neutral).
SMAs: 10-day ~$255 (below, bearish), 20-day ~$260 (below, bearish).
Interpretation: Neutral, bearish SMAs signal weakness.
Daily:
RSI: ~48 (neutral).
Stochastic: ~50 (neutral).
MFI: ~45 (neutral).
SMAs: 10-day ~$255 (below, bearish), 20-day ~$260 (below, bearish).
Interpretation: Neutral, bearish SMAs suggest pullback.
Hourly:
RSI: ~45 (neutral).
Stochastic: ~55 (neutral).
MFI: ~50 (neutral).
SMAs: 10-day ~$255 (below, bearish), 20-day ~$260 (below, bearish).
Interpretation: Neutral, stabilizing.
Price Context: $252.31, 1M: +1%, 1Y: +38%. Range $240-$270, testing $250 support.
Options Positioning (May 2025):
Volume:
Calls: $260 (15,000, 60% ask), $270 (12,000, 55% ask). Mild bullish bets.
Puts: $240 (10,000, 70% bid), $245 (8,000, 65% bid). Put selling supports $245.
Open Interest:
Calls: $260 (40,000, +7,000), $270 (30,000, +5,000). Bullish interest.
Puts: $240 (25,000, flat), $245 (28,000, +4,000). Hedging. Put-call ~1.0.
IV Skew:
Calls: $260 (40%), $270 (42%, up 3%). $270 IV rise shows upside hope.
Puts: $240 (35%, down 2%), $245 (36%). Falling $240 IV supports floor.
Probability: 60% $240-$270, 20% <$240.
Karsan’s Interpretation:
Vanna: Neutral (~300k shares/1% IV). IV drop could pressure $250.
Charm: Neutral (~150k shares/day). Pins $250.
GEX: +50,000. Stabilizes range.
DEX: +7M shares, neutral.
Karsan view: GEX holds $240-$270; tariff news key.
ICT/SMT Analysis:
Weekly: Neutral, $240 support, $270 resistance. No $TSLA/ NYSE:NIO divergence.
Daily: Bullish at $250 FVG, targets $260. Bearish < $245.
1-Hour: Bullish >$250, $260 target. MSS at $245.
10-Minute: OTE ($249-$251, $250) for buys, NY AM.
Trade Idea:
Bullish: 50%. ICT/SMT buys $245-$250 to $260. Options show $260 calls. Fed cuts aid.
Neutral: 35%. RSI (~50), SMAs (bearish), $240-$270 range.
Bearish: 15%. Below $240 possible with tariffs. $240 put volume grows.

Quantum's T (AT&T) Trading Guide 4/13/25Sentiment: Neutral. Dividend yield (4-5%) and debt reduction ($123B) attract income seekers, but telecom competition and tariff fears limit enthusiasm. X posts praise stability, though growth concerns persist.
Outlook: Neutral, slightly bullish. Options pin $27, with call buying eyeing $28. ICT/SMT supports $26-$26.50 buys to $27.50-$28 if support holds. Bearish risk below $25 low unless earnings falter.
Influential News:
--Federal Reserve: Rates unchanged, two 2025 cuts expected, easing debt costs. Liquidity boost mildly positive.
--Earnings: Q1 due April 23 (EPS $1.97-$2.07 vs. $2.13). Fiber (28.9M locations) and cash flow (>$16B) could lift if beat.
--Chatter: X mixed—stability vs. tariff risks. Analyst focus on earnings revisions.
--Mergers and Acquisitions (M&A): Talks to acquire Lumen’s fiber unit ($5.5B+), potentially boosting growth but risking debt concerns.
--Other: Tariffs caused volatility; RUS:T stable. Broadband expansion adds value.
Indicators:
--Weekly:
----RSI: ~45 (neutral).
----Stochastic: ~50 (neutral).
----MFI: ~40 (neutral).
----SMAs: 10-day ~$27.10 (below, bearish), 20-day ~$27.30 (below, bearish).
----Interpretation: Neutral, bearish SMA signals suggest consolidation.
--Daily:
----RSI: ~48 (neutral).
----Stochastic: ~55 (neutral).
----MFI: ~45 (neutral).
----SMAs: 10-day ~$27.10 (below, bearish), 20-day ~$27.30 (below, bearish).
----Interpretation: Neutral, bearish SMAs indicate pullback but recovery possible.
--Hourly:
----RSI: ~50 (neutral).
----Stochastic: ~60 (neutral).
----MFI: ~50 (neutral).
----SMAs: 10-day ~$27.10 (below, bearish), 20-day ~$27.30 (below, bearish).
----Interpretation: Neutral, mildly bullish momentum.
Price Context: $26.79 (April 11 close), 1M: -6%, 1Y: +59%. Range $25-$29, holding $26 support amid tariff concerns.
Options Positioning (May 2025):
-Volume:
----Calls: $27 (3,500, 60% ask = buying), $28 (2,500, 55% ask). Bullish bets on $27-$28.
---Puts: $25 (2,000, 70% bid = selling), $26 (1,500, 65% bid). $25 put selling supports $26 floor.
-Open Interest:
---Calls: $27 (10,000, +2,000 = buying), $28 (7,000, +1,500). Institutional bullishness.
---Puts: $25 (4,000, flat), $26 (6,000, +1,000). Hedging, not bearish. Put-call ~0.9.
-IV Skew:
---Calls: $27 (25%), $28 (27%, up 2%). $28 IV rise shows $28+ speculation.
---Puts: $25 (22%, down 1%), $26 (24%). Falling $25 IV reinforces $26 support.
-Probability: 60% $25-$28, 20% >$29.
Karsan’s Interpretation:
---Vanna: Neutral (~50k shares/1% IV). Stable IV limits flows; earnings IV spike could push
$27.50.
---Charm: Neutral (~20k shares/day). Pins $27.
---GEX: +20,000. Dealers sell $28, buy $26, holding range.
---DEX: +1M shares, neutral.
---Karsan view: GEX pins $26-$28; catalyst needed.
ICT/SMT Analysis:
--Weekly: Neutral, $25 support, $29 resistance. No $T/ NYSE:VZ divergence (~$43 NYSE:VZ ).
--Daily: Bullish at $26 FVG, targets $28. Bearish < $26.
--1-Hour: Bullish >$26.50, $27.50 target. MSS at $26.50.
--10-Minute: OTE ($26.69-$26.80, $26.73) for buys, NY AM (8:30-11:00 AM).
Trade Idea:
---Bullish: 60%. ICT/SMT buys $26-$26.50 to $27.50-$28 (OTE $26.73). Options favor $27-$28
calls. Earnings, M&A, Fed cuts support.
---Neutral: 30%. RSI (~45), SMAs (bearish), $25-$29 range, balanced options (put-call ~0.9).
---Bearish: 10%. Below $25 needs earnings miss. Low $25 put volume.

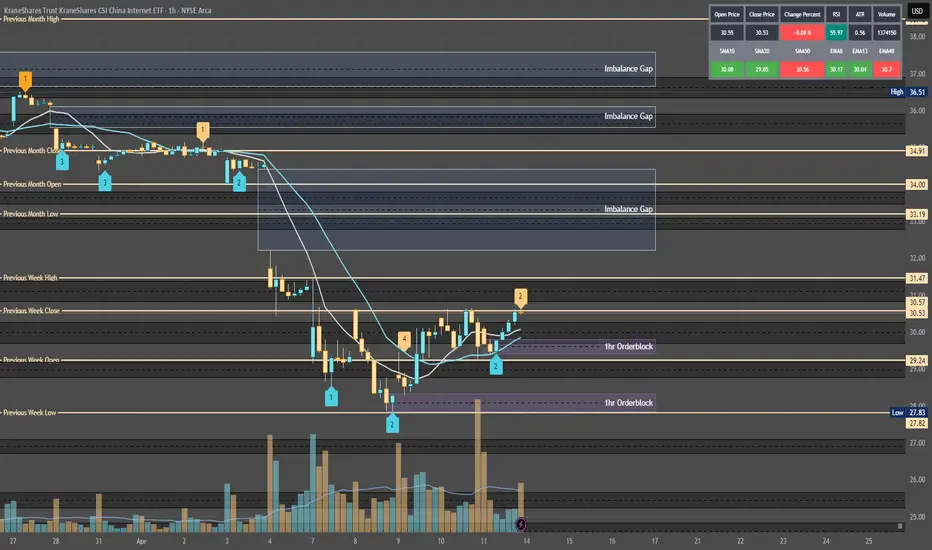
Quantum's KWEB Trading Guide 4/13/25Analysis:
Post-Close Options Activity (April 11):
Data: System reports 469.32K contracts traded on April 11, with puts at 10.99% (calls ~89%). High call volume at $31/$32 strikes suggests bullish bets.
Interpretation: Call-heavy flow indicates retail/institutional optimism, likely targeting a sweep above $31.35 (weekly high). Potential for a liquidity sweep trapping longs, aligning with ICT/SMT reversal.
RSI (14) Level and Trend:
Estimate: Daily RSI ~55 (neutral-bullish), based on April 11 close ($30.52, +2.97% from $29.62). Uptrend from April 8 low ($27.95) but below March 17 peak ($38.401) avoids overbought.
Interpretation: RSI supports bullish setups (above 50), with room for upside before resistance (~70). A sweep to $31.50 could push RSI higher, signaling OTE retracement.
Anonymized X Post Insights (April 11–13):
Summary: Posts highlight Chinese tech optimism (e.g., DeepSeek AI, consumer spending), tempered by tariff fears (Trump’s 125% threats). Some speculate on KWEB breaking $31, others note volatility risks.
Interpretation: Mixed sentiment leans bullish, with chatter about AI and stimulus driving buy-side interest. Tariff uncertainty suggests potential sell-side sweeps if news escalates.
Potential Reversals/Catalysts:
Liquidity Sweeps: Call-heavy options and X speculation point to a buy-side sweep above $31.35 (W-High), trapping retail longs before an OTE reversal to $30.00 (HVN).
Institutional Positioning: High call OI suggests dealers hedging bullish bets, but tariff risks could trigger smart money to fade retail.
Catalysts: Retail Sales (April 15) or tariff relief news could spike KWEB, while escalation could drive sell-side volatility.
Why: Sentiment aligns with ICT/SMT, where bullish retail chatter sets up sweeps, and smart money reverses at OTE. Neutral-bullish RSI and call volume support a setup.
Action: Log sentiment as neutral-bullish, expect sweep above $31 or drop to $29 on tariff news. Highlight for video: “KWEB’s call-heavy buzz could trap retail—watch for a smart money reversal.”
Tariff Impact
Assessment: Severe
Exposure:
KWEB’s holdings (e.g., PDD, JD.com, Tencent) rely on China’s internet economy, with significant supply chain and consumer exposure to U.S.-China trade. Tariffs (e.g., 125% proposed) raise costs for e-commerce and tech exports, hurting revenues.
Example: PDD (Temu) faces U.S. import duties, squeezing margins; JD.com’s logistics chain is tariff-sensitive.
Current Policy (April 13):
Context: Trump’s April 10 statement escalates tariffs to 125% on Chinese goods, with no relief confirmed by April 13. Web reports (Reuters, April 4) note market volatility from tariff fears, impacting KWEB’s April 8 low ($27.95).
Impact: Severe, as KWEB’s ETF structure amplifies holdings’ tariff pain (e.g., Alibaba, Tencent ADRs). Sentiment sours on escalation, driving sell-side sweeps.
Tariff Relief Potential:
Scenario: A 90-day pause or negotiation (rumored on X, inconclusive) could lift KWEB +3–5% ($31.50–$32.00), as seen in past relief rallies (e.g., February 2025, +1.6% on pause news).
Fundamentals: Relief boosts consumer spending on KWEB’s holdings, supporting bullish MSS. Without relief, bearish pressure persists.
AMT Tie-In: Tariff news creates imbalances (LVN breaks), with price seeking HVNs (e.g., $30.00) post-volatility.
Why: Severe tariff exposure makes KWEB sensitive to trade news, fueling sweeps (buy-side on relief, sell-side on escalation), per ICT/SMT.
Action: Rate tariff impact severe, monitor April 14 for negotiation updates. Video: “Tariffs could sink KWEB, but relief might spark a sweep to $32—stay sharp.”
News/Catalysts
Current (April 11, 2025)
Closing Price:
System Data: KWEB closed at $30.52 (currentPrice), +2.97% from prevDayClose ($29.62).
Verification: Matches April 11 high ($30.63), low ($29.41), open ($30.12).
Drivers:
Positive: Call-heavy options (89% calls) and AI buzz (DeepSeek, X posts) drove the rally. Web reports note Chinese tech resilience despite tariffs.
Negative: Tariff fears capped gains, with X posts citing Trump’s 125% threat as a drag.
Sector Trends: China ETFs rose (e.g., MCHI +2.1%, April 11), supporting KWEB’s move.
Why: Options flow and AI speculation fueled bullish momentum, but tariffs restrained breakout above $31.
Action: Highlight $30.52 close, +2.97%, driven by calls and AI. Video: “KWEB jumped 3% on AI hype, but tariffs loom large.”
Upcoming (Week of April 14–18)
Events:
April 15, Retail Sales (8:30 AM): Measures U.S. consumer spending, impacting KWEB’s e-commerce holdings (PDD, JD.com).
April 16–18, Tariff Talks: Potential U.S.-China negotiations, per X chatter (inconclusive).
Ongoing, China Stimulus: Rumored fiscal measures could lift Chinese tech, no date confirmed.
Predictions:
Bullish (+3%, ~$31.50): Strong Retail Sales (+0.5% MoM) or stimulus news boosts e-commerce, sweeping buy-side liquidity ($31.35).
Bearish (-3%, ~$29.50): Weak Retail Sales (-0.2% MoM) or tariff escalation triggers sell-side sweep ($29.41).
Neutral (±1%, $30.20–$30.80): Mixed data or no tariff news keeps KWEB near $30.00 (HVN).
Why: Catalysts drive displacement (sweeps to OHLC/LVNs), setting up OTE entries, per AMT/ICT.
Action: Set alerts for Retail Sales (April 15), monitor X for tariff updates. Video: “Retail Sales could push KWEB to $32 or drop it to $29—big week ahead.”
Technical Setup
Multi-Timeframe Analysis (Adjusted to April 11 Close, $30.52)
Weekly Chart
HVN (High Volume Node):
Level: $30.00 (POC, near W-Open $29.59, D-Close $30.52).
Role: Support, price consolidated March 24–April 11 ($29–$31).
Stance: Bullish (price above HVN, defending $30.00).
LVN (Low Volume Node):
Level: $31.50 (near W-High $31.35, April 4).
Role: Fast-move zone, price dropped post-$31.35 (April 4–8).
Stance: Neutral (price below LVN, potential sweep target).
EMA Trend:
Status: 8-week ($31.50) < 13-week ($32.00) < 48-week ($33.50), downtrend but flattening.
Stance: Neutral (price below EMAs, but $30.52 tests 8-week).
RSI (14):
Level: ~55 (neutral-bullish, up from 45 at $27.95, April 8).
Stance: Bullish (>50, room to 70).
MACD:
Status: Above signal, nearing zero (bullish crossover April 10).
Stance: Bullish (gaining momentum).
Bollinger Bands:
Status: Price at midline ($30.50), bands narrowing.
Stance: Neutral (breakout pending).
Donchian Channels:
Status: Above midline ($29.65, W-Low to W-High).
Stance: Bullish (breakout potential).
Williams %R:
Level: ~-40 (neutral, not overbought).
Stance: Bullish (>-50, rising).
ADR (Average Daily Range):
Status: Expanding (~3%, $0.90/day).
Stance: Bullish (volatility supports moves).
VWAP:
Status: Above VWAP (~$30.20, April 11).
Stance: Bullish (buyers control).
ICT/SMC:
MSS: Bearish (lower highs from $38.401, March 17, but higher low $27.95, April 8, signals potential shift).
Trend: Neutral (consolidation $29–$31, testing W-High $31.35).
Summary: Neutral-bullish, price at HVN ($30.00) with LVN ($31.50) as sweep target. Indicators favor upside, but MSS needs confirmation.
1-Hour Chart
Support/Resistance:
Support: $29.41 (D-Low, April 11), aligns with W-Open ($29.59), HVN ($30.00).
Resistance: $30.63 (D-High, April 11), near LVN ($31.50), W-High ($31.35).
Stance: Bullish (price above support, testing resistance).
RSI (14):
Level: ~60 (bullish, rising from 50 at $29.41).
Stance: Bullish (>50, not overbought).
MACD:
Status: Above signal, positive histogram.
Stance: Bullish (momentum building).
Bollinger Bands:
Status: Price near upper band ($30.60).
Stance: Bullish (breakout potential).
Donchian Channels:
Status: Above midline ($30.02).
Stance: Bullish (trend strength).
Williams %R:
Level: ~-30 (bullish, not overbought).
Stance: Bullish (>-50).
VWAP:
Status: Above VWAP (~$30.30, intraday April 11).
Stance: Bullish (buyers dominate).
ICT/SMC:
Buy-Side Liquidity: Above $30.63 (D-High), $31.35 (W-High), LVN ($31.50). Retail stops cluster here.
Sell-Side Liquidity: Below $29.41 (D-Low), $27.95 (W-Low/M-Low).
OB: Bullish OB at $29.80–$30.00 (April 10 consolidation, demand zone, near HVN $30.00).
FVG: Bullish FVG at $30.00–$30.20 (April 11 gap, unfilled, aligns with D-Open $30.12).
OTE: Fib 61.8%–78.6% from $29.41 (low) to $30.63 (high) = $30.05–$30.15 (overlaps OB/FVG/HVN).
Displacement: Potential impulsive move to $31.50 (LVN) or $29.00 (below D-Low) on Retail Sales or tariff news.
Summary: Bullish bias, with OTE ($30.05–$30.15) as entry zone post-sweep, supported by OB/FVG/HVN.
10-Minute Chart
Closing Move (April 11):
Status: Rallied to $30.52, closed near high ($30.63), strong volume.
Stance: Bullish (buyers pushed close).
EMA Direction:
Status: 8-EMA ($30.45) > 13-EMA ($30.40) > 48-EMA ($30.30), uptrend.
Stance: Bullish (EMAs rising).
RSI (14):
Level: ~65 (bullish, cooling from 70).
Stance: Bullish (>50, not overbought).
MACD:
Status: Above zero, bullish crossover.
Stance: Bullish (momentum intact).
VWAP:
Status: Above VWAP (~$30.40, late April 11).
Stance: Bullish (buyers control).
ICT/SMC:
Liquidity Sweep: Wick to $30.63 (8:50 AM, April 11) tested buy-side, no clear rejection yet.
Retracement: Potential retrace to $30.05–$30.15 (OTE) if sweep completes (e.g., April 14, 8:00 AM).
Entry Signal: Pin bar or engulfing at OTE (e.g., $30.10, 10-minute candle).
Summary: Bullish, awaiting sweep above $30.63 or $31.35, retrace to OTE for entry.
Options Data
Analysis:
GEX (Gamma Exposure):
Status: Positive GEX at $31 strike (high call OI), neutral at $30.
Impact: Dealers buy stock to hedge calls, supporting $31 pin or slight lift to $31.50.
Explanation: Positive GEX stabilizes price near high OI strikes, aligning with LVN ($31.50) sweep.
Stance: Neutral-bullish (pinning likely, breakout possible).
DEX (Delta Exposure):
Status: High call delta (+0.3, 89% call volume).
Impact: Bullish pressure, as dealers hedge calls by buying KWEB.
Explanation: Call-heavy delta fuels upside momentum, supporting buy-side sweep.
Stance: Bullish.
IV (Implied Volatility):
Status: Moderate (~25%, vs. 20–35% norm for KWEB).
Impact: Steady swings ($0.50–$1.00/day), good for ATM/OTM calls.
Explanation: Moderate IV balances premium cost and volatility, ideal for OTE entries.
Stance: Bullish (volatility supports options).
OI (Open Interest):
Status: Call-heavy (65% calls at $31, 20% at $32, 15% puts at $30).
Impact: Momentum toward $31–$32, potential pin at $31 (high OI).
Explanation: High call OI marks targets (W-High $31.35, LVN $31.50), puts at $30 guard HVN.
Stance: Bullish (calls drive upside).
Cem Karsan’s Application and Weekly Trading Breakdown:
Gamma: High at $31 (pinning risk), low at $32 (breakout potential).
Vanna: Rising IV (25% to 30% on Retail Sales) lifts calls, dealers buy KWEB, pushing to $31.50.
Charm: Near OPEX (April 18), $31 calls hold delta if ITM, spiking volatility April 17–18.
Volatility Skew: Call skew (higher IV for $32 vs. $30) favors upside breakouts.
Weekly OI (Exp. April 18): 65% calls at $31, 20% at $32. Pinning likely at $31 unless Retail Sales sparks breakout to $32.
Options Strategy:
Trade: Buy $31 calls at OTE ($30.10, April 14, 8:50 AM), premium ~$0.50.
Exit: $31.50 (W-High/LVN, premium ~$0.90), profit $0.40.
Stop: Below OB ($29.80, premium ~$0.20), risk $0.30.
R:R: 1.33:1 (adjust to 2:1 with partial exit).
ICT/SMC Tie-In: Enter post-sweep ($31.35), retrace to OTE ($30.10), target $31.50.
Vanna:
Status: IV rise (25% to 30%) amplifies calls, dealers buy KWEB.
Impact: Bullish lift to $31–$31.50, aligns with LVN sweep.
Explanation: Vanna boosts delta near high OI, supporting OTE reversal.
Charm:
Status: OPEX (April 18) nears, $31 calls gain delta if KWEB hits $31.
Impact: Volatility spikes April 17–18, favors quick OTE trades.
Explanation: Charm accelerates delta, amplifying sweep-to-OTE moves.
Timeframe Analysis:
Weekly (Exp. April 18):
OI: 65% calls ($31), 20% ($32), 15% puts ($30).
IV: Moderate (25%), rising on catalysts.
Stance: Bullish (calls dominate, breakout risk).
Monthly (Exp. May 2):
OI: Balanced (50% calls $32, 50% puts $29).
IV: Stable (~24%).
Stance: Neutral (consolidation likely).
3-Month (Exp. July 7):
OI: Call skew ($33–$35, 60% calls).
IV: Low (~22%).
Stance: Bullish (long-term upside).
Directional Bias:
Synthesis: Positive GEX ($31 pin), high call DEX (+0.3), moderate IV (25%), call-heavy OI (65% at $31), vanna (IV lift), charm (OPEX volatility), and ICT/SMC (buy-side sweep to $31.35, OTE at $30.10) suggest a bullish trend for April 14, with potential retracement post-sweep.
Why: Options data aligns with ICT/SMT (call OI = buy-side liquidity, OTE = dealer hedging zone), per AMT (LVN sweep, HVN reversal).
Action: Focus on $31 calls, highlight pinning vs. breakout. Video: “KWEB’s $31 call wall could pin or pop—perfect for an OTE play.”
Sympathy Plays
Correlated Assets:
MCHI (iShares MSCI China ETF): Tracks broader Chinese equities, rises ~2–3% if KWEB rallies (e.g., $31.50), due to shared holdings (Alibaba, Tencent).
BABA (Alibaba ADR): KWEB’s top holding, moves +3–4% on KWEB’s sweep to $31.35, driven by e-commerce/AI overlap.
Opposite Mover:
GLD (SPDR Gold ETF): Risk-off asset, fades ~1–2% if KWEB rallies (risk-on), as investors shift from safe havens to tech.
Why: Sympathy plays confirm sector momentum (Chinese tech), while GLD hedges tariff fears, per ICT/SMT sentiment.
Action: Monitor MCHI/BABA for confirmation, GLD for divergence. Video: “If KWEB pops, MCHI and BABA follow—watch gold for the flip side.”
Sector Positioning with RRG
Sector: Technology – Emerging Markets (China Internet).
RRG Position: Improving (vs. MCHI ETF).
Rationale: KWEB’s April 11 rally (+2.97%) outpaces MCHI (+2.1%), with RSI (~55) and call OI signaling strength. Tariff fears weaken absolute gains, but relative momentum grows.
Tie-In: Improving quadrant supports bullish MSS, OTE entries at HVN ($30.00).
Why: RRG aligns with sentiment (call-heavy) and technicals (above HVN), per AMT value area.
Action: Highlight Improving RRG for video: “KWEB’s gaining steam in China tech—prime for a sweep setup.”
Targets
Bullish:
Target: +3.5% to $31.60.
Levels: W-High ($31.35), LVN ($31.50), next resistance ($32.00).
Rationale: Buy-side sweep to $31.35 (W-High), breakout to LVN on Retail Sales or tariff relief, per ICT/SMC.
Bearish:
Target: -3.2% to $29.55.
Levels: D-Low ($29.41), below W-Open ($29.59), HVN ($29.50).
Rationale: Sell-side sweep below $29.41 on weak Retail Sales or tariff escalation, retracing to HVN, per AMT.
Why: Targets tie to OHLC (W-High, D-Low), HVNs/LVNs, and catalysts, ensuring ICT/SMC alignment (liquidity to OTE).
(AAL) American Airlines "Crashing"?! Long Put Worthy?American Airline (AAL) in recent years has had major news coverage due to various collisions and other events. The technicals appear to show some strong bearish momentum forming on the 1 Week chart. Will the airline company coming crashing down? Or is this currently a discounted buying opportunity? What are your thoughts?

Inversion Fair Value Gaps (IFVGs) - A Deep Dive Trading GuideIntroduction
Inversion Fair Value Gaps (IFVGs) are an advanced price action concept rooted in Smart Money theory. Unlike standard Fair Value Gaps (FVGs), IFVGs consider the idea of price revisiting inefficiencies from an inverse perspective. When price "respects" a previously violated gap from the opposite side, it creates a powerful confluence for entries or exits.
This guide will cover:
- What an IFVG is
- How it differs from traditional FVGs
- Market context for IFVG setups
- How to trade them effectively
- Real chart examples for clarity
---
What is an IFVG?
An Inversion Fair Value Gap (IFVG) occurs when price trades through a traditional Fair Value Gap and later returns to that area, but instead of continuing in the original direction, it uses the gap as a support or resistance from the other side.
Standard FVG vs. IFVG:
- FVG: Price creates a gap (imbalance), and we expect a return to the gap for mitigation.
- IFVG: Price violates the FVG, but instead of invalidation, it respects it from the other side.
Example Logic: A bullish FVG is formed -> price trades through it -> later, price revisits the FVG from below and uses it as resistance.
---
Structure and Market Context
Understanding structure is key when trading IFVGs. Price must break structure convincingly through a Fair Value Gap. The gap then acts as an inversion zone for future reactions.
Ideal Market Conditions for IFVGs:
1. Market is trending or has recently had a strong impulsive move.
2. A Fair Value Gap is created and violated with displacement .
3. Price retraces back to the FVG from the opposite side .
4. The gap holds as support/resistance, indicating smart money has respected the zone.
---
Types of IFVGs
1. Bullish IFVG: Price trades up through a bearish FVG and later uses it as support.
2. Bearish IFVG: Price trades down through a bullish FVG and later uses it as resistance.
Note: The best IFVGs are often aligned with Order Blocks, liquidity levels, or SMT divergences.
---
How to Trade IFVGs
1. Identify a clear Fair Value Gap in a trending market.
2. Wait for price to break through the FVG with momentum .
3. Mark the original FVG zone on your chart.
4. Monitor for price to revisit the zone from the other side.
5. Look for reaction + market structure shift on lower timeframes.
6. Enter trade with a clear stop loss just beyond the IFVG.
Entry Confluences:
- SMT divergence
- Order Block inside or near the IFVG
- Breaker Blocks
- Time of day (e.g., NY open)
---
Refined Entries & Risk Management
Once the IFVG is identified and price begins to react, refine entries using:
- Lower timeframe market structure shift
- Liquidity sweeps just before tapping the zone
- Candle closures showing rejection
Risk Management Tips:
- Set stop loss just beyond the IFVG opposite wick
- Use partials at 1:2 RR and scale out based on structure
- Don’t chase missed entries—wait for clean setups
---
Common Mistakes to Avoid
- Confusing IFVG with invalidated FVGs
- Trading them in low volume or choppy conditions
- Ignoring market context or structure shifts
- Blindly entering on first touch without confirmation
Tip: Let price prove the level—wait for reaction, not prediction.
---
Final Thoughts
IFVGs are an advanced but powerful tool when used with precision. They highlight how Smart Money uses inefficiencies in both directions, and when combined with other concepts, they can form sniper-like entries.
Practice finding IFVGs on historical charts. Combine them with SMT divergences, OBs, and market structure, and soon you’ll start seeing the market through Smart Money eyes.
Happy Trading!

IDBI Bank Looking to make a comeback on Weekly Charts. IDBI Bank Ltd. engages in the provision of commercial banking services to retail and corporate customers. It operates through the following segments: Corporate and Wholesale Banking; Retail Banking; Treasury; and Other Banking and Group Operations. The Corporate and Wholesale Banking segment includes corporate relationship covering deposit and credit activities other than retail, as well as corporate advisory and syndication, project appraisal, and investment portfolio.
IDBI Bank Ltd. Closing price is 79.49. The positive aspects of the company are Attractive Valuation (P.E. = 11.9), Companies with Zero Promoter Pledge, Company able to generate Net Cash - Improving Net Cash Flow, Companies with Low Debt, Stocks Outperforming their Industry Price Change in the Quarter, FII / FPI or Institutions increasing their shareholding and MFs increased their shareholding last quarter The Negative aspects of the company is Companies with high market cap, lower public shareholding.
Entry can be taken after closing above 80 Historical Resistance in the stock will be 83.7, 88.1 and 92.1. PEAK Historic Resistance in the stock will be 95.6 and 99.3. Stop loss in the stock should be maintained at Closing below 65.4.
Disclaimer: The above information is provided for educational purpose, analysis and paper trading only. Please don't treat this as a buy or sell recommendation for the stock or index. The Techno-Funda analysis is based on data that is more than 3 months old. Supports and Resistances are determined by historic past peaks and Valley in the chart. Many other indicators and patterns like EMA, RSI, MACD, Volumes, Fibonacci, parallel channel etc. use historic data which is 3 months or older cyclical points. There is no guarantee they will work in future as markets are highly volatile and swings in prices are also due to macro and micro factors based on actions taken by the company as well as region and global events. Equity investment is subject to risks. I or my clients or family members might have positions in the stocks that we mention in our educational posts. We will not be responsible for any Profit or loss that may occur due to any financial decision taken based on any data provided in this message. Do consult your investment advisor before taking any financial decisions. Stop losses should be an important part of any investment in equity.

BPCL looking strong on Weekly Charts. Bharat Petroleum Corp. Ltd. is a holding company, which engages in the business of refining of crude oil and marketing of petroleum products. It operates through the Downstream Petroleum and Exploration & Production (E&P) segment. The Downstream Petroleum segment includes the refining and marketing of petroleum products. The E&P segment focuses on hydrocarbons.
Bharat Petroleum Corp. Ltd. Closing price is 293.20. The positive aspects of the company are Very Attractive Valuation (P.E. = 9.3), Companies with reducing Debt, Companies with Zero Promoter Pledge, Stocks Outperforming their Industry Price Change in the Quarter, Growth in Net Profit with increasing Profit Margin and MFs increased their shareholding last quarter. The Negative aspects of the company are Declining Net Cash Flow : Companies not able to generate net cash and Companies with growing costs YoY for long term projects.
Entry can be taken after closing above 296 Historical Resistance in the stock will be 306, 319 and 330. PEAK Historic Resistance in the stock will be 345, 355 and 366. Stop loss in the stock should be maintained at Closing below 261 or 234 depending upon your risk taking ability.
Disclaimer: The above information is provided for educational purpose, analysis and paper trading only. Please don't treat this as a buy or sell recommendation for the stock or index. The Techno-Funda analysis is based on data that is more than 3 months old. Supports and Resistances are determined by historic past peaks and Valley in the chart. Many other indicators and patterns like EMA, RSI, MACD, Volumes, Fibonacci, parallel channel etc. use historic data which is 3 months or older cyclical points. There is no guarantee they will work in future as markets are highly volatile and swings in prices are also due to macro and micro factors based on actions taken by the company as well as region and global events. Equity investment is subject to risks. I or my clients or family members might have positions in the stocks that we mention in our educational posts. We will not be responsible for any Profit or loss that may occur due to any financial decision taken based on any data provided in this message. Do consult your investment advisor before taking any financial decisions. Stop losses should be an important part of any investment in equity.

S&P 500 Daily Chart Analysis For Week of April 11, 2025Technical Analysis and Outlook:
During the current trading session, the Index has recorded lower opening prices, thereby completing our key Outer Index Dip levels at 5026 and 4893, as previously highlighted in last week's Daily Chart analysis. This development establishes a foundation for a continuous upward trend, targeting the Outer Index Rally at 5550, with an interim resistance identified at 5455. Should this upward momentum persist, further extension may reach the subsequent resistance levels of 5672 and 5778, respectively. However, it is essential to note that a downward momentum may occur at the very significant completion target level of the Outer Index Rally at 5550, with the primary objective being a Mean Sup 5140 and retest of the completed Outer Index Dip at 4890.

ORACLE: On a 3 year bottom. Buy opportunity for 240 long termOracle is bearish on its 1W technical outlook (RSI = 35.862, MACD = -4.360, ADX = 42.565) as this week it reached almost the same levels of correction as the 2022 Bear Market (-42.72%). This is also nearly a HL bottom for the 3 year Channel Up and as the 1W MA200 is right below, a great long term buy opportunity. The bullish wave after the 2022 bottom almost reached the 1.382 Fibonacci, so we have a technical level to target this time also (TP = 240).
See how our prior idea has worked out:
## If you like our free content follow our profile to get more daily ideas. ##
## Comments and likes are greatly appreciated. ##

AUD/USD - Sellers remain in control!The AUD/USD pair has been in a clear and consistent downtrend on both the 4-hour and daily timeframes. Sellers have maintained firm control over price action, driving the pair lower while it continues to respect the prevailing bearish market structure. Each failed bullish attempt further validates the dominance of the bears, reinforcing the narrative that the path of least resistance remains to the downside.
Recently, however, the 4-hour chart witnessed a sharp move to the upside, tapping into and filling a previously unmitigated 4H Fair Value Gap (FVG). Despite this temporary rally, the broader structure remains bearish, with the market still printing lower highs and lower lows, a classic hallmark of a sustained downtrend. As such, the current momentum favors a continuation lower, potentially targeting the green imbalance/FVG zone on the 4H timeframe, which aligns with the next logical area of liquidity.
This green FVG also coincides with the golden pocket retracement zone (61.8%–65%), adding confluence and strengthening its validity as a potential support area. A reaction here could provide an opportunity for a short-term bullish correction or even the start of a larger reversal, depending on how price behaves around this level.
That said, a bullish scenario is not entirely off the table. Should price decisively break above the red FVG to the upside, and ideally close above it with conviction, it may signal a potential shift in market sentiment. This would be the first sign of buyers regaining control, suggesting a possible trend reversal or at least a deeper retracement toward higher time frame resistance zones.
Until such confirmation is seen, however, bearish momentum prevails. Traders can continue to favor short setups, with particular interest around premium zones on the 4H chart. Any bullish setups should be approached cautiously and ideally considered only at key areas of support like the green FVG, especially where it aligns with high-probability fib levels.
Thanks for your support.
- Make sure to follow me so you don't miss out on the next analysis!
- Drop a like and leave a comment!

XPeng Inc. (XPEV) – Driving the Smart EV Revolution Company Snapshot:
XPeng NYSE:XPEV is solidifying its status as a smart electric vehicle pioneer, blending cutting-edge AI, proprietary battery tech, and global expansion to challenge the status quo in EV innovation.
Key Catalysts:
Product Innovation 🚀
New 2025 G6 & G9 feature 5C fast-charging AI batteries
Turing-powered autonomous driving is among the most advanced in China
XNGP smart driving system reaches 86% active user penetration across cities
AI-Defined Vehicles 🤖
Launch of XPENG P7+, an AI-enhanced EV with futuristic user interfaces
Showcases XPeng’s edge in machine learning + mobility
Global Expansion 🌍
Entering UK, Indonesia, and Switzerland, boosting brand recognition & revenue diversification
Creates strategic foothold in key international EV markets
First-Mover Advantage 🔧
One of the few companies to integrate full-stack smart driving + proprietary battery tech
Strong R&D focus (40% of workforce) keeps XPeng at the forefront of next-gen mobility
Investment Outlook:
✅ Bullish Above: $17.50–$18.00
🚀 Upside Target: $25.00–$26.00
📈 Growth Drivers: Global footprint, AI-defined mobility, and rising EV adoption
⚡ XPeng – The AI brain behind tomorrow’s drive. #XPEV #EVInnovation #AIOnWheels

Quantum's T (AT&T) Trading Guide 4/11/25T (AT&T Inc.)
Sentiment
• Sentiment is neutral with a bearish tilt. April 10 options activity shows put-heavy volume at $26 strikes, reflecting caution. RSI (14) at ~50 (estimated, flat trend at $26.40 close) suggests indecision. X posts highlight concerns over telecom debt loads and tariff risks on equipment imports, but some speculate on institutional accumulation below $26.50. A liquidity sweep below $26.33 could trigger a bullish reversal if buy-side liquidity is tapped.
Catalyst: Potential sweep below $26.33 may spark short covering.
Tariff Impact - Rating: Moderate.
• Explanation: T relies on imported telecom equipment, facing cost pressures from tariffs on China (active as of April 11). No relief announced, so margins could tighten, capping upside. X posts suggest tariff fears weigh on sentiment, but domestic revenue focus limits fundamental damage.
News/Catalysts
• Driver: Flat telecom sector performance on April 10, with T holding steady amid mixed market signals. X posts cited stability but no clear catalyst.
• Upcoming: CPI (April 11): High CPI could hurt T (-1.5%) due to rate hike fears; low CPI may lift it (+1%) as a yield play.
• Retail Sales (April 15): Strong data supports T (+1%); weak data pressures (-1%) due to consumer spending risks.
Technical Setup
Weekly Chart:
• HVN: $26.00 support (bullish).
• LVN: $27.00 resistance (neutral).
• EMA Trend: 8-week ≈ 13-week > 48-week (neutral).
• RSI (14): ~50 (neutral).
• MACD: Near signal line (neutral).
• Bollinger Bands: At midline (neutral).
• Donchian Channels: At midline (neutral).
• Williams %R: ~-50 (neutral).
• ADR: Stable (neutral).
• VWAP: At VWAP $26.40 (neutral).
• ICT/SMC: No clear MSS; consolidation phase.
One-Hour Chart:
• Support/Resistance: Support at $26.33; resistance at $26.56. Stance: neutral.
• RSI (14): ~50 (neutral).
• MACD: Near zero (neutral).
• Bollinger Bands: At midline (neutral).
• Donchian Channels: At midline (neutral).
• Williams %R: ~-50 (neutral).
• VWAP: At VWAP $26.50 (neutral).
• ICT/SMC: Sell-side liquidity below $26.33; OB at $26.40; FVG at $26.35–$26.45; OTE at $26.45; no displacement.
10-Minute Chart:
• Closing Move: Flat into close.
• EMA Direction: 8/13/48 EMAs flat (neutral).
• RSI (14): ~50 (neutral).
• MACD: Near zero (neutral).
• VWAP: At VWAP $26.50 (neutral).
• ICT/SMC: Potential sweep below $26.33; OTE at $26.45; no clear entry signal yet.
Options Data
• GEX: Neutral, pinning at $26.50. Dealers hedge minimally.
• DEX: Put delta bias (-0.15), bearish pressure.
• IV: Low (~18%), limited swings.
• OI: Put-heavy (55% puts at $26), capping upside.
Cem Karsan’s Application:
• Weekly Trading Breakdown: OI at $26 suggests pinning. Low gamma limits volatility; vanna neutral; charm favors puts near OPEX.
• Strategy: Buy $26.50 calls at $26.45 (OTE), exit at $27, profit $0.30, risk $0.40. Ties to sweep below $26.33.
• Vanna: Stable IV, no dealer-driven lift.
• Charm: Puts gain delta near OPEX, pressuring $26.
Timeframe Analysis:
• Weekly (exp. April 18): Put OI at $26, low IV, bearish stance.
• Monthly (exp. May 16): Balanced OI, neutral stance.
• 3-Month (exp. July 18): Neutral outlook.
• Directional Bias: Neutral, leaning bearish unless sweep triggers reversal.
Sympathy Plays
• Correlated Assets: VZ (+1%), CCI (+0.5%).
• Opposite Mover: If T fades, risk-on SPOT rises (+1%).
Sector Positioning with RRG - Sector: Communication Services – Telecom.
• RRG Position: Lagging vs. XLC, reflecting weak momentum.
Targets
• Bullish: +2% to $27.00 (OB).
• Bearish: -2% to $25.87 (FVG).

Quantum's KR Trading Guide 4/11/25
KR (Kroger Company)
Sentiment
• Analysis: Market sentiment for KR is neutral leaning bullish. Post-close options activity on April 10 shows balanced put/call volume, with slight call dominance at strikes near $69, suggesting cautious optimism. RSI (14) at the April 10 close (estimated ~60 based on recent uptrend to $67.96) indicates momentum without overbought conditions, supporting a potential continuation. Anonymized X chatter highlights speculation on grocery sector stability amid tariff uncertainties, with some noting KR’s domestic focus as a hedge against import risks. A potential liquidity sweep above recent highs ($68.76) could signal institutional buying, setting up a reversal to the upside.
Catalyst: Watch for a sweep above $68.76 triggering bullish momentum, driven by retail investor interest on X.
Tariff Impact - Rating: Minimal.
• Explanation: KR’s exposure to tariffs is limited due to its primarily domestic supply chain and focus on U.S.-sourced goods. While imported specialty products could face cost pressures, these are a small fraction of revenue. No tariff relief or escalation was announced on April 10, so sentiment remains stable. Fundamentals are unaffected, but speculative X posts suggest tariff fears could cap upside unless clarity emerges.
News/Catalysts
• No specific company news on April 10, but sector strength in consumer staples drove modest gains, with KR benefiting from defensive positioning amid broader market volatility. X posts noted KR as a “safe play” in uncertain times.
• Upcoming: CPI Data (Today, April 11): Stronger-than-expected CPI could pressure consumer staples (-1% move) as investors rotate to cyclicals; weaker CPI could boost KR (+2%) as a defensive name.
• Retail Sales (April 15): Robust data may signal consumer strength, lifting KR (+1.5%); weak data could hurt (-1%) due to spending concerns.
Technical Setup
Weekly Chart:
• HVN: $66.50 as support (bullish, price above).
• LVN: $70.00 as resistance (neutral, price below).
• EMA Trend: 8-week > 13-week > 48-week (bullish uptrend).
• RSI (14): ~62 (bullish, above 50).
• MACD: Above signal line (bullish).
• Bollinger Bands: Near upper band (bullish).
• Donchian Channels: Above midline (bullish).
• Williams %R: ~-20 (neutral, not overbought).
• ADR: Expanding (bullish, volatility rising).
• VWAP: Above weekly VWAP at $67.00 (bullish).
• ICT/SMC: Higher highs/lows confirm bullish Market Structure Shift (MSS).
One-Hour Chart:
• Support/Resistance: Support at $67.50 (weekly HVN confluence); resistance at $68.76 (daily high). Stance: bullish above support.
• RSI (14): ~65 (bullish).
• MACD: Above signal (bullish).
• Bollinger Bands: At upper band (neutral, potential pullback).
• Donchian Channels: Above midline (bullish).
• Williams %R: ~-15 (neutral).
• VWAP: Above hourly VWAP at $68.20 (bullish).
• ICT/SMC: Buy-side liquidity above $68.76; Order Block (OB) at $67.50 demand zone; FVG at $68.00–$68.10; OTE (Fib 61.8%) at $68.30; displacement seen in early April 11 rally.
10-Minute Chart:
• Closing Move: Strong rally into April 10 close, holding above $67.96.
• EMA Direction: 8/13/48 EMAs rising (bullish).
• RSI (14): ~60 (neutral).
• MACD: Above zero (bullish).
• VWAP: Above VWAP at $68.30 (bullish).
• ICT/SMC: Liquidity sweep above $68.40 in pre-market; retracement to OTE at $68.30; pin bar forming as entry signal.
Options Data
• GEX: Neutral, slight bullish pinning at $68. Dealers may buy stock to hedge, supporting price at $68–$69. Explanation: Gamma Exposure balances calls/puts, stabilizing price near strikes.
• DEX: Moderate call delta bias (+0.25), indicating bullish pressure. Explanation: Net call buying drives directional momentum.
• IV: Moderate (~22%, near norm), suggesting steady swings. Explanation: Implied Volatility supports consistent options pricing.
• OI: Call-heavy (60% calls at $69 strike), favoring upside momentum. Explanation: Open Interest at $69 signals potential breakout target.
Cem Karsan’s Application:
• Weekly Trading Breakdown: High call OI at $69 (exp. April 18) suggests pinning or breakout potential. Gamma supports stability at $68; vanna indicates dealers buy on IV spikes to 23%, lifting price. Charm accelerates delta near OPEX, favoring $69 calls if in-the-money.
• Strategy: Buy $69 calls at $68.30 (OTE), exit at $69.50, profit $0.50, risk $0.40. Ties to liquidity sweep above $68.76, targeting $69 OB.
• Vanna: Rising IV to 23% could push dealers to buy, lifting KR to $69 (bullish).
• Charm: Near OPEX, $69 calls hold delta if ITM, boosting volatility.
Timeframe Analysis:
• Weekly (exp. April 18): 60% call OI at $69, moderate IV, bullish stance.
• Monthly (exp. May 16): Balanced OI, stable IV, neutral stance.
• 3-Month (exp. July 18): Slight call skew, low IV, bullish outlook.
• Directional Bias: Bullish, driven by call OI, positive GEX, and OTE setup at $68.30.
Sympathy Plays
• Correlated Assets: WMT (+2% if KR rallies), COST (+1.5%).
• Opposite Mover: If KR rallies (defensive), risk-on names like SHOP fade (-1%).
Sector Positioning with RRG
• Sector: Consumer Staples – Food Retail.
• RRG Position: Improving vs. XLP ETF, aligning with bullish sentiment and technicals.
Targets
• Bullish: +3% to $70.50 (next liquidity zone, OB at $70).
• Bearish: -2% to $66.60 (FVG at $66.50).

MICROSOFT On 4th largest correction in 15 years. Buy or trap?Microsoft (MSFT) has corrected by -26.50% from its All Time High (ATH), representing the 4th biggest correction since June 2010, which was the first pull-ack after the historic 2008 Housing Crisis.
At the same time the 1W RSI hit the 30.00 oversold limit for the first time since that low of June 2010! Not even the Housing bottom didn't exhibit such low 1W RSI.
All while the current Tariff War correction stopped a little before testing the 1W MA200 (orange trend-line), which has been the long-term Support since 2011 and was last hit (for the 2nd time during that time span) in December 2022 during the previous Inflation Crisis.
As a result, this is a unique long-term buy opportunity for such a tech giant. The 2010 rebound hit the 0.786 Fibonacci level before pulling back while the rally that was initiated after the 2022 Inflation Crisis bottom reached +117.45%.
Based on the above, we have a medium-term Target on MSFT at $440 (Fib 0.786) and a long-term at $700 (+100%).
-------------------------------------------------------------------------------
** Please LIKE 👍, FOLLOW ✅, SHARE 🙌 and COMMENT ✍ if you enjoy this idea! Also share your ideas and charts in the comments section below! This is best way to keep it relevant, support us, keep the content here free and allow the idea to reach as many people as possible. **
-------------------------------------------------------------------------------
💸💸💸💸💸💸
👇 👇 👇 👇 👇 👇
