Nightly $SPY / $SPX Scenarios for March 12, 2025 🔮 🔮
🌍 Market-Moving News 🌍:
🇺🇦🇷🇺 Ceasefire Proposal in Ukraine 🇺🇦🇷🇺: Ukraine has expressed willingness to accept a month-long ceasefire proposal, leading to a surge in the euro to five-month highs. This development has introduced volatility in European and U.S. equity markets, influenced by ongoing U.S. tariff plans.
🇺🇸🇨🇦 U.S. Tariff Increases on Canadian Imports 🇺🇸🇨🇦: President Trump has threatened to double tariffs on Canadian steel and aluminum imports to 50%, escalating trade tensions and contributing to a deepening stock market sell-off. This move has raised concerns about inflation and economic growth, affecting investor confidence.
📊 Key Data Releases 📊:
📅 Wednesday, March 12:
📈 Consumer Price Index (CPI) (8:30 AM ET) 📈:The CPI measures the average change over time in prices paid by urban consumers for a basket of goods and services, serving as a key indicator of inflation.
Forecast: +0.2% month-over-month
Previous: +0.3% month-over-month
⚠️ Disclaimer: This information is for educational and informational purposes only and should not be construed as financial advice. Always consult with a professional financial advisor before making investment decisions.⚠️
📌 #trading #stockmarket #economy #news #trendtao #charting #technicalanalysis
Stocks

TESLA: Oversold but correction my not be over yet.Tesla is oversold on its 1D technical outlook (RSI = 25.606, MACD = -36.970, ADX = 56.250) but the correction may not be over. The brutal bearish wave since the December 18th 2024 ATH may technicall bottom on the HL trendline, despite having breached the 0.618 Fibonacci yesterday. That is because the April 22nd 2024 bottom was also priced below the 0.618 Fib, even under the S1 Zone. In order to buy confidently again for the long term, we need to see the 1D RSI forming HL again. We expect to see TESLA within the 200 - 190 range before a rebound takes place and then our long term target would be near the HH trendline, TP = 650.
## If you like our free content follow our profile to get more daily ideas. ##
## Comments and likes are greatly appreciated. ##

Silly Speculation #1.Charting the bottom to our current downside move. I could be wrong...if so, I would say by 2-3%.

TSLA (Tesla) long set up Entry 1 $220.00
Entry 2 $200.00
Stop loss $180.00
Take profit 1- $250.00
(Close 33%)
Take profit 2- $290.00
(Close 66%)
Take profit 3-$330
(Close 100%)

TTD LONG SET UP (The Trade Desk)Entry 1 $60.50
Entry 2 $45.50
Stop loss $30.50
Take profit 1- $80.50
(Close 25%)
Take profit 2- $100.50
(Close 50%)
Take profit 3-$120.00
(Close 75%)
Take profit 4-$140.00
(Close 100%)

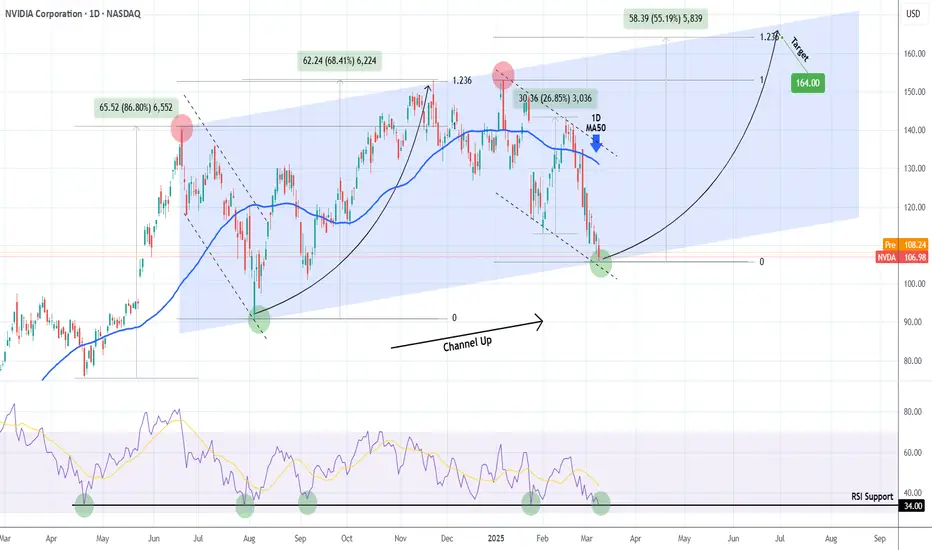
NVIDIA 9-month Channel Up bottomed! Is it a buy??NVIDIA Corporation (NVDA) has been trading within a Channel Up pattern for almost 9 months (since the June 20 2024 High). The correction since the start of January is technically the pattern's Bearish Leg and yesterday it hit the bottom (Higher Low trend-line).
Last time it did so was on August 05 2024 and an instant rebound followed. That was also the time the 1D RSI was on the 34.00 Support, just like today. In fact every time in the past 11 months that this RSI Support was tested, the price rebounded aggressively by at least +26.85%.
Since the previous Higher High rebound peaked on the 1.236 Fibonacci extension, our Target on the medium-term will be $164.00.
-------------------------------------------------------------------------------
** Please LIKE 👍, FOLLOW ✅, SHARE 🙌 and COMMENT ✍ if you enjoy this idea! Also share your ideas and charts in the comments section below! This is best way to keep it relevant, support us, keep the content here free and allow the idea to reach as many people as possible. **
-------------------------------------------------------------------------------
💸💸💸💸💸💸
👇 👇 👇 👇 👇 👇
Tesla (TSLA) Weekly Chart Analysis – Key Levels & Market OutlookTesla (TSLA) Weekly Chart Analysis – Key Levels & Market Outlook 🚀
1️⃣ Overall Trend:
✅ Long-Term Uptrend (2019-2021): Tesla experienced a massive rally, reaching all-time highs.
🔻 Correction Phase (2022): A significant pullback led to a strong downtrend.
📈 Recovery Mode (2023-Present): The stock started forming higher highs and higher lows, indicating a bullish structure.
📉 Recent Pullback: The price is now retracing from recent highs, showing potential short-term downside momentum.
2️⃣ Key Support & Resistance Levels:
📌 Support Zones:
$300: A critical level—if it breaks, Tesla could drop further.
$260 - $280: The next demand zone if selling pressure continues.
$240 - $250: Strong historical support, previous swing low.
$180 - $200: A major long-term base where Tesla found strong demand before a rally.
📌 Resistance Zones:
$380 - $400: A strong rejection zone—Tesla recently pulled back from here.
Above $400: A breakout could send TSLA toward $500+ (previous cycle highs).
3️⃣ Candlestick & Price Action Observations:
📉 Bearish Momentum:
The latest weekly candle is red, indicating strong selling pressure.
If Tesla fails to hold $300, expect a move toward $260-$280.
📊 Potential Bounce Area:
If buyers step in, Tesla might consolidate before another leg higher.
4️⃣ Market Context & Indicators:
🚗 EV Sector & Nasdaq Trends: Tesla follows macroeconomic conditions and overall tech sector movements.
📆 Earnings & News Catalysts: Watch for updates on deliveries, margins, and macro sentiment.
📊 Technical Indicators:
✅ Moving Averages:
50-Week MA: A close below this could signal weakening momentum.
200-Week MA: A crucial long-term dynamic support.
✅ RSI (Relative Strength Index):
Not oversold yet—watch for levels near 30 for potential reversals.
✅ MACD (Moving Average Convergence Divergence):
Bearish crossover forming? A confirmation could indicate further downside momentum.
✅ Fibonacci Retracement:
Retracement levels align with $260 - $280 as a possible bounce zone.
5️⃣ What’s Next?
📌 Bullish Scenario: If Tesla holds $300, expect a potential rebound toward $350-$380.
📌 Bearish Scenario: A break below $300 could lead to a test of $260-$280, with downside risk toward $240 - $250 in extreme cases.
🚀 Key Question: Will Tesla hold support and bounce back, or will sellers push it lower?
💬 Drop your thoughts below! 🔥📉📈

Nightly $SPY / $SPX Scenarios for March 11, 2025🔮 🔮
🌍 Market-Moving News 🌍:
🇯🇵🤝 Japan-U.S. Trade Discussions 🤝: Japanese Trade Minister Yoji Muto is visiting Washington from March 9–11 to engage in discussions with U.S. officials. The talks aim to strengthen economic ties and address trade concerns, including potential exemptions for Japanese exports from proposed U.S. tariffs. These negotiations could influence sectors such as automotive and steel, impacting market dynamics.
🇨🇳📊 China's National People's Congress (NPC) Developments 📊: The 2025 National People's Congress is underway in Beijing from March 5–11. Key economic targets and policy directions set during the NPC may affect global markets, including the U.S., especially in areas related to trade, technology, and foreign investment.
📊 Key Data Releases 📊:
📅 Tuesday, March 11:
📄 JOLTS Job Openings (10:00 AM ET) 📄:This report provides data on job openings, hires, and separations, offering a comprehensive view of the labor market's dynamics.
Forecast: 7.71 million
Previous: 7.6 million
⚠️ Disclaimer: This information is for educational and informational purposes only and should not be construed as financial advice. Always consult with a professional financial advisor before making investment decisions.⚠️
📌 #trading #stockmarket #economy #news #trendtao #charting #technicalanalysis

Alibaba - This Chart Is Pretty Beautiful!Alibaba ( NYSE:BABA ) is perfectly respecting structure:
Click chart above to see the detailed analysis👆🏻
With a rally of about +80% within a couple of weeks, Alibaba is clearly showing signs of bulls completely taking over. This pressure was not unexpected though after we perfectly witnessed the major trendline breakout a couple of months ago and a retest of the confluence of support.
Levels to watch: $140, $110
Keep your long term vision,
Philip (BasicTrading)

AMAZON Is it worth buying now?Amazon (AMZN) broke below its 1W MA50 (blue trend-line) last week for the first time since the week of August 05 2024 and opened this week below it. As you can see, the stock has been trading within a 2-year Channel Up and today's candle is as close to a technical Higher Low (bottom) as it can get.
The previous Higher Low was in fact that Aug 05 2024 candle, which despite breaking below the 1W MA50, managed to post a strong intra-week recovery and close above the it. Technically that was the 'Max pain' situation on every 1W bottom candle in those 2 years.
Every Bullish Leg that followed was around +65.24%, so that gives us an end-of-year technical Target of $300.
-------------------------------------------------------------------------------
** Please LIKE 👍, FOLLOW ✅, SHARE 🙌 and COMMENT ✍ if you enjoy this idea! Also share your ideas and charts in the comments section below! This is best way to keep it relevant, support us, keep the content here free and allow the idea to reach as many people as possible. **
-------------------------------------------------------------------------------
💸💸💸💸💸💸
👇 👇 👇 👇 👇 👇

Don’t forget: US also faces a government showdown With markets in turmoil, it's easy to overlook the growing risk of a U.S. government shutdown.
A three-week market sell-off intensified today as investors worry that unpredictable policies from the Trump administration are pushing the economy into recession.
The S&P 500 is down 9.1% from its February high, the Nasdaq 14%, and the Russell 2000 18%. A 10% decline is considered a correction.
Bitcoin also dropped below $80,000, while the USD and gold are seeing some weakness.
Meanwhile, Lawmakers have until Friday, March 14, to pass a funding bill. But House Republicans must secure near-unanimous support.
The longest shutdown in history lasted 34 days in 2018 over Trump border wall funding. Now, Democrats again hold key leverage. While Republicans have a House majority, they need Democratic support in the Senate to pass funding. Some see this as a rare chance for Senate Democrats to challenge Trump’s/ Elon Musk’s cuts via the Department of Government Efficiency, though it’s unclear if they will take that risk.

NVIDIA: Megaphone bottomed. Rally to $195 starting.NVIDIA is almost oversold on its 1D technical outlook (RSI = 34.183, MACD = -6.220, ADX = 39.717) as it reach the bottom (LL) trendline of the Megaphone pattern that it has been trading in since November 21st 2024. This is not the first time we see NVDA inside such Megaphone pattern. As a matter of fact, it was during July-October 2023 when it last did so. The 3rd LL was the buy signal and it coincided with a Triple Bottom on the 1D RSI. This is the exact position we are at right now. The stock has completed three lows below the 1D MA50 and looks ready to rebound with force. The smallest recent rally has been +86.41%. The trade is long, TP = 195.00.
## If you like our free content follow our profile to get more daily ideas. ##
## Comments and likes are greatly appreciated. ##

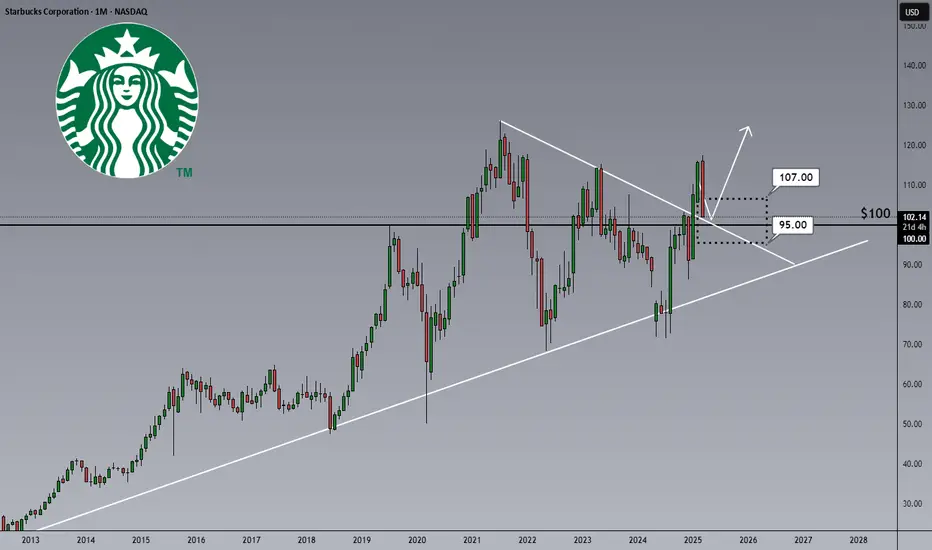
Starbucks Retesting The Breakout Area!Hi,
It has broken out of a three-and-a-half-year downtrend, confirmed with monthly candle closes. Today we are retesting the breakout area with psychological number $100 inside of it.
Cheers,
Vaido
Robinhood’s Moment of Truth! Breakout, Retest, and Go? Hi,
Robinhood is one of the potential candidates to be included in the S&P 500 index. The new grouping will take place in 21. March
From a technical perspective, this is one of the possible zones where, after a short pause, we saw a breakout and now the price has come back to retest the consolidation area.
Of course, fundamentals play a big role here, but historically, a similar setup has worked well last year.
So, the zone is set—let’s see if this move repeats itself. Technically, the key range is $35 - $44.
Cheers,
Vaido

TSLA (Tesla) long set upEntry 1 $255.00
Entry 2 $225.00
Stop loss $200.00
Take profit 1- $275.00
(Close 33%)
Take profit 2- $300.00
(Close 66%)
Take profit 3-$325
(Close 100%)

Weekly $SPY / $SPX Scenarios for March 10–14, 2025 🔮🔮
🌍 Market-Moving News 🌍:
🇨🇳📉 China's Retaliatory Tariffs 📉: In response to U.S. tariffs, China has imposed up to 15% tariffs on U.S. products, including cotton, chicken, corn, and soybeans. This escalation raises concerns about a potential global trade war, which could negatively impact U.S. exporters and broader market sentiment.
🇪🇺💶 European Fiscal Expansion 💶: Germany has announced significant increases in defense and infrastructure spending, marking a shift in fiscal policy. This move may stimulate European economic growth, potentially affecting U.S. markets through interconnected global trade and investment channels.
📊 Key Data Releases 📊:
📅 Wednesday, March 12:
📈 Consumer Price Index (CPI) (8:30 AM ET) 📈:The CPI measures the average change over time in prices paid by urban consumers for a basket of goods and services, serving as a key indicator of inflation.
Forecast: +0.2% month-over-month
Previous: +0.3% month-over-month
📅 Thursday, March 13:
🏭 Producer Price Index (PPI) (8:30 AM ET) 🏭:The PPI reflects the average change over time in selling prices received by domestic producers, offering insights into wholesale inflation trends.
Forecast: +0.1% month-over-month
Previous: +0.2% month-over-month
📅 Friday, March 14:
🛒 University of Michigan Consumer Sentiment Index (10:00 AM ET) 🛒:This index measures consumer confidence regarding personal finances, business conditions, and purchasing power, providing insights into consumer sentiment.
Forecast: 95.0
Previous: 96.4
⚠️ Disclaimer: This information is for educational and informational purposes only and should not be construed as financial advice. Always consult with a professional financial advisor before making investment decisions.⚠️
📌 #trading #stockmarket #economy #news #trendtao #charting #technicalanalysis

US500 Signaling Optimism!Hello TradingView Family / Fellow Traders. This is Richard, also known as theSignalyst.
📈Long-term, US500 has been overall bullish trading within the rising wedge pattern marked in blue.
This month, US500 has been in a correction phase, retesting the lower bound of the wedge.
Moreover, the green zone is a strong structure and previous ATH.
🏹 Thus, the highlighted blue circle is a strong area to look for buy setups as it is the intersection of structure and lower blue trendline acting as a non-horizontal support.
📚 As per my trading style:
As #US500 is hovering around the blue circle zone, I will be looking for bullish reversal setups (like a double bottom pattern, trendline break , and so on...)
📚 Always follow your trading plan regarding entry, risk management, and trade management.
Good luck!
All Strategies Are Good; If Managed Properly!
~Rich
Disclosure: I am part of Trade Nation's Influencer program and receive a monthly fee for using their TradingView charts in my analysis.

MLCF WEEKLY TIME FRAME AND TRADE IDEAMLCF GAVE A BREAKOUT AT THE ACCUMULATION BOX. THE STOCK IS HEADING TO WEEKLY STRONG RESISTANCE AT 50.92
BUT EXPECTED TO BREAKOUT DUE TO THE SENTIMENT AND THE DESECENDING ACCUMULATION JUST BEFORE THE WEEKLY BREAKOUT LOOKS LIKE A CONFIRMATION. LOOKS LIKE THAT
THE BIG PLAYERS HAVE FILLED UP THIER BAGS AND READY FOR THE BREAKOUT
HOWEVER THIS MIGHT BE PLAYED NEXT WEEK OR IN THESE NEXT FEW DAYS
WATCH FOR PRICE ACTION ON H2 AND H4
BREAKOUT AT 50.92 will start a new quick rally however a retest might be possible at the breakout level at 50.92 to 5. The next target will be 58 to 59.
watch for order flows in orderbook. and look for the 5m timeframe above vwap session near breakout

S&P 500 Daily Chart Analysis For Week of March 7, 2025Technical Analysis and Outlook:
In the recent weekly trading session, the S&P 500 successfully retested the Mean Resistance level of 5967; however, it subsequently experienced a significant decline. This decline brought the index back to the Mean Support level of 5860 and further down to the next major Key Support level of 5710. After this downturn, the index established a new critical support level at 5683. It is now positioned to target the Mean Resistance level of 5840. Should the index initiate an upward movement from its current position and successfully surpass this key resistance, it may continue to ascend toward the subsequent Mean Resistance level of 5955.
Conversely, suppose the index experiences a decline from the retested level of 5840. In that case, it will likely target the Mean Support level of 5683, with a further descent to an Outer Index Dip of 5576.

Lockheed Martin... We are moving! Pt.2Just like I drew it up, NYSE:LMT is approaching its Fair Value Gap faster and faster. With the defense spending kept in the public eye, investors seem bullish on Lockheed as reflected from its rise in share price. This rise in price also is reflected from Lockheed's competitors in the industry such as NYSE:NOC , NASDAQ:HON , NYSE:RTX , and other defense contractors such as NYSE:BA , NYSE:HII , and of course $NYSE:GD.
Before we attack the charts, let's review the general sentiment in the arms and defense (or offense) industry. Firstly, we are faced with constant uncertainty in the middle east and eastern Europe. With the conflict between Israel and Palestine, there is no doubt that any flare ups and scares will include U.S. involvement prompting higher revenues for defense industry leaders. As for the eastern European conflict between Russia and Ukraine, what appears to be a ceasefire closing in, there is no doubt that tensions and conflicts will continue through the region which we can expect the defense sector to be involved in. In a simpler sense, as conflict rises, investor interest in the defense sector can be expected to surge.
In the case of peace, we can expect the general indices to rise, but should expect some shedding from the defense industry as their services will be in lower demand . The good news in that scenario is a diversion of a larger scale war (which I'm sure your willing to take a 6% dive on your positions). So, if you are to believe that a peace and/or ceasefire will come of the negotiations, remaining long on this position is just not for you.
As for the current trade itself, I'll first review my main long entry and plans. My first post for this trade was on Feb. 11, 2025. Since then, it has returned an impressive 5.52% (even considering its very low 1y Beta). Even more impressive is the performance of the SP:SPX , TVC:NDQ , TVC:DJI , which have been -4.90%, -6.82%, -3.99% respectively. So in this instance, outperforming the main indices was a literal walk in the park as yours truly spelled the lottery ticket out for you.
And now for the charts....
Here is the NYSE:LMT 1D chart looking back into 2019. We can note the strong trendline, a price action rising towards the 200 EMA, and of course out beloved Fair Value Gap which has yet to see any price action although we are approaching it. As for the good news, the price action approaching two major technical factors which are in the same place at the same time (these being the 200 EMA and our beloved FVG). Ideally, we will hit these two technical targets prior to the next quarterly financial report on April 22.
Hopefully this update helped clear up any uncertainty. This position has been quite participating for anyone who took my trade and I'm glad to see us well into the green especially in times of market turmoil (no matter how minor it is). If you recall, I mentioned that I would be early to this trade (which I was) but I would have no problem with selling into the gain even if it shows no sign of slowing down. The poor man never takes profits.

S&P500 is OVERSOLD!CME_MINI:ES1! NASDAQ:NVDA NASDAQ:AAPL NASDAQ:AMZN NASDAQ:META NASDAQ:MSFT NASDAQ:GOOGL NASDAQ:COIN
BUY OPPORTUNITY on CME_MINI:ES1!
The chart shows a strong bullish setup. A well-defined wave structure is visible along with a key Fibonacci retracement level marking the pullback. A divergence in momentum has been noted, and the price action has bounced off the 52-week EMA, suggesting that buyers are stepping in.
Fundamentally, the outlook remains positive. Recent macroeconomic data points to solid consumer spending and steady industrial production, while bank earnings and statements from major financial institutions have added to market confidence. These positive signals help support the S&P 500’s broader resilience, reinforcing the potential for further gains.
That said, caution is advised. Uncertainties such as shifting monetary policy, potential geopolitical tensions, and any unforeseen changes in economic data could introduce volatility. Traders should consider tight risk management and stop-loss strategies to mitigate downside risks.
Not Financial Advice

TSLA’s Failed Breakout: Reversal or Deeper Drop Ahead?Tesla (TSLA) Market Outlook & Long-Term Investment Report
Tesla (TSLA) has positioned itself as more than just an electric vehicle (EV) manufacturer. With its advancements in robotics, artificial intelligence (AI), autonomous driving, and energy solutions, Tesla is becoming a major player in multiple high-growth industries. While recent price action has shown volatility, long-term investors see buying opportunities at key support levels.
Technical Analysis & Key Levels
1. High-Timeframe Context (HTF)
- HTF Resistance: $415.71 – Tesla attempted to break above this level but faced rejection, leading to a sharp pullback.
- Major Support & Resistance Zone – A critical level where Tesla has previously consolidated and reacted strongly.
- Liquidity Zones (LQZs):
- Daily LQZ (~$238.18) – A key demand area where buyers could step in.
- Weekly LQZ (~$182.44 - $108.01) – A deeper liquidity zone, potentially offering even better long-term buying opportunities if the downtrend continues.
2. Market Structure & Trend Analysis
- **Failed Breakout:** Price action showed a breakout above resistance, but the failure to hold led to a sharp reversal, indicating a potential liquidity grab.
- **Retest of Support:** The price is currently testing a significant support level, which will determine the next move.
- **Momentum Shift:** The aggressive rejection at HTF resistance suggests sellers are in control in the short term, but this creates long-term entry opportunities.
Long-Term Investment Thesis
Tesla's expansion into AI, robotics, and autonomous technology presents significant long-term growth potential beyond its traditional automotive business. Here are the key areas driving Tesla's future:
1. Robotics & Artificial Intelligence
- **Tesla Optimus Robot:** Tesla’s humanoid robot project is expected to revolutionize industrial automation. It could become a major revenue source as industries move toward AI-driven labor solutions.
- **Neural Networks & AI Advancements:** Tesla’s AI systems, used for Full Self-Driving (FSD), are also being adapted for robotics, increasing its competitive edge.
2. Energy & Infrastructure Expansion
- **Solar & Energy Storage:** Tesla’s **Megapack** and **Powerwall** businesses are growing as renewable energy adoption accelerates.
- **Grid-Scale Energy Solutions:** Tesla’s energy division could play a crucial role in stabilizing power grids worldwide, providing another strong revenue stream.
3. Autonomous Vehicles & FSD
- Tesla’s **Full Self-Driving (FSD)** software could create a high-margin subscription-based revenue model.
- The potential for a **Tesla Robotaxi network** could disrupt the ride-sharing industry and unlock new business models.
4. Synergies with SpaceX & AI Computing
- Tesla benefits indirectly from advancements in **SpaceX** technologies, such as materials science and AI computing.
- The **Dojo supercomputer** is being developed to enhance AI training, which could accelerate Tesla’s robotics and self-driving ambitions.
Investment Strategy & Accumulation Plan
For long-term investors, Tesla's volatility provides attractive buying opportunities. A strategic approach would involve:
1. Key Accumulation Levels
- **Daily LQZ (~$238)** – A strong support zone where Tesla could see renewed buying interest.
- **Weekly LQZ (~$182-$108)** – A deeper level that may offer excellent long-term value if the price declines further.
2. Dollar-Cost Averaging (DCA) Strategy
- Instead of trying to time the absolute bottom, investors can **ladder buy-ins** at different liquidity zones to optimize their cost basis.
- This reduces risk and takes advantage of market dips without excessive exposure.
3. Risk Management & Long-Term Horizon
- Tesla is known for its volatility; maintaining **a long-term vision (5+ years)** is crucial for maximizing gains.
- Investors should be prepared for short-term fluctuations while focusing on Tesla’s multi-industry expansion.
Conclusion
Tesla’s failed breakout and recent pullback present a strategic buying opportunity for long-term investors. With its advancements in robotics, AI, energy, and autonomous technology, Tesla is well-positioned to be a key player in multiple trillion-dollar industries over the next decade. The current price action suggests that accumulation at liquidity zones could provide strong long-term returns.
As the robotics industry grows, Tesla’s potential as a leading producer for industrial automation is increasingly clear. Investors with a bullish long-term outlook may find current and upcoming dips as prime entry points.
Final Thought
**Is Tesla’s current dip a gift for long-term believers?** With its expanding technological footprint, this may be an opportunity to accumulate before the next major growth cycle. 🚀

NVIDIA can reach $300 by the end of the year.Crazy as it may sound, NVIDIA / NVDA may recover from the current pull back and hit $300 by the end of the year.
The reason is that the consolidation it has been in for the past 9 months, has been spotted on both previous long term growth Channel Up patterns right before the Channel topped.
As a matter of fact, it was the last year of its bull rally. The previous consolidation phase's bottom was in March 2021 and before that in April 2017.
As we've entered March 2025 with the price sitting right at the bottom of the 2.5 year Channel Up, the probabilities of a final rally increase.
The previous two have been +206% and +217% respectively.
The $300 Target sits right under a potential +206% increase.
Follow us, like the idea and leave a comment below!!
