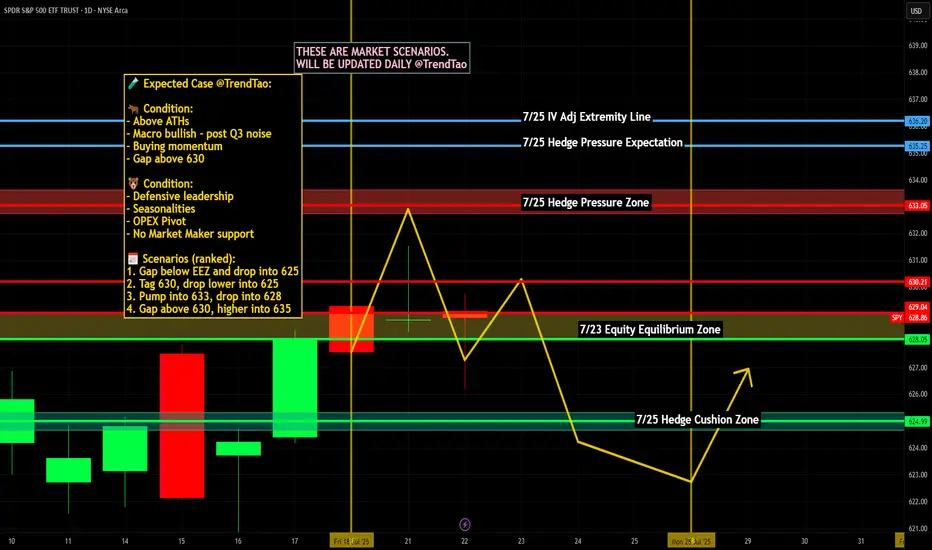
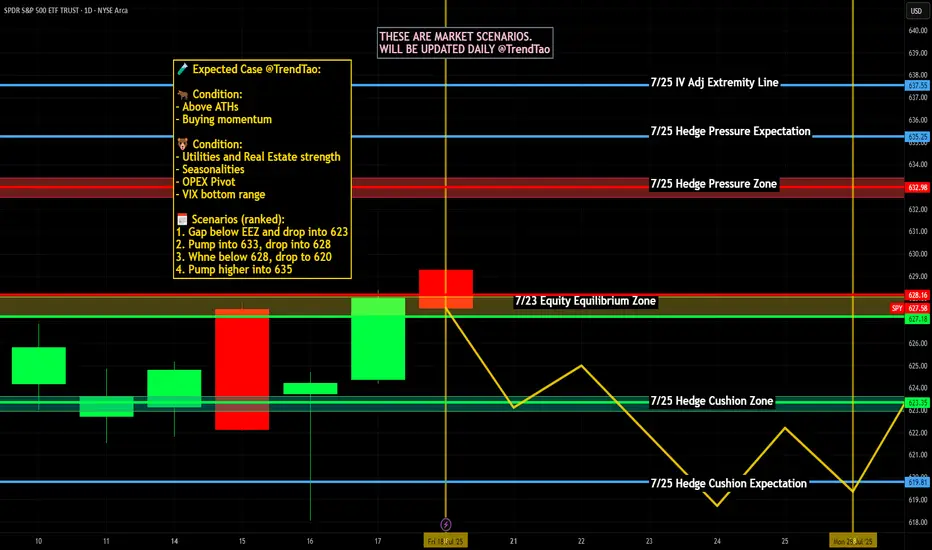
Nightly $SPY / $SPX Scenarios for July 23, 2025🔮 Nightly AMEX:SPY / SP:SPX Scenarios for July 23, 2025 🔮
🌍 Market-Moving News 🌍
📈 Morgan Stanley Stays Bullish
Morgan Stanley reaffirmed its optimistic view, forecasting the S&P 500 will reach 7,200 by mid‑2026. They cited strong earnings and anticipated rate cuts as key drivers, though warned of risks from rising Treasury yields and tariff-related cost pressure
📉 Inflation Debate Reignites
A renewed debate is underway regarding whether tariffs are "transitory" or persistent inflation drivers. Treasury counselor Joseph Lavorgna argued tariff impacts will be one-off, while others caution long-term price pressures may persist, complicating Fed policy directions
🏛️ Calls for Fed Reform Intensify
Treasury Secretary Scott Bessent suggested structural reforms to the Federal Reserve could have greater long-term impact than removing Chair Powell, highlighting ongoing concerns over central-bank governance amid political criticism
💳 Investors Shift to Corporate Bonds
As equity valuations have surged, investors are reallocating toward investment-grade corporate bonds, reducing credit spreads to the tightest levels since 1998—a sign of elevated risk appetite balanced with caution
📊 Key Data Releases & Events 📊
📅 Wednesday, July 23:
(No major U.S. economic releases)
Market focus remains on tech earnings (Tesla, Alphabet) and Fed signals following Tuesday’s Powell address.
⚠️ Disclaimer:
This information is for educational/informational purposes only and does not constitute financial advice. Please consult a licensed financial advisor before making investing decisions.
📌 #trading #stockmarket #economy #tariffs #Fed #earnings #corporatebonds
Stocks
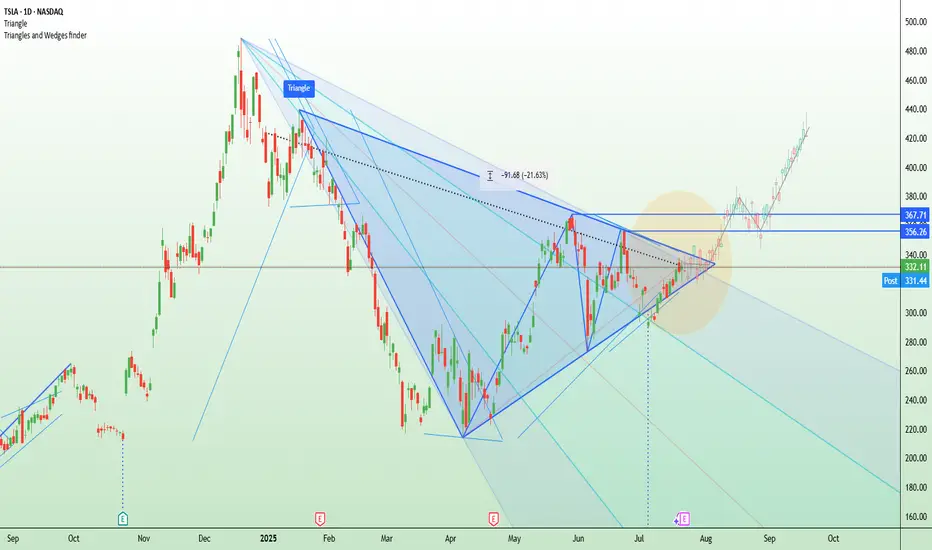
TSLA squeezes into resistance ahead of earnings Tesla is set to report Q2 earnings after the closing bell on Wednesday, covering the quarter ending June 2025.
The stock has been highly volatile this year, amid concerns about tariffs, Elon Musk’s politics (and nazi salutes), and his public clashes with President Donald Trump.
Tesla bulls Wedbush think, “We are at a 'positive crossroads' in the Tesla story,” suggesting that investors will look past the current numbers and focus on Tesla’s long-term AI potential.
Technically, Tesla is now testing a major descending trendline that’s capped every rally since December. The current price action resembles an ascending triangle pattern — a bullish structure — with resistance around $356 and a series of higher lows from May through July. This tightening formation suggests building pressure ahead of the earnings release.
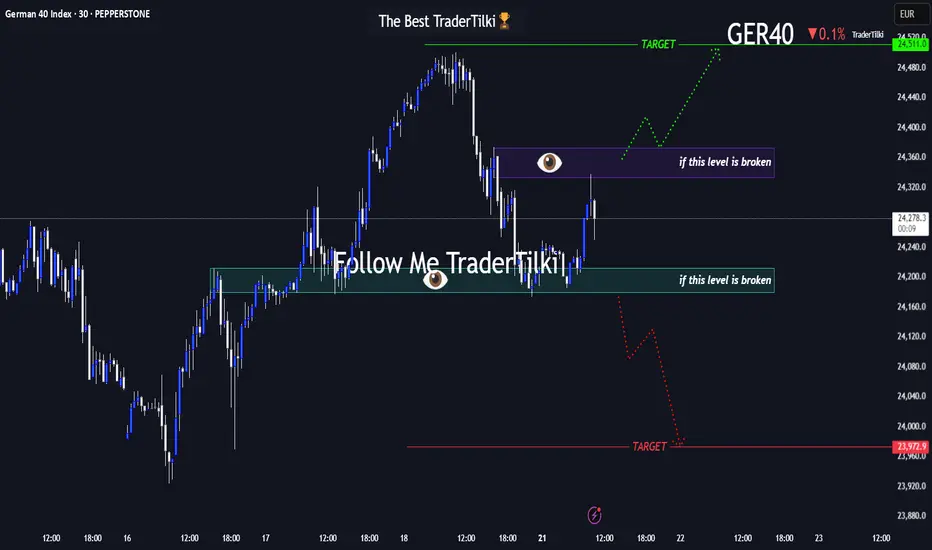
Before GER40 Roars, It WhispersHey guys👋
Here’s the latest GER40 analysis I’ve prepared for you:
🔻 If the **24,179** support level breaks, the next target is **23,972**.
🔺 If the **24,373** resistance level breaks, the next target is **24,511**.
🎯 I’ve shared two key levels with you — please monitor them carefully.
Every like from you gives me a big boost of motivation 🙏
Thanks to everyone who supports my work — truly appreciate it 💙
Nightly $SPY / $SPX Scenarios for July 22, 2025🔮 Nightly AMEX:SPY / SP:SPX Scenarios for July 22, 2025 🔮
🌍 Market-Moving News 🌍
🚀 Tech & EV Stocks in Focus Ahead of Earnings
Futures were quiet ahead of Tuesday’s open, but key movers included Astera Labs (+19%), Alphabet (+2.7%), Netflix +2%, and Robinhood –4.9% after being passed over for the S&P 500. Investors are positioning ahead of major tech and EV earnings this week — including Tesla, Alphabet, Lockheed Martin, Coca‑Cola, and Honeywell
📣 Powell Speech Eyed for Rate Clues
Fed Chair Jerome Powell is set to speak at 8:30 AM ET today at the Integrated Review of the Capital Framework for Large Banks Conference in D.C. Markets will be watching for any indications on future interest rate direction
🌏 Japan’s Political Shift Has Little Market Impact
Japan’s ruling coalition lost its upper-house majority over the weekend, but markets remained stable as it was largely expected. The yen held steady, and Asian equities stayed calm amid the holiday—focus remains on upcoming corporate earnings
📊 Key Data Releases & Events 📊
📅 Tuesday, July 22:
8:30 AM ET – Powell Speech: Key address at the bank regulation conference. Tone and forward guidance may sway bond and equity markets.
After Market Close – Alphabet & Tesla Earnings: Heavyweights due today—market attention will track revenue guidance, especially on advertising, EV demand, and AI.
⚠️ Disclaimer:
For educational and informational purposes only. Not financial advice—consult a licensed advisor before making investment decisions.
📌 #trading #stockmarket #tech #Fed #earnings #AI #infrastructure #volatility
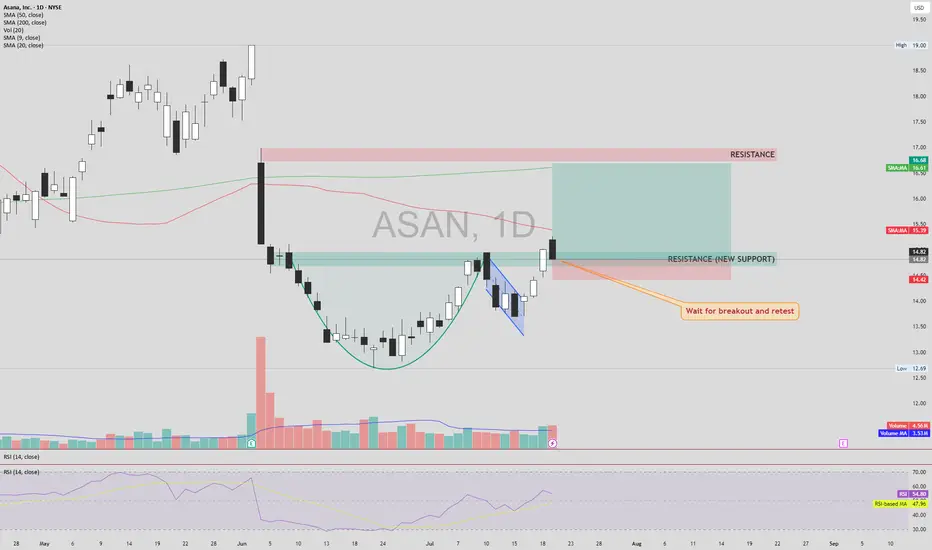
ASAN – Cup & Handle Breakout SetupASAN NYSE:ASAN has formed a classic Cup & Handle pattern and has broken above the neckline, turning previous resistance into new support. However, the price is still trading below both the 50 and 200 SMAs, which calls for cautious confirmation.
📌 Entry: Wait for a confirmed retest of the breakout level (new support) with healthy volume.
🔒 Stop Loss (SL): Just below the newly established support zone, in case of a failed retest.
🎯 Take Profit (TP):
First TP: Next visible resistance zone above.
If this level breaks and holds (confirmed by retest),
Next TP: The large gap overhead could potentially be filled.
This setup provides a strong risk-reward structure if confirmation aligns with volume and momentum. Avoid early entry without retest.
⚠️ DYOR (Do Your Own Research) – This is not financial advice.
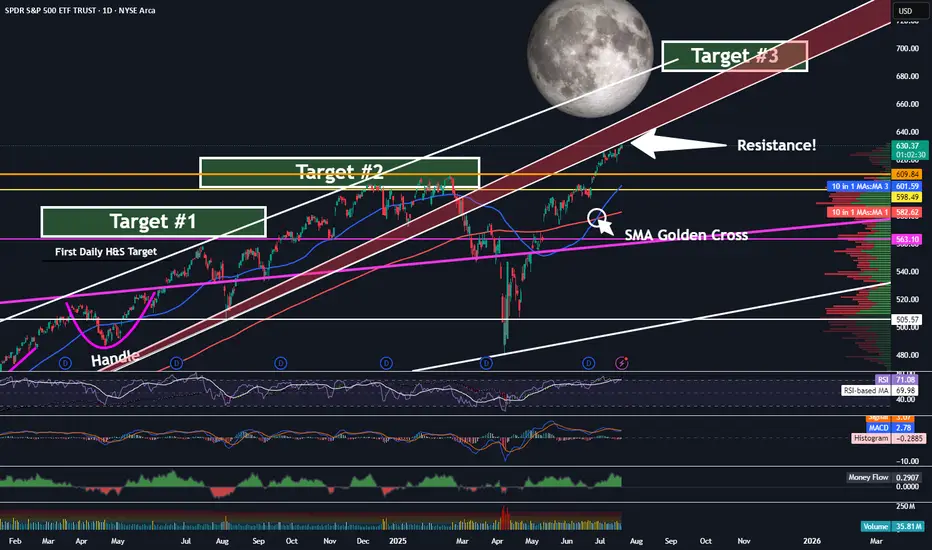
SPY - On Our Way To Target 3 ...But First?Trading Fam,
It's been a while since I updated you all on the SPY, which, as you know, we track closely to help us determine the overall market trend. Since we have now exceeded my Target #2, it's time for me to give you all another update. But first, a little context for my new readers which I have been getting a lot of recently, thanks to my new indicator hitting it out of the park.
So, we began marking targets on our chart here after spotting an inverse H&S on the daily chart a few years ago. Many of my followers back then were doubtful the pattern would fully form, or if it did, that it would actually play out. But the pattern completed about 14 months ago and subsequently broke the neckline in June of last year. I then knew we were going full send and have been predicting a 700 SPY final target since. This target has been made utilizing both that inverse H&S pattern as well as a longer-trend Elliot Wave, which I don't have denoted here at this point. The chart gets too messy with all of my markings. Regardless, we are currently in wave 5 and heading steadily towards that 670-700 target #3, my final target.
But be careful! Today, we have hit the underside of that RED area, which is HUGE resistance. I would expect that we will NOT break straight through this without some pullback prior. Indeed, the market is overextended at this moment, and we'll need the volume to be able to push through. Could this occur? Of course, anything is possible. But, it is not likely right now.
My guess is that we'll at least pull back to one of those levels below us or possibly even re-touch that 200 SMA in red before the final push.
Anyways, it is worth taking note of what may be ahead of us in the next few weeks or months so that you can plan your trades accordingly. Stay with me. We're almost there.
✌️Stew
EURUSD - Parallel channel in play!The following chart offers a closer look at the current structure of the EUR/USD pair on the 4-hour timeframe. Price action has been respecting a well-defined bearish parallel channel, which has provided clear boundaries for both resistance and support. Based on the ongoing reaction to these levels, we outline both bullish and bearish scenarios that could unfold in the coming sessions.
Bearish Parallel Channel
Since June 30, EUR/USD has been consistently moving within a downward-sloping bearish parallel channel. Each attempt to break above the upper boundary of the channel has been rejected, while the lower boundary continues to act as dynamic support. This sustained rejection from the upper trendline confirms the strength of the bearish momentum currently at play. The pair remains structurally weak unless a clean breakout to the upside occurs, accompanied by strong bullish confirmation.
Bullish Scenario
A potential bullish reversal could materialize if EUR/USD manages to hold above the 4-hour Fair Value Gap (FVG) located between 1.1620 and 1.1600. This zone may provide the necessary support for the bulls to step in. If the price maintains strength within or just above this FVG and buyers begin to show dominance, a rebound toward the upper boundary of the channel could occur. A successful breakout above the channel could then trigger a stronger rally, possibly targeting the 1.1750–1.1800 region, marking a clear shift in short-term momentum.
Bearish Scenario
Conversely, if the pair fails to hold the 4-hour FVG between 1.1620 and 1.1600 and closes a strong bearish 4-hour candle below this zone, the market may be setting up for further downside. This would suggest a rejection of the FVG as resistance and open the path for a drop toward the lower end of the channel. Interestingly, this area also aligns with a previously established larger 4-hour FVG. A move into this deeper FVG could present a more favorable zone for a longer-term bullish reversal, as it offers a stronger liquidity pool and potential demand area.
Final Thoughts
The EUR/USD pair is at a critical juncture. Price is hovering near a key support zone within a bearish channel that has defined its movement for several weeks. Whether bulls can hold this support and break above the channel, or bears take control and push it lower toward the broader 4-hour FVG, will determine the next major directional move. Traders should closely monitor price action around the 1.1620–1.1600 level for clues on the likely breakout direction.
--------------------------
Disclosure: I am part of Trade Nation's Influencer program and receive a monthly fee for using their TradingView charts in my analysis.
Thanks for your support. If you enjoyed this analysis, make sure to follow me so you don't miss the next one. And if you found it helpful, feel free to drop a like and leave a comment, I’d love to hear your thoughts!

ABCL: When biotechnology not only curesABCL: When biotechnology not only cures, but also makes your wallet happy!
Hello, fellow investors and those who just like to tickle your nerves on the stock exchange!
Today we have on our agenda (and on the chart) - the stock AbCellera Biologics Inc. (ABCL), which seems to have decided to prove that even at the bottom there is life, and then even throw a party with a breakthrough!
As you can see, our hero ABCL has been playing ‘hide and seek with the trend line’ for a long time, showing an enviable resilience in the fall, just like your sofa after a day at work. However, if you look closely, the ‘ma/ema below price’ signalled that buyers, like secret agents, had already taken control of the situation, preparing for the decisive throw.
And here it is, it's happening! The recent ‘breakout + retest’ is not just a technical term, but a real escape from the ‘bearish’ prison with a subsequent test of strength. Not only did price break through resistance, but it came back to see if it was indeed broken. It's like going out of the house, forgetting your keys, coming back in, getting them, and then going out again - only in the stock market it's a sign of strength and determination!
Now that the dust has settled and the ‘1d’ trendline is behind us, our sights are set on the upside. Targets? Of course! ‘tp1-4.81’ and ‘tp2-6.00’ are not just numbers, they are potential points where we can pat ourselves on the shoulder and say, ‘I told you so!’. А ‘2,618 (6,61)’ - is for the very brave and patient who are willing to wait for the true bull dance.
All in all, ABCL seems to have turned a page in its history, swapping sad ballads for upbeat dance hits. But remember, friends: the market is a capricious thing, and even the most beautiful charts can bring surprises. So, act wisely, don't forget about risks and, of course, enjoy the process! Have a good trading!

NAS100 - Stock Market Awaits Tariffs!The index is trading above the EMA200 and EMA50 on the 1-hour timeframe and is trading in its ascending channel. The target for this move will be the channel ceiling, but if it corrects towards the indicated support area, it is possible to buy Nasdaq with better reward to risk.
In a week once again clouded by trade tariff threats, the stock market reacted cautiously at times. However, what truly captured investors’ attention was growing concern over potential political interference in Federal Reserve policymaking—a development that influenced market sentiment and shifted the focus away from geopolitical tensions.
Despite political headwinds, U.S. economic data continued to show signs of resilience. Investors this week were more focused on corporate earnings and inflation data than on trade war rhetoric or speculation about Jerome Powell’s possible dismissal. While betting markets such as Polymarket raised the odds of Powell being removed to 40%, legally, the president cannot dismiss the Fed Chair without a valid cause—and allegations like “lying to Congress” lack legal standing.
Still, the greater danger lies not in Powell’s dismissal itself but in the potential erosion of the Federal Reserve’s independence—something that could unsettle investors in stocks, bonds, and currencies alike. Analysts expect Trump may soon appoint an ally as an informal or “shadow” Fed Chair, a move that would elevate political risk in financial markets.
Nevertheless, markets are continuing to operate along familiar lines: equities focus on corporate profits, the bond market on inflation and growth, and the currency market on relative returns. For now, the takeaway is clear: Trump is winning—but perhaps only temporarily.
Rick Rieder, Chief Investment Officer at BlackRock, noted that despite trade tensions and inflation concerns, tariffs have had limited impact so far. Following the June CPI report, he pointed out that inflation ticked up slightly—core CPI rose by 0.23% monthly and 2.93% annually, while headline inflation was up 0.29% monthly and 2.67% annually—but the broader trend still reflects easing price pressures.
Rieder attributed this to companies acting preemptively, managing inventory and adjusting supply chains to avoid passing on costs to consumers. He also cited easing wage pressures and a weakening labor market as factors contributing to the decline in inflation.
As such, Rieder believes the Federal Reserve might lower interest rates in September, though a cut in July is less likely, as the central bank would prefer to assess the impact of tariffs first.
According to the Wall Street Journal, Treasury Secretary Scott Besant privately urged Trump not to remove Jerome Powell. Besant warned that such an action could cause unnecessary turbulence in financial markets and the broader economy, and would also face legal and political hurdles. He emphasized that the Fed is already signaling potential rate cuts later this year, and confronting Powell now would be unwarranted.
A source noted that Besant reminded Trump the economy is performing well, and markets have responded positively to administration policies—another reason to avoid drastic moves.
On another front, rising long-term bond yields have become a concern for Besant, as they increase the government’s borrowing costs.He has been working to keep yields in check and believes firing Powell could further escalate them—hence his conversation with Trump aimed at dissuasion.
The coming week will begin with market attention on the European Central Bank’s rate decision, which could set the tone for Eurozone monetary policy in the second half of the year. Meanwhile, a series of key U.S. economic data will be released, providing a clearer view of conditions in employment, production, and housing.
On Tuesday, Jerome Powell will deliver an opening speech at an official event in Washington. While he is unlikely to directly address Trump’s recent verbal attacks, investors will be listening closely for any subtle references to Fed independence or interest rate direction.
On Wednesday, the June existing home sales report will be released, which could indicate whether housing demand remains steady or is weakening.
Thursday will be a packed day on the economic calendar. The ECB’s rate decision will be announced—an event under heavy scrutiny amid Eurozone stagnation. In the U.S., preliminary PMI data from S&P, weekly jobless claims, and new home sales will also be published.
Finally, the week will wrap up on Friday with the release of U.S. durable goods orders—an important gauge of capital investment in the manufacturing sector.

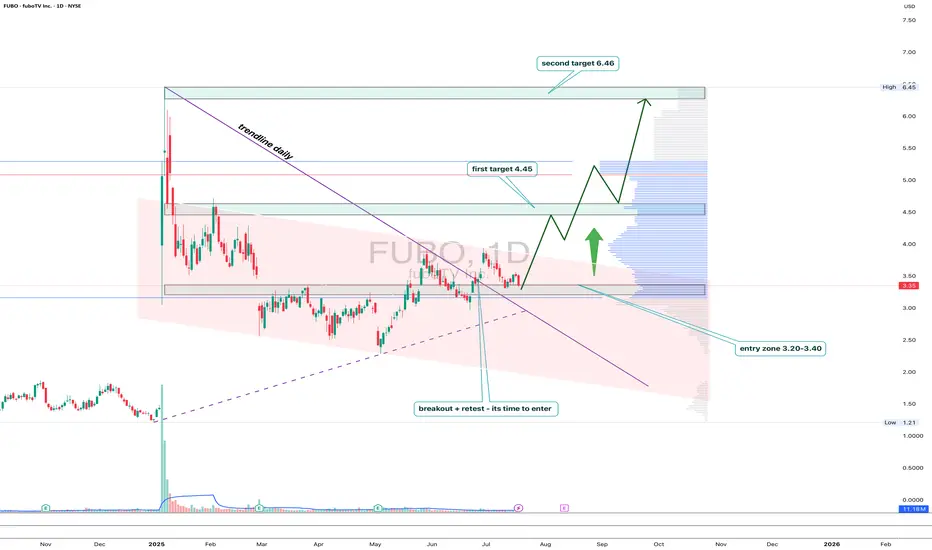
FUBO: trendline breakout with a subscription to $6.46FUBO has broken out of the descending trendline on the daily chart, followed by a clear retest and consolidation above the key 3.20–3.40 area. This zone coincides with the 0.5 Fibonacci retracement and high-volume support, confirming strong buyer interest.
As long as price holds above 3.20, the setup looks bullish with targets at 4.45 (0.382), 5.22, and finally 6.46 — the major resistance and top of the current range. Volume picked up on the breakout, validating accumulation from bigger players.
Fundamentally, FuboTV remains a niche contender in the sports streaming market. With optimized spending and new partnerships with major sports leagues, interest may spike ahead of events like the Olympics and NFL season.
Tactical setup:
— Entry zone: 3.20–3.40
— Must hold: above 3.20
— Targets: 4.45 / 5.22 / 6.46
— Invalidation: break below entry without buyer confirmation
This breakout might just be FUBO’s ticket to prime time.
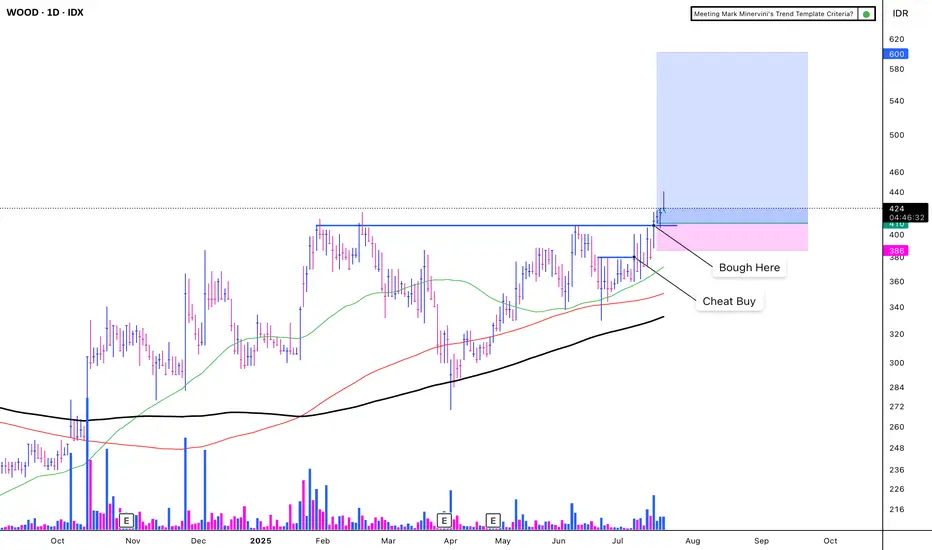
WOOD - CUP WITH HANDLEIDX:WOOD - CUP WITH HANDLE
(+):
1. Low risk entry point
2. Volume dries up.
3. Price has been above the MA 50 for over 10 weeks, with values exceeding 150, 200, and 300.
4. Price is within 25% of its 52-week high.
5. Price is over 30% of its 52-week low.
6. The 200-day MA has been trending upwards for over a month.
7. The RS Rating is above 70 (85).
8. Carbon sales increase 503%
9. Price breakout with VCP criteria
EPS Growth:
a. Quarterly QoQ: -13.24%.
b. Quarterly YoY: +68.81%.
c. TTM YoY: +49.09%.
d. Annual YoY: +33.27%.
(-)
Trump Implements a 32% Increase in Tariffs on Indonesia
The market is volatile due to the ongoing war
DG Trading Setup: Capitalizing on RangeDollar General has experienced a stabilization phase following its Q1 2025 results, with same-store sales increasing 2.4% and revenue growing 5.3% to $10.4 billion. The company has regained traction in the discount retail space, mitigating previous challenges related to shrink and operational inefficiencies.
Institutional Flow & Market Positioning
Recent institutional flow highlights large orders in DG’s 115 call and 110 put, signaling either:
- A range-bound setup, where smart money expects the stock to stay between $110-$115 in the near term.
- Potential volatility, with institutions hedging both directions ahead of an unexpected move.
Considering the ATR (18) and standard deviation (7.353), this aligns with a low-breakout probability, making range-based strategies the optimal play. The absence of earnings between now and July further supports sideways movement expectations.
Options Trade Setup: Iron Condor
To capitalize on premium decay and IV contraction, I’m structuring an iron condor:
- Sell 115 Call / Buy 120 Call
- Sell 110 Put / Buy 105 Put
This strategy ensures limited risk while collecting premium in a high-probability range trade.

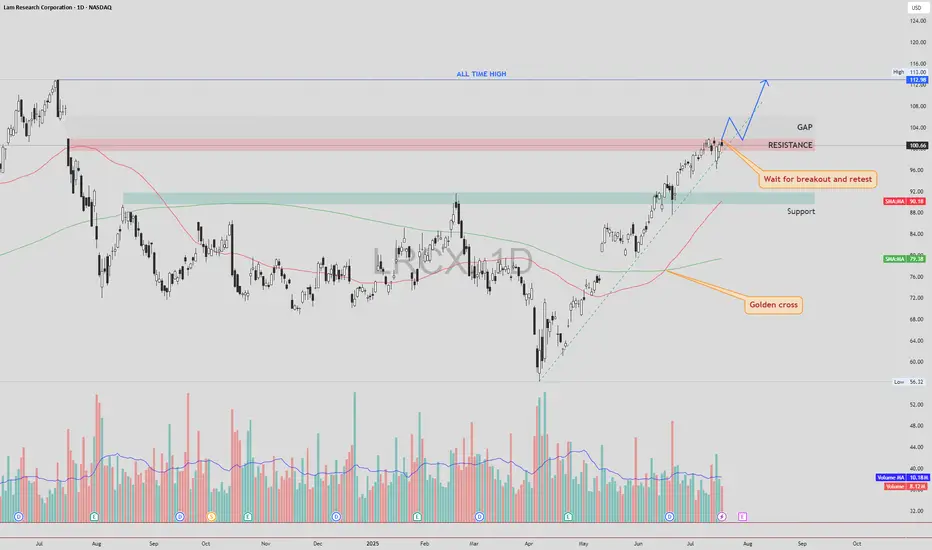
LRCX – Gap Fill First, Then Retest and Potential Move to ATHLRCX NASDAQ:LRCX is currently trading just below a key resistance zone, supported by strong bullish momentum and a confirmed Golden Cross formation.
🔍 Technical Scenario
There is a high probability that price may fill the gap above without retesting the current resistance. After the gap is filled, we could see a pullback to retest the previously untouched resistance zone (now acting as support).
If this retest is successful and holds, the structure may support a continuation move toward the All-Time High (ATH) zone.
📌 Trade Plan
Entry: Avoid chasing the breakout candle. Wait for a gap fill, followed by a clean retest of the broken resistance zone. Enter on confirmation of support holding.
Stop Loss: Place SL just below the retest zone or under the most recent higher low (structure-based stop).
Target 1: Gap fill completion
Target 2 : All-Time High (ATH), if retest confirms
⚠️ Risk Management
The gap-fill rally without retest can be volatile. Patience is key — let the price come back and confirm the breakout zone as new support.
As always, DYOR and manage your position sizing based on your risk profile.
CARR – Bullish Breakout Toward Gap and ATHCarrier Global NYSE:CARR has closed above a key resistance zone near $76.50–$77.00 , indicating a possible breakout setup in progress. This move comes after a Golden Cross , where the 50 SMA crossed above the 200 SMA — a long-term bullish signal.
🔍 Technical Highlights:
✅ Golden Cross: Bullish momentum building.
✅ Breakout level: Price broke above horizontal resistance zone.
🔄 Next step: Wait for a potential retest of the breakout zone.
🔊 High volume on the breakout and retest would increase the strength and reliability of the setup.
🎯 Target Levels:
First Target (TP1): ~$80.00 — near the top of the existing gap.
Second Target (TP2): ~$83.32 — the current All-Time High (ATH).
🛡 Trade Plan:
Entry idea: After a clean retest of the breakout level with supportive volume.
Stop-loss: Below the retest zone or under 50 SMA (~$72-74 area).
Invalidation: If price falls back below resistance on high volume.
Conclusion:
CARR shows a strong breakout setup after a Golden Cross. A confirmed retest with volume could open the door toward the gap fill and new all-time highs.
DYOR – This is not financial advice.

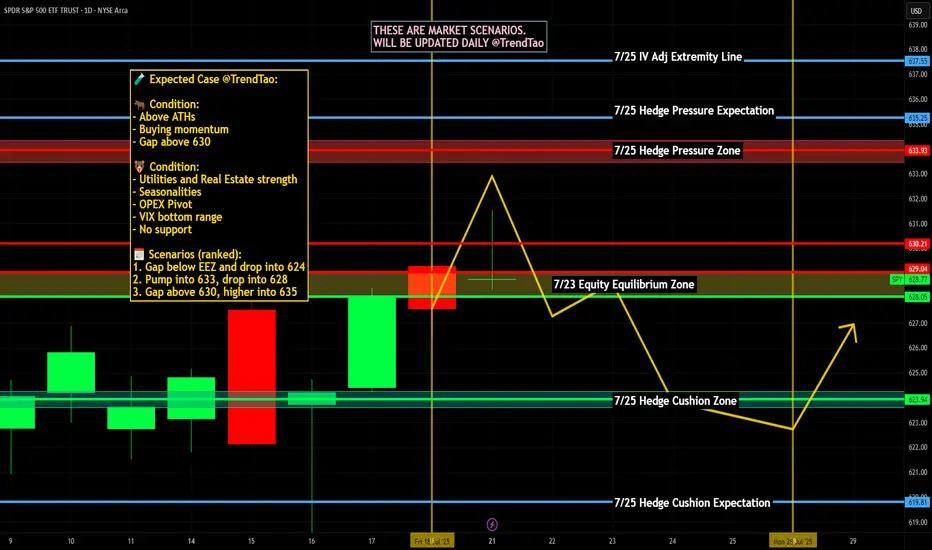
Weekly $SPY / $SPX Scenarios for July 21–25, 2025🔮 Weekly AMEX:SPY / SP:SPX Scenarios for July 21–25, 2025 🔮
🌍 Market-Moving News 🌍
🏦 Fed Chair Powell Speaks — Markets Key Into Tone
Federal Reserve Chair Jay Powell’s Jackson Hole speech is the week’s centerpiece. Markets will be closely listening for clues on inflation strategy, rate-cut timing, and sensitivity to geopolitical inflation drivers like tariffs.
📦 Tariff Deadlines Gain Spotlight
Multiple tariff deadlines are set this week for targeted trade partners including the EU, Mexico, Canada, Japan, South Korea, and Thailand. Any new announcements or extensions could trigger volatility in trade-exposed sectors.
🛢️ Oil Market Mixed Signals
Brent crude prices have stabilized near mid-$70s, but OPEC+ discussions regarding supply extensions and global growth concerns continue to inject uncertainty into energy-linked equities.
📈 Big Tech Earnings Kick Off
The “Magnificent Seven” tech giants begin reporting: Nvidia leads on Tuesday, followed by Microsoft, Amazon, Alphabet, and Meta later in the week. Expect significant sentiment swings based on forward commentary.
📊 Key Data Releases & Events 📊
📅 Monday, July 21
Quiet session ahead of a packed week of speeches and data.
📅 Tuesday, July 22
8:30 AM ET – Existing Home Sales (June):
Measures signed contracts on previously owned homes—a key housing indicator.
After Market Close – Nvidia Q2 Earnings:
Market will watch guidance and China commentary.
📅 Wednesday, July 23
8:30 AM ET – Leading Economic Indicators (June):
An early gauge of U.S. economic momentum.
📅 Thursday, July 24
8:30 AM ET – Initial & Continuing Jobless Claims:
Labor-market health indicator.
📅 Friday, July 25
8:30 AM ET – Durable Goods Orders (June):
Signals demand for long-lasting goods, often driven by business spending.
8:30 AM ET – New Home Sales (June):
Follows existing home data for housing sector insight.
4:00 PM ET – Fed Chair Powell Speech at Jackson Hole:
Expect commentary on inflation, growth, and rate-path clarity.
⚠️ Disclaimer:
This content is for educational and informational purposes only and should not be construed as financial advice. Consult a licensed financial advisor before making investment decisions.
📌 #trading #stockmarket #economy #Fed #earnings #housing #durablegoods #JacksonHole #technicalanalysis
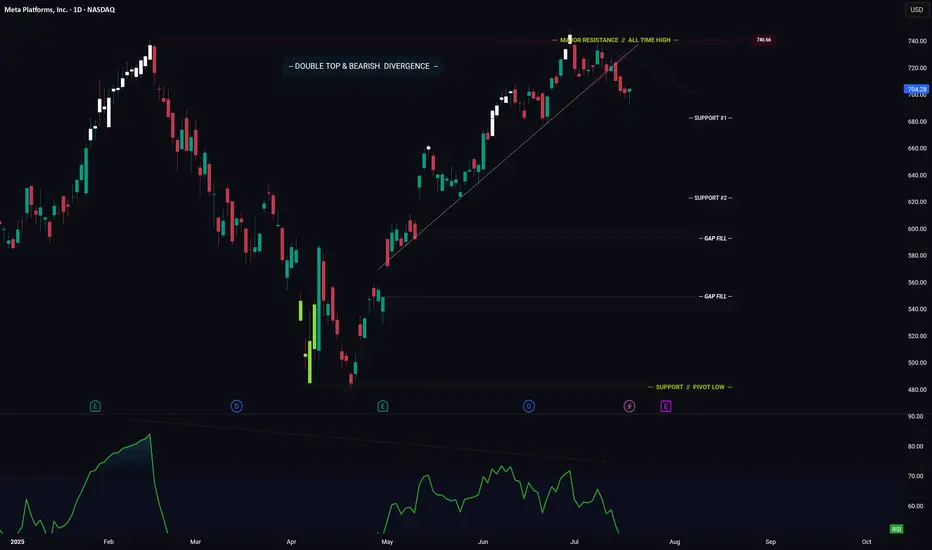
META -- Breakdown? Or Move Higher? Levels To Watch ForHello Traders!
Meta has broken down from its ascending trendline. This is bearish.
In addition price has formed a major Double Top pattern with Bearish Divergence.
Bearish Factors
1) Breakdown of ascending trendline
2) Double top
3) Bearish divergence
Two things need to happen if META is going to make a move higher...
1) Price needs to stay above "Support #1"
2) Price needs to break above the descending trendline (connecting the range highs)
IF price does breaks lower... where do we start looking for long positions?
- Support #2 is a great starting point, however if price makes it to support #2, then I could also see price trading down to fill the gap just below.
- This is where you could enter again to average down your position.
Thanks everyone and best of luck on your trading journey!
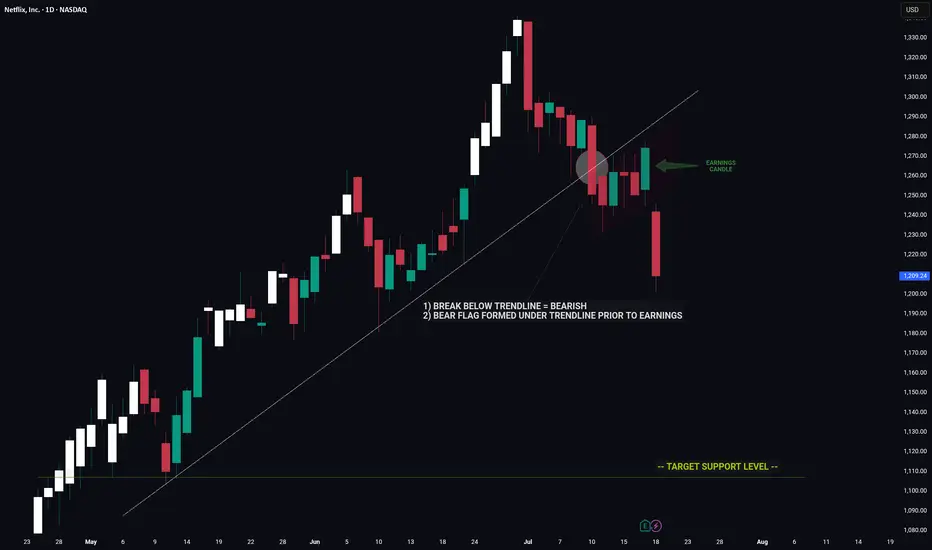
NETFLIX -- Price Signaled A Move Lower Prior To EarningsHello Traders!
The chart of NFLX is a great example of using clues to decipher a future move.
Prior to earnings we had major bearish indicators on the chart that hinted towards a move down on earnings.
1) Break below major trendline
2) Bear flag
These two signals by themselves are very bearish however the fact that these signals appeared coming into earnings was an even strong indicator of a potential for negative move.
Now that the upward trend is broken NFLX has a long way to fall before reaching the next key support level.
Thanks everyone and best of luck on your trading journey!
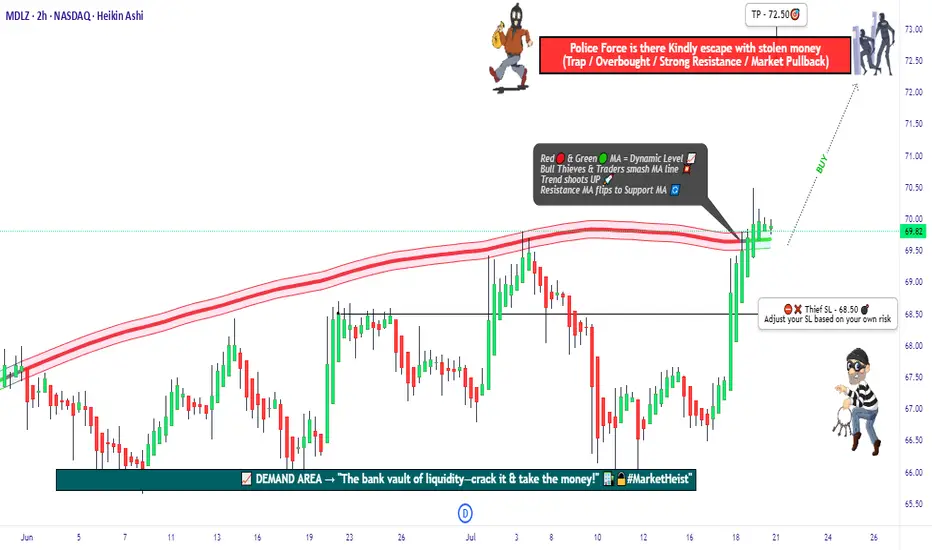
"MDLZ Heist LIVE! Quick Profit Grab Before Reversal!"🚨 MONDELEZ HEIST ALERT: Bullish Loot Zone! (Swing/Day Trade Plan) 🚨
Thief Trading Strategy | High-Risk, High-Reward Play
🌟 Greetings, Market Pirates! 🌟
Hola! Oi! Bonjour! Hallo! Marhaba!
To all Money Makers & Strategic Robbers 🤑💸—this is your blueprint to plunder "MONDELEZ INTERNATIONAL, INC" with precision.
🔎 THIEF TRADING ANALYSIS (Technical + Fundamental)
The Vault is Open! Bullish momentum detected, but caution—this is a high-risk police barricade zone (resistance level).
Overbought? Consolidation? Reversal? Yes. Bears lurk here, but we’re stealing profits before the trap snaps.
🎯 Target: 72.50 (or escape earlier if momentum fades).
🚨 Scalpers: Long-only! Use trailing stops to protect gains.
📈 ENTRY: How to Swipe the Loot
"Buy the Dip" Strategy: Optimal entries on pullbacks (15m/30m timeframe).
DCA/Layering Tactics: Spread limit orders for better risk control.
Aggressive Robbers: Enter now. Patient Thieves: Wait for retests.
🛑 STOP LOSS: Survival Rules
SL at 68.50 (nearest swing low wick on 2H chart).
Adjust based on risk/lot size—protect your capital!
⚡ CRITICAL ALERTS
📰 News Volatility: Avoid new trades during major releases. Lock profits with trailing stops!
📊 Fundamental Drivers: Check COT reports, macro trends, and sector sentiment Klick the 🔗.
⚠️ Reminder: This is NOT financial advice. DYOR and manage risk!
💥 BOOST THE HEIST!
Like 👍 + Boost 🔄 to fuel our next market robbery plan. Together, we trade smarter, steal bigger, and profit faster!
🚀 Stay tuned—more heists coming soon! 🤑🔥
A BUY at $200?If this stock falls to $200, it's a great buy for the risk. Even a pullback to $300 would be a great return.

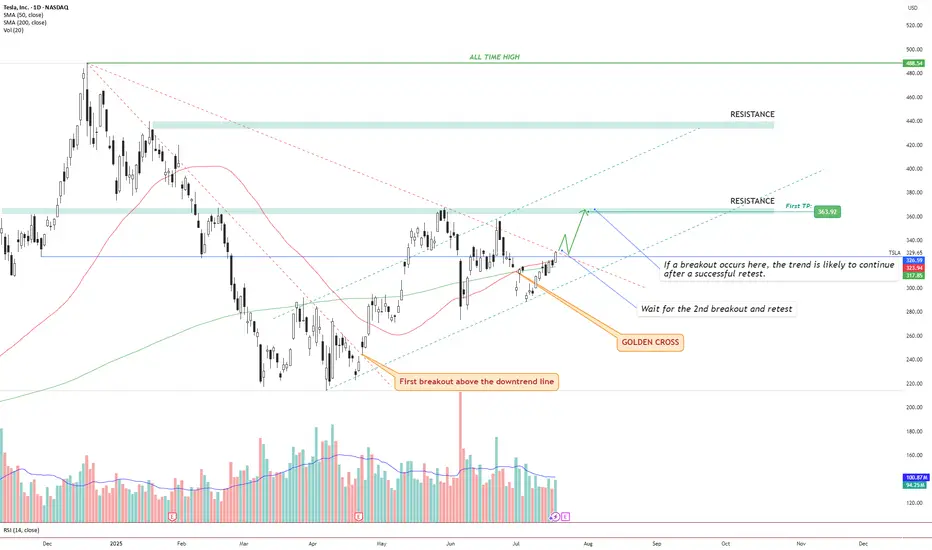
TSLA – Golden Cross + Dual Breakout Structure Targeting $363 andIdea Text:
Tesla NASDAQ:TSLA has recently printed a powerful Golden Cross , where the 50 SMA has crossed above the 200 SMA — signaling a potential long-term bullish shift in trend.
But price action shows more:
We’re observing a dual-breakout structure, where the first breakout above the long-term downtrend line has already occurred (see orange label), and the price is now approaching a critical horizontal resistance zone.
Let’s break it down step-by-step:
🔸 Step 1: Golden Cross
The 50 SMA crossed above 200 SMA — a classic signal for trend reversal. This often attracts institutional interest, especially if followed by breakout confirmation.
🔸 Step 2: First Breakout (Already Confirmed)
Price broke above the descending trendline, retested it, and maintained higher structure. This breakout initiated a shift in market sentiment from bearish to neutral-bullish.
🔸 Step 3: Second Breakout (Setup Forming)
Price is now testing horizontal resistance around $330–$335 zone. This zone also coincides with dynamic resistance from prior failed swing attempts. A successful breakout above this level, followed by a clean retest, can serve as confirmation for a bullish continuation.
🔸 Step 4: Target Setting
🎯 First TP is set at $363.92, a well-defined resistance level. If the breakout holds, next potential targets may develop around key zones such as $395 and $440, depending on price strength and continuation.
🔸 Risk Management
✅ Ideal entry after retest of breakout above ~$335.
❌ Stop-loss below the breakout level or below 50 SMA (~$315 area), depending on entry style.
🔄 Monitor volume: breakout without volume = weak move.
Conclusion:
We are watching a classic price action + moving average confluence setup. Golden Cross, breakout + retest structure, clean resistance level, and defined targets all align.
This setup is valid only with confirmation. No breakout = no trade.
⚠️ Not financial advice. DYOR.
VZ: Verizon Earnings tomorrowwith 6% dividend yield and stock price at support level on the lower channel band, this draw attention to the earnings report tomorrow pre-market hours. Focused on future outlook as well.
If all good, I will buy VZ.
Disclaimer: This content is NOT a financial advise, it is for educational purpose only.

PEP: PepsiCo Earnings resultsIts looks like PEP is a buy now. Just want to double check on future sales growth as it is stable for a while. Lower stock price made the dividend very attractive since PEP is a defensive stock.
Disclaimer: This content is NOT a financial advise, it is for educational purpose only.

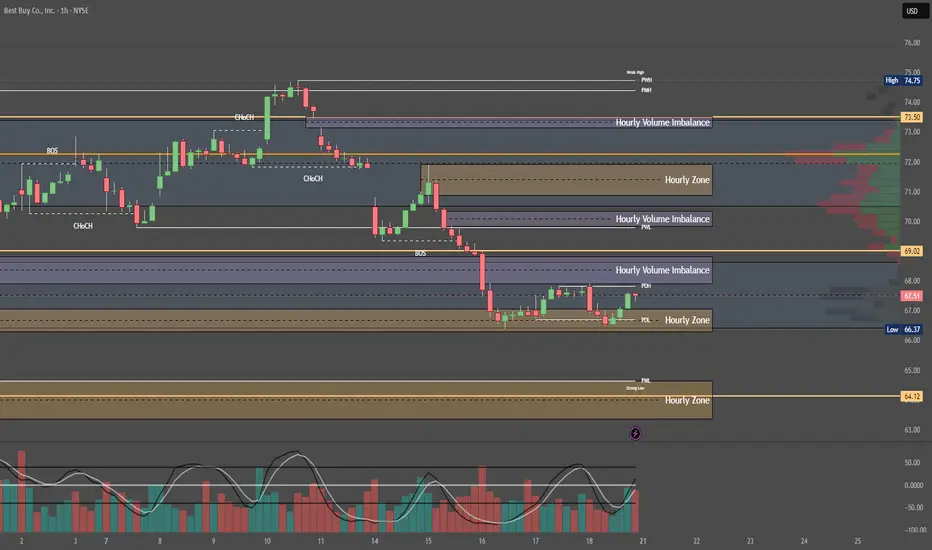
Quantum's BBY Outlook 7/20/25🚀 G.O.D. Flow (Gamma, Orderflow, Dealer Positioning)
1. 🧩 Summary Overview
Ticker: BBY
Current Price: $67.50
Flow Setup Date: Current Session
Trade Type: Intraday / 0–2 Day Swing
2. 🔬 Flow Breakdown
🔵 GEX (Gamma Exposure):
Highest -GEX at 70 → potential volatility pocket and resistance zone.
Despite matching +GEX at 70, net gamma is negative — bearish skew.
Additional +GEX at 72 & 73, but overwhelmed by -GEX at 68 and 67.
🔺 Overall gamma environment favors chop and downside unless 70 is reclaimed.
🟡 DEX (Delta Exposure):
Mirrors GEX layout.
Dealer short delta bias = likely selling into strength.
Reclaim of 70+ may signal a squeeze, but not favored without sweep confirmation.
🟣 Vanna:
Strong -Vanna clusters from 70 to 77: if IV rises, dealers sell into strength.
⚠️ This limits bullish continuation unless IV drops drastically.
Minor +Vanna at 60 = support base on deep dip (liquidity pocket if flushed hard).
🔴 Charm:
Extreme -Charm peak at 70 = time decay creates headwind at this level.
Additional -Charm pressure at 72, 73, and 77.
Minor +Charm at 60 suggests dealer support only comes much lower.
⚪ Volatility:
Neutral past week.
If vol spikes, expect dealer selling pressure to intensify under this skew.
🟢 Open Interest:
Heavy put OI at 70 = possible support IF price breaks hard.
Calls OI lighter at 72 and 73, meaning less resistance absorption if price does push up.
3. 📊 Chart Structure Setup
Price: $67.50, sitting below key gamma and charm cluster at 70.
Chart bias: Bearish unless strong reclaim of 70.
Key flush zones: 68 → 67 → 65
Confirmed supply above 70 due to clustered charm/vanna.
4. 🎯 Trade Plan
🟥 Bias: Bearish unless 70 is reclaimed and held with size.
🛠 Entry Triggers:
Rejection of 69.50–70 zone → PUT
Break and retest of 67 → PUT
📦 Contract Picks (0–5 DTE):
67p, 65p, 60p
🛑 Risk Stop:
Breakout and hold above 70.50 with size = exit or flip long bias intraday
🎯 Targets:
Target 1: 66.00 (Gamma flush)
Target 2: 63.00 (next +Charm liquidity zone)