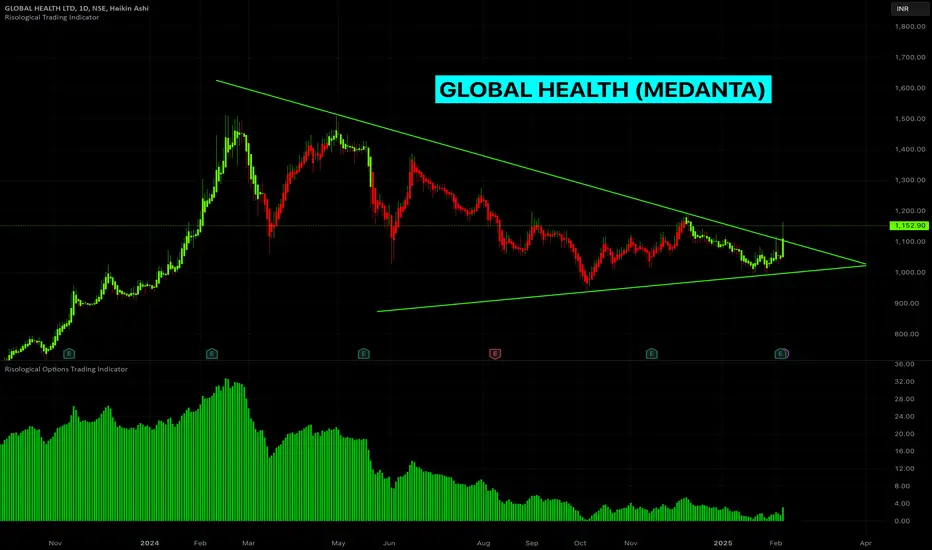
GLOBAL HEALTH LTD - Symmetrical Triangle BreakoutThis is still an open candle and need to wait till this candle closes in GREEN on Friday end of the day. If the candle is green and is clearly breaking out from the triangle on Friday, it is a Bullish sign.
On the daily time frame, the daily candle has closed in GREEN, which is a good sign.
The Risological indicators confirm the bullish movement as seen below.
ENTRY:
The stock can be purchased on the daily time frame as the Risological indicators gave the confirmation
EXIT:
Hold the BUY position till the Risological indicator gives a reversal
Exit on first RED candle close on the daily time frame.
OR, Exit if the Risological options trading indicator turns into RED.
Hope this helps!
Cheers!
__All info = educational only__
Stockstobuy
BABA its time to go Long!Alibaba Group Holding Limited (BABA) Cloud Integrates DeepSeek AI Models, Enabling No-Code AI Deployment (Yahoo.com)
In terms of technical analysis, we have 3 confirmations that give us a good signal to entry for go Long!

Innotek: the company stay optimistic abt its long-term prospectsInnoTek
InnoTek, trading at \$0.43, has been navigating a transformative journey since selling its core disk-drive components business over 15 years ago. The precision components manufacturer pivoted to grow its small stamping business and has since diversified into promising sectors such as electric vehicles (EVs) and graphics processing unit (GPU) servers, which are riding the artificial intelligence (AI) wave. These efforts are now bearing fruit, with revenue for the first half of 2024 rising 30.9% year-on-year to S\$121.6 million.
The diversification strategy has been driven by growth in GPU server-related projects for AI applications, which now account for about 27% of InnoTek’s revenue, up from 14% a year earlier. The automotive segment remains its largest contributor, accounting for 33% of revenue, bolstered by the strong EV market in China. Other segments, including office automation, TVs and displays, also contribute significantly to its topline.
However, profitability has taken a hit, with net profit for H1 2024 slipping 8.3% to S\$3.2 million. This was attributed to extraordinary costs linked to shifting business strategies and geopolitical tensions driving the “China+1” manufacturing strategy. InnoTek has been strategically expanding its footprint in ASEAN countries, with facilities in Thailand and Vietnam, and plans to further invest in Malaysia due to its favorable infrastructure and skilled workforce.
Despite short-term challenges, the company remains optimistic about its long-term prospects. With a market capitalization of \$100 million, InnoTek trades at 0.6x its book value of 76 cents. Its strong balance sheet, featuring net cash of \$56 million, supports a sustainable dividend payout of 2 cents per share, translating to a yield of 4.6%. Analysts recommend an “Accumulate on Weakness” strategy, citing the company’s strong positioning for longer-term growth.

Meta's Q3 Financial Results | Growth and the Future of AI & AR Meta's Q3 Earnings: AI Investments Shape the Future of Engagement and Monetization
Last week, Meta shared its Q3 earnings, revealing a familiar trend: while the results were strong, rising AI investments cast a shadow. With over 3.2 billion daily users across Meta’s apps, the company alongside Google and YouTube is in a prime position to bring AI into the mainstream. However, this shift could potentially disrupt the creator economy as we know it
So, how will this affect the future of Meta’s apps?
Did you know META is 222% up since our first analysis ?
Let’s break down the quarter and explore the latest updates
Today’s Highlights
- Overview of Meta Q3 FY24
- Recent business highlights
- Key quotes from the earnings call
- The potential decline of the creator economy
1. Meta Q3 FY24 Overview
Meta operates within two main segments
FoA: Family of Apps (Facebook, Instagram, Messenger, and WhatsApp)
RL: Reality Labs (virtual reality hardware and software)
Daily Active People in FoA grew by 5% year over year, reaching 3.29 billion. However, user growth has slowed, with Meta adding 20 million daily users in Q3 2024 down from 50 million earlier in 2024.
Meta’s reach now extends to over half of the global population aged 15 to 80, meaning future growth will hinge more on engagement and ad efficiency than adding new users.
Key Insights from Zuckerberg:
-Facebook: Positive engagement trends among Gen Z in the U.S.
-Instagram: Sustains “strong” growth globally.
-WhatsApp: Now surpasses 2 billion calls daily.
-Meta AI: 500 million monthly active users.
-Threads: 275 million monthly active users, up from 200 million in Q2, with notable growth in regions like the U.S., Taiwan, and Japan (currently not monetized and unlikely to drive significant revenue by 2025).
Advertising Performance:
- Ad impressions grew 7% year-over-year (compared to 10% in Q2).
- Average ad price increased by 11% year-over-year (10% in Q2).
- Average revenue per user grew by 12% year-over-year, reaching $12.29 (compared to Snap at $3.10 and Reddit at $3.58).
- Despite some critics suggesting potential inflation due to bot activity, ARPU growth points to real ad value; fake users can’t generate revenue.
Financials
- Revenue rose 19% year-over-year to $40.6 billion.
- FoA saw a 19% increase, reaching $40.3 billion.
- RL grew by 29% to $0.3 billion.
- Gross margin was 82% (-1pp Y/Y, +1pp Q/Q).
- Operating margin stood at 43% (+2pp Y/Y, +5pp Q/Q).
- FoA operating profit was $21.8 billion (54% margin, +2pp Y/Y).
- RL reported an operating loss of $4.4 billion (down slightly from $4.5 billion in Q2).
- EPS rose by 37% year-over-year to $6.03.
Cash Flow
- Operating cash flow was $24.7 billion (61% margin, +1pp Y/Y).
- Free cash flow was $15.5 billion (38% margin, -2pp Y/Y).
Balance Sheet
- Cash and marketable securities totaled $71 billion
- Long-term debt was $29 billion
Guidance:
- Q4 FY24 revenue is forecasted at $46.5 billion in the mid-range
- FY24 expenses estimated at $96-$98 billion (previously $96-$99 billion)
- FY24 Capex is expected to be $38-40 billion (previously $37-$40 billion)
Summary Analysis
Revenue growth was 20% in constant currency (compared to 23% in Q2), with ad revenue growth driven by increased ad prices. Strong demand for ads continued, largely due to higher ad performance, especially in online commerce, healthcare, and entertainment. Geographically, North America and Europe led growth at 21%, while Asia slowed from 28% to 15%.
Reality Labs’ revenue rose 29%, mainly from hardware sales, though the division continues to post significant losses. As shown in the visuals, FoA operating profit reached an all-time high, while RL’s losses remain around $4 billion quarterly.
Headcount increased by 9% year-over-year to 72,404, signaling a return to hiring, particularly in priority areas such as monetization, infrastructure, Reality Labs, and generative AI.
Stock buybacks amounted to nearly $9 billion in Q3, up from $6 billion in Q2, though lower than the $15 billion in Q1. Management’s confidence in Meta’s stock remains strong, with an additional $1.3 billion paid in dividends.
Capital expenditures climbed by 36% to $9.2 billion compared to $8.5 billion in Q2, with guidance staying on track. Management anticipates “significant acceleration in infrastructure expenses” for 2025, which will affect both the cost of revenue and R&D expenses.
Despite heavy AI spending, Meta remains highly profitable, generating nearly $52 billion in free cash flow over the past 12 months—just shy of Alphabet’s $56 billion over the same period.
Q4 FY24 revenue guidance points to deceleration, with mid-range growth forecasted at 16%.
Let’s examine Meta’s investments and market position further.
2. Recent Business Highlights
Meta Orion
Meta's Orion AR glasses mark an ambitious step towards a future beyond smartphones, showcasing the potential of augmented reality (AR):
-Prototype Status: Orion is a high-tech AR prototype, equipped with advanced features, but high production costs keep it out of reach for consumers.
-Advanced AR Display: Using Micro LED projectors and silicon carbide lenses, Orion offers a broad field of view with sharper visuals than most current AR devices.
-Interactive AI Integration: With Meta's generative AI, Orion enables users to interact with virtual elements, identify real-world objects, and create immediate solutions, such as recipes.
-Complex Hardware: Orion relies on a neural wristband for control and a wireless compute puck, creating a multi-part system.
-High Cost & Limited Production: With a price tag estimated at $10,000, Orion isn’t ready for mass production. Meta has produced around 1,000 units for demonstrations and internal testing.
- Future Vision: Meta aims to release a consumer-friendly AR device within a few years, working toward a slimmer, more affordable model that could rival smartphone prices.
Orion reflects Meta's goal to lead the next wave of computing, though significant technological and cost hurdles remain.
Timing and Competitive Landscape**: Zuckerberg’s reveal of Orion may aim to justify Reality Labs' annual $16-20 billion operating loss to shareholders and gather feedback. Meanwhile, Apple has initiated its “Atlas” project to explore the smart glasses market, indicating potential plans to shift focus from the high-end $3,500 Vision Pro VR headset.
How AI Is Already Impacting Meta
Beyond future-oriented projects like Orion, Meta’s AI advancements are actively enhancing its core business in two strategic areas: engagement and monetization.
-Engagement: Meta's recommendation engine uses AI to tailor feeds with highly relevant video content, keeping users engaged. AI-driven prediction systems further increase app usage by showing content that maximizes interaction.
-Monetization: AI boosts ad efficiency across the entire lifecycle—from creation to performance tracking. Generative AI assists with ad copy, images, and video, while advanced models analyze user behavior to serve targeted ads, improving conversion rates incrementally.
-Meta AI Studio: This platform allows developers to create, train, and deploy custom AI models within Meta’s ecosystem. By enabling personalized assistants, interactive AI, and AR applications, Meta seeks to drive new consumer apps and maximize ad potential across its platforms.
Market Share
Meta’s advertising revenue hit $39.9 billion in Q3, reaching 81% of Google’s search revenue, up from 76% last year. Meta’s ad revenue is expanding at the same rate as Amazon’s, despite Meta’s larger base, signaling regained market share and effective adaptation to the post-ATT environment.
3. Key Quotes from the Earnings Call
CEO Mark Zuckerberg
- On AI and the Family of Apps: “Improvements to our AI-driven feed and video recommendations have led to an 8% increase in time spent on Facebook and a 6% increase on Instagram this year alone. More than a million advertisers used our GenAI tools to create over 15 million ads last month, and we estimate businesses using Image Generation are seeing a 7% conversion lift.”
-On Llama 4: “We're training the Llama 4 models on a cluster larger than 100,000 H100s, more extensive than anything reported elsewhere.”
-On RayBan Meta Glasses: “Glasses are the ideal AI form factor as they let your AI see, hear, and communicate with you. Demand remains strong, with the new clear edition selling out quickly.”
-On Meta AI: “We’re on track for Meta AI to become the world’s most used AI assistant by year-end, with popular uses including information gathering, task assistance, and content exploration.”
CFO Susan Li
-On Recommendations: “Inspired by scaling laws observed in large language models, we’ve developed new ranking architectures for Facebook video that enhance relevance and increase watch time”
-On Capital Allocation: “We’re optimistic about our opportunities and believe that investing now in infrastructure and talent will accelerate progress and returns.”
4. The Potential Decline of the Creator Economy
Facebook and Instagram have evolved from social networks to content networks, benefiting creators with wide-reaching platforms. However, this era may be coming to a close.
-AI-Generated Content: Zuckerberg shared plans to introduce AI-generated and AI-summarized content on Facebook, Instagram, and potentially Threads, gradually shifting away from creator-generated content as the primary engagement driver.
-Impact on Creators: As AI learns to identify and generate engaging content, creators could struggle to compete, with algorithms delivering exactly what audiences want. Over time, creators may face a landscape where AI determines the most engaging posts, relegating them to the sidelines in a world increasingly powered by self-generating content.
-Why It Matters: Platforms like YouTube share 55% of ad revenue with creators, but Meta does not, meaning that an AI-driven shift isn’t primarily about cost-cutting. Instead, it allows for more integrated ad placements within algorithmic feeds, potentially boosting impressions and conversions.
Although AI generated feeds may sound dystopian, current high engagement accounts already use tactics to maximize engagement, meaning the shift to AI might go largely unnoticed by audiences.

NVDA Technical analysis and my view on the stockIn my opinion, NVDA is still robust and is establishing a low on the 200 MA.In spite of the current dispute with Deepseek, NVDA remains a robust stock and business.
Currect support $120 + 200 EMA.

PFE looking higher with +10% profit potential PFE has finished strong correction and is finding a bottom near $25.
I anticipate that within the next three months, the stock, which I purchased at $26.5, will reach $30.
Blue line entry
Red stop
Green lines are target.

Supply and Demand Trading Made Simple With Astrazeneca StockIn the ever-evolving world of stock trading, where news headlines can shift markets in a heartbeat, savvy investors often turn to the age-old principles of supply and demand to find clarity. Enter AstraZeneca stock (NASDAQ: AZN) — a biopharmaceutical titan that has played a pivotal role in global health. It is a beacon for traders seeking to unlock the secrets hidden within its price movements.
There is a monthly demand level at $66 per share, which took control last November 2024. It's the end of January 2025, and the stock is rallying as expected.

SOUTHBANK - BUY SOUTHBANK - BUY NOW
Key points :
South Indian Bank strong Fundamentals .
Stock PE - 5.47
Industry PE - 10.8
Stock Price Trade at Below Book Value ..
Company Price - Possible to Double
Technical :
Monthly - Take Support
Day - Symmetrical Triangle Pattern Breakout
Entry - 25.45 Rs
Target - 35.55 Rs
Stoploss - 21 Rs
Expected - 39 %
This is Only for My Trade Setup . Dont follow Blindly . Take Educational Purpose Only .
We not any responsiblities for Profit and loss ..
Thank You . Happy Trading ..

This is a no Brainer for you noobs - check itWhat up? how is everyone doing the almost end of January w a new Admin?
one things i do wish is that Robinhood will collab with @TradingView does anyone have info on this? Why are the holding back?
follow along...
i swing only SPY 500 options- 7 years in training, a year before the covid 19.
i buy calls or buy puts overnight, easy-
up or down?
1. The week, before this weeks volume was pretty decent I must say.- this held us up.
2. I do like continuation patterns.
3. $ 605.00 is in the cards for next week of 1/27 - 1/31
4. With the month closing on Friday the 31, we may even see a low touching that $ 600.00
5. Therefore we are looking for bounces on either side.
6. I kind of like $ 600.00 to confirm there are buyers on that area of support. For our continuation of an upmarket trend.
7. Although volume and candlestick are key to watch around 605. ⛳️
do we get a birdie or a par this week? --
-
leave a comment or evaluation below.

NBIS Nebius Group Among My Top 10 Picks for 2025 | Price TargetNebius Group N.V. (NBIS) presents a compelling bullish case for a potential doubling of its stock price by the end of 2025, driven by several fundamental factors that highlight its growth trajectory within the rapidly expanding AI infrastructure market.
NVIDIA Corporation (NVDA) has made a significant investment in Nebius Group N.V. (NBIS), contributing to a $700 million funding round aimed at expanding Nebius's AI infrastructure capabilities. This investment aligns with NVIDIA's strategic focus on enhancing its presence in the rapidly growing AI market.
Explosive Revenue Growth:
Nebius Group has demonstrated remarkable revenue growth, with Q3 2024 revenues reaching $43.3 million, representing a 1.7-fold increase compared to the previous quarter and a staggering 766% year-over-year increase. This surge is primarily driven by the company's core AI infrastructure business, which grew 2.7 times quarter-over-quarter and 6.5 times year-over-year. Analysts expect this momentum to continue, projecting annual revenues of approximately $731.96 million for 2025, reflecting a robust demand for AI-centric services and solutions.
Strategic Investments in AI Infrastructure:
The company is heavily investing in expanding its GPU cluster capabilities and data center capacity, with plans to allocate over $1 billion towards these initiatives. This strategic focus on enhancing AI infrastructure positions Nebius to capture significant market share as the global demand for AI technologies continues to rise. The annualized run-rate for its cloud revenue has already surpassed $120 million, indicating strong customer adoption and a growing client base that includes Fortune 500 companies.
Strong Market Position and Competitive Advantage:
Nebius Group is uniquely positioned within the AI infrastructure landscape, specializing in full-stack solutions that cater to developers and enterprises looking to leverage AI technologies. As businesses increasingly prioritize AI integration into their operations, Nebius's comprehensive offerings make it an attractive partner for organizations seeking to enhance their technological capabilities. The company’s ability to provide scalable solutions will be crucial as the demand for AI services expands.
Healthy Financials and Cash Reserves:
As of September 30, 2024, Nebius reported cash and cash equivalents totaling approximately $2.29 billion, providing a solid financial foundation to support its growth initiatives without excessive reliance on debt. This strong liquidity position allows Nebius to invest aggressively in technology and infrastructure while maintaining operational flexibility 14. Additionally, with gross margins projected to remain robust at around 55% in 2025, the company is well-positioned to improve profitability as revenues grow.

APPLE REBOUND AHEAD|LONG|
✅APPLE is set to retest a
Strong support level below at 220.00$
After trading in a local downtrend from some time
Which makes a bullish rebound a likely scenario
With the target being a local resistance above at 226.35$
LONG🚀
✅Like and subscribe to never miss a new idea!✅

Necklace Pattern- DCMShriramIs this getting ready for some move?
DCM Shriram
Can this rally, take it up?
DCM Shriram is all set, isnt it?

GRMOVER - UPTREND BUY Stock Name - GRM Overseas
Trade Setup :
Weekly - Uptrend & Fibonacci Golden ration activated .
Day - Uptrend Continue
Suggestion :
Wait for Retest Or Retracement ..
Entry - 205 Rs
Stoploss - 176 Rs
Target - 264 Rs
Expected - 28 % Return ...
Happy Trading - Thank you ..

Netflix on the Rise Bullish Breakout in Motion!Trendline Support
The price is respecting an ascending trendline, indicating a strong bullish sentiment.
Recent candles have bounced off this support line, confirming its reliability.
Breakout Confirmation
The price has broken above a key horizontal resistance level around $870.
This breakout suggests bullish continuation, especially with volume support.
Risk-to-Reward Setup
A well-defined risk-to-reward ratio is visible.
Stop-loss appears to be placed below $853, protecting against a false breakout.
Target set around $939 aligns with a significant resistance zone, offering a potential reward.
Indicators
Positive price momentum is evident, with higher highs and higher lows forming.
Likely supported by broader market strength in tech stocks.
Next Steps
Monitor the price action for sustained movement above $870.
A retracement to retest the breakout level could provide a secondary entry.
Key resistance to watch: $900 and $939.
NFLX is poised for a bullish continuation, with the current setup offering a high-probability trade opportunity.

Inverse head and shoulder pattern monthly chart Just for education purpuse
Its look like inverse head and shoulder patern on monthly chart
thanks

From Market Underdog to Tech Titan| AppLovin’s Explosive Growth AppLovin: Making Ads Great Again, One Algorithm at a Time
AppLovin Corp, a prominent software company valued at $57 billion, offers an advanced mobile marketing platform. Over the past year, its stock price has surged by an impressive 500%, far outpacing the S&P 500’s 39% increase. The company’s financial growth is equally remarkable, with a year over year revenue boost of 40%, a 188% jump in operating profits, and a 300% surge in net income in its latest quarterly report
With 40% of the company held by insiders and a shareholder friendly stance that includes share buybacks, AppLovin presents a compelling investment opportunity. Additionally, its valuation remains competitive relative to other software companies, supporting my "buy" rating.
From Ad Nerds to Tech Lords, AppLovin’s Secret to Winning Over Wall Street
AppLovin operates a comprehensive software platform that helps clients achieve crucial KPIs, such as revenue growth and business expansion. Leveraging AI, its software platform stands out as a powerful tool for advertisers, providing capabilities like automated marketing, customer engagement, and monetization. It’s built to optimize targeted content delivery to the most suitable audience, supported by analytics and monetization features that drive maximum value.
At the core of AppLovin’s technology is AXON, an AI engine that powers AppDiscovery. This feature matches advertiser demand with publishing opportunities through a sophisticated real-time auction algorithm, shifting from traditional waterfall systems to an intelligent, programmatic approach.
AppLovin has positioned itself as a leader in the future of advertising, driven by its cutting-edge AI capabilities. I believe there’s immense growth potential here that the company is just beginning to explore.
Performance
In the third quarter, AppLovin reported a 39% year-over-year revenue increase, moving from $864 million to $1.2 billion. This marks its highest-ever quarterly revenue and extends its streak of sequential topline gains to seven quarters. For the first nine months of 2024, AppLovin saw a 43% year-to-date revenue increase, largely fueled by a 76% rise in software platform revenue. This growth was driven by AppDiscovery, whose installations surged by 39% in Q3, underscoring its strong appeal to advertisers.
Beyond software platform growth, AppLovin’s in-app purchases and advertising revenues also increased modestly by 3% and 7%, respectively, despite challenging comparisons, supported by a 53% boost in advertising impressions.
The company achieved record operating cash flows of over $550 million in Q3, alongside significant margin improvements across gross, operating, and EBITDA levels. These gains highlight the company’s explosive growth and underscore the stock’s 500% rise over the past year.
Given AppLovin’s strategic success and positive advertiser response, I anticipate ongoing improvements in cash flow and profit margins. With over $3.3 billion spent on share buybacks since 2022—$980 million in 2024 alone—the company continues to reward its shareholders while capitalizing on its profitable AI-driven platform.
Valuation
Although APP’s trailing P/E ratio of 74.52 and PS ratio of 19.33 might appear high compared to the IT sector averages, a comparison with peers in the Application Software industry reveals a different perspective.
In a peer group of large software companies, APP ranks third in EV/Sales ratio at 18.65 but also boasts a forward topline growth rate of over 24.1%, placing it among the top performers. This high growth potential appears to justify the stock’s premium, positioning it attractively in terms of PS ratio relative to anticipated growth.
Despite recent heavy buying, APP remains an appealing value investment. As long as it maintains its relative positioning, I continue to view the stock favorably.
Risks
Despite my optimism, I recognize that AppLovin’s momentum could be part of a broader AI-driven market surge, raising concerns about a potential AI bubble. If the market faces a downturn similar to the dot-com bubble, APP could experience a sharper decline than its peers, especially given its relatively weak balance sheet.
Additionally, with an RSI of 96 signaling heavy overbuying, there may be potential for a future correction. While APP’s 500% rise is impressive, it could be vulnerable if the market undergoes a broader correction
Conclusion
Advertising is on the cusp of an AI driven transformation, and AppLovin is well-positioned to capitalize on this shift with its powerful AI-enabled platform. Despite the stock’s impressive 12-month performance, there’s still significant growth potential

AMAZON WILL KEEP GROWING|LONG|
✅AMAZON is trading in an
Uptrend along the rising
Support line and we are
Already seeing a bullish rebound
And a move up from the support
Just as I predicted so we are
Bullish biased and we will be
Expecting a further
Bullish continuation
LONG🚀
✅Like and subscribe to never miss a new idea!✅

Kalyan Jewellers: Continuation H&SPrices have formed a continuation Head & Shoulders whose neckline is 775 zone. Prices have given a breakout of the neckline and likely to continue the uptrend. The measured target of the pattern is coming in the region of 950 zone. On the downside the key level is 712.

Is Apple Stock Really Worth Investing in January 2025?Strong weekly demand level took control. Expecting a decent reaction.
As we enter 2025, the financial landscape is buzzing with excitement and uncertainty. Investors are searching for promising opportunities, and one name that consistently tops the charts is Apple Inc. (NASDAQ: AAPL). Love it or hate it, this tech giant has become synonymous with innovation and growth—drawing both seasoned investors and newcomers alike to its stock like moths to a flame.

Quantum Corporation: Major Levels to WatchGood morning, trading family!
Quantum Corporation is at a crucial point:
Above $34.50: A breakout could push us to $50 or even higher.
Below $29: The downside opens up to the $6–$12 range.
Stay sharp as these levels could define the next big move.
This Sunday, I’m hosting a Master Your Mind Traders Class to help you build a stronger trading mindset and strategy. Seats are limited—send me a DM for details!
Kris/Mindbloome Exchange
Trade What You See

Micron Technology: Bearish or Ready to Break Out?Good morning, trading family!
Micron (MU) is at an important spot right now:
If we move lower, I’m watching $97 and $96 as key levels, with potential for more downside.
If we hold above $100, there’s room to climb to $102, $103, and $104. A break above $104 could mean a smoother ride higher.
I’m also hosting a Master Your Mind Traders Class this Sunday to help you refine your skills and mindset. Want to join? Send me a message for details.
Kris/ Mindbloome Exchange
Trade What You See

SPANDANA Breakout of a Descending ChannelSPANDANA breaks out of a descending channel with a decent spike in volume, confirming a bullish breakout and is at a good entry.
The stock gave a massive 19% rally in 2 days already.
Follow me for more opportunities.

ASSO ALCOHOLS - Flag and Pole BreakoutNew LONG Trade Alert: Associated Alcohols
On the daily time frame, the chart looks ready to take off from here after the confirmed flag and pole breakout.
I have entered in this trade using Risological Trading Indicator.
Exit rule:
Close the long position once you get the first RED candle close using the Risological indicator.
Good luck to all!
Follow for more!
