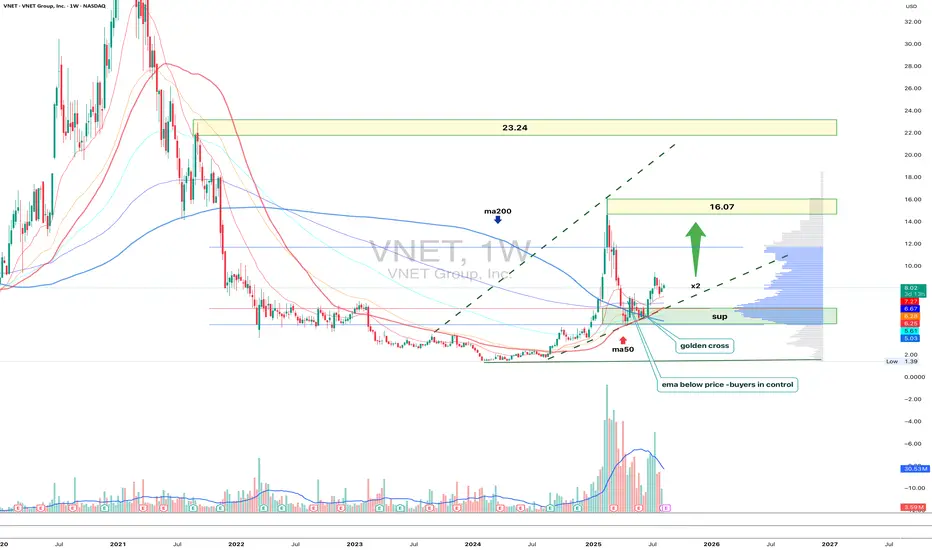
VNET 1W - second wave or second life?On the weekly VNET chart, the price has held above the 6.25–6.05 support zone, which previously triggered an impulsive rally. The current structure remains bullish: the MA50 is positioned above the MA200(golden cross) and ema below price(buyers control situation), and recent volume spikes indicate active buying interest. The next major resistance lies at 16.07 - where a key supply zone aligns with the previous local top. A breakout and consolidation above it would open the path toward the strategic target at 23.24, matching a Fibo extension and a historical distribution zone.
Fundamentally, VNET benefits from renewed investor interest in the Chinese tech sector and improved corporate earnings. Tactical plan: as long as 6.25–6.05 holds, long positions could target 16.07 first, with potential continuation toward 23.24.
A break below support cancels the bullish scenario. Sometimes the market offers a second chance and VNET may be one of those moments worth catching.
Stockstotrade
Microsoft’s Big Moves This Quarter | From Activision to AI AgentMicrosoft’s Revenue Surge: The Power of AI, Gaming, and Strategic Investments
Microsoft has released its Q1 FY25 earnings for the quarter ending in September
The stock saw a 6% drop, indicating the results fell short of investors' high hopes. Trading at over 30 times projected earnings for next year, expectations for Microsoft were significant.
CEO Satya Nadella stated
“Our AI business is set to exceed an annual revenue run rate of $10 billion next quarter, making it the fastest business in our history to reach this milestone.”
This means that AI will soon account for about 4% of Microsoft's total revenue in under three years a remarkable feat for a global giant.
If you need a quick summary, here are three main points:
1. ☁️ Azure’s growth is slowing. As Microsoft’s key player in the AI competition, Azure grew 34%, down slightly from 35% in the prior quarter (after adjustments). This comes as Google Cloud raised the bar, with its growth accelerating from 29% to 35% during the same period.
2. 🤖 AI growth is limited by hardware supply, as capacity struggles to meet demand. Data center expansion is a long-term process, and Microsoft is investing heavily in infrastructure, aiming for a growth boost by 2025.
3. 👨👩👧👦 Consumer-focused products like Gaming and Devices are underperforming. Although not essential to Microsoft's core business, their poor performance has impacted overall results.
Here’s a breakdown of the insights from the quarter.
Overview of today’s insights:
- New segmentation.
- Microsoft’s Q1 FY25 overview.
- Key earnings call highlights.
- Future areas to monitor.
1. New Segmentation
Revised Business Segments
In August, Microsoft announced a reorganization of its business segments, effective this quarter. The purpose? To better align financial reporting with the current business structure and strategic management.
Summary of the main changes
- Microsoft 365 Commercial revenue consolidation: All M365 commercial revenue, including mobility and security services, now falls under the Productivity and Business Processes segment.
-Copilot Pro revenue shift: Revenue from the Copilot Pro tool was moved from Productivity and Business Processes to the More Personal Computing segment under Search and news advertising.
-Nuance Enterprise reallocation: Revenue from Nuance, previously part of Intelligent Cloud, is now included in Productivity and Business Processes.
-Windows and Devices reporting combination: Microsoft now reports Windows and Devices revenue together.
Impact of These Changes:
Core Segments Overview:
In summary:
- The Productivity and Business Processes segment has grown significantly.
- The Intelligent Cloud segment has decreased due to the reallocation of Nuance and other revenue.
Products and Services Overview:
- M365 Commercial now includes Nuance, shifted from the Server products category, along with integrated mobility and security services.
- Windows & Devices have been merged into a single, slower-growth category.
Additional Insights:
- Azure, Microsoft's cloud platform, is reported within 'Server products and cloud services.' Although its growth rate is shared by management, exact revenue figures remain undisclosed.
Azure’s past growth figures have been adjusted for consistency, with the last quarter’s constant currency growth recast from 30% to 35%, setting a higher benchmark. Tracking these metrics is challenging due to limited revenue disclosure, but this recast indicates Azure's raised growth expectations.
2. Microsoft’s Q1 FY25 Performance
Financial Summary:
-Revenue: Up 16% year-over-year, reaching $65.6 billion (exceeding estimates by $1 billion). Post-Activision Blizzard acquisition in October 2023, the growth was 13% excluding the merger.
New Product and Services Segmentation Results
- Server products & cloud services: $22.2 billion (+23% Y/Y).
- M365 Commercial: $20.4 billion (+13% Y/Y).
- Gaming: $5.6 billion (+43% Y/Y), influenced by Activision.
- Windows & Devices: $4.3 billion (flat Y/Y).
- LinkedIn: $4.3 billion (+10% Y/Y).
- Search & news advertising: $3.2 billion (+7% Y/Y).
- Enterprise & partner services: $1.9 billion (flat Y/Y).
- Dynamics: $1.8 billion (+14% Y/Y).
- M365 Consumer products: $1.7 billion (+5% Y/Y).
Core Business Segments Breakdown:
- Productivity and Business Processes: Increased 12% Y/Y to $28.3 billion, supported by M365 Commercial, especially Copilot adoption.
- Intelligent Cloud: Grew 20% Y/Y to $24.1 billion, with Azure AI driving growth.
- More Personal Computing: Grew 17% Y/Y to $13.2 billion, including a 15-point boost from Activision. Devices fell, but search and ad performance improved under new segmentation.
Key Observations:
- Microsoft Cloud revenue climbed 22% Y/Y to $39 billion, making up 59% of total revenue (+3 percentage points Y/Y).
- Azure continues to drive cloud services and server products' growth.
- Xbox growth has surged due to the Activision acquisition since Q2 FY24, expected to stabilize by Q2 FY25.
- Windows OEM and devices combined, showing a 2% decline in Q1 FY25.
- Office rebranded to Microsoft 365; updated naming will be used starting next quarter.
- Margins: Gross margin at 69% (down 2pp Y/Y, 1pp Q/Q); operating margin at 47% (down 1pp Y/Y, up 4pp Q/Q).
- EPS: Increased 10% to $3.30, beating by $0.19.
Cash Flow and Balance Sheet:
- Operating cash flow: $34 billion (52% margin, down 2pp Y/Y).
- Cash**: $78 billion; Long-term debt**: $43 billion.
Q2 FY25 Outlook:
- Productivity and Business Processes: Anticipated 10%-11% Y/Y growth, steady due to M365, Copilot inclusion, and expected LinkedIn growth of ~10%. Dynamics set to grow mid-to-high teens.
- Intelligent Cloud: Projected 18%-20% Y/Y growth, slightly slowing, with Azure growth expected between 28%-29%.
- More Personal Computing: Forecasted ~$14 billion revenue, declines in Windows, Devices, and Gaming anticipated, with some offset from Copilot Pro.
Main Takeaways:
- Azure's growth slowed to 34% Y/Y in constant currency, with AI services contributing 12pp, up from 11pp last quarter. This marks a dip from the recast 35% prior and included an accounting boost.
- Capacity limitations in AI persist; more infrastructure investments are planned, with reacceleration expected in H2 FY25.
- Commercial performance obligations grew 21% to $259 billion, up from 20% in Q4.
- Margins were pressured by AI infrastructure investments; Activision reduced the operating margin by 2 points.
- Capital expenditures increased by 50% to $15 billion, half dedicated to infrastructure, with further Capex growth expected.
- Shareholder returns included $9.0 billion through buybacks and dividends, matching Q4 repurchases.
Earnings Call Highlights:
Azure AI saw a doubling of usage over six months, positioning it as a foundation for services like Cosmos DB and SQL DB. Microsoft Fabric adoption grew 14% sequentially, signaling rapid uptake.
AI Expansion: GitHub Copilot enterprise use surged 55% Q/Q, with AI-powered capabilities used by nearly 600,000 organizations, a 4x increase Y/Y.
M365 Copilot has achieved a 70% adoption rate among Fortune 500 companies and continues to grow rapidly.
LinkedIn saw accelerated growth in markets like India and Brazil and a 6x quarterly increase in video views, aligning with broader social media trends.
Search and Gaming: Bing’s revenue growth surpassed the market, while Game Pass hit a new revenue record, propelled by Black Ops 6
Capital Expenditures: CFO Amy Hood highlighted that half of cloud and AI investments are for long-term infrastructure, positioning the company for sustained growth.
4. Future Outlook
Energy Needs: Microsoft, facing higher power demands, plans to revive a reactor at Three Mile Island with Constellation Energy by 2028 to power its AI data centers sustainably.
Autonomous AI Agents: Coming in November, these agents will perform tasks with minimal human input, enhancing efficiency. Copilot Studio will allow businesses to customize these agents, with 10 pre-built options to start.
Industry Impact: Salesforce has launched Agentforce, signaling increased competition. CEO Mark Benioff recently compared Microsoft’s Copilot to the nostalgic Clippy, stoking rivalry.
For further analysis stay tuned

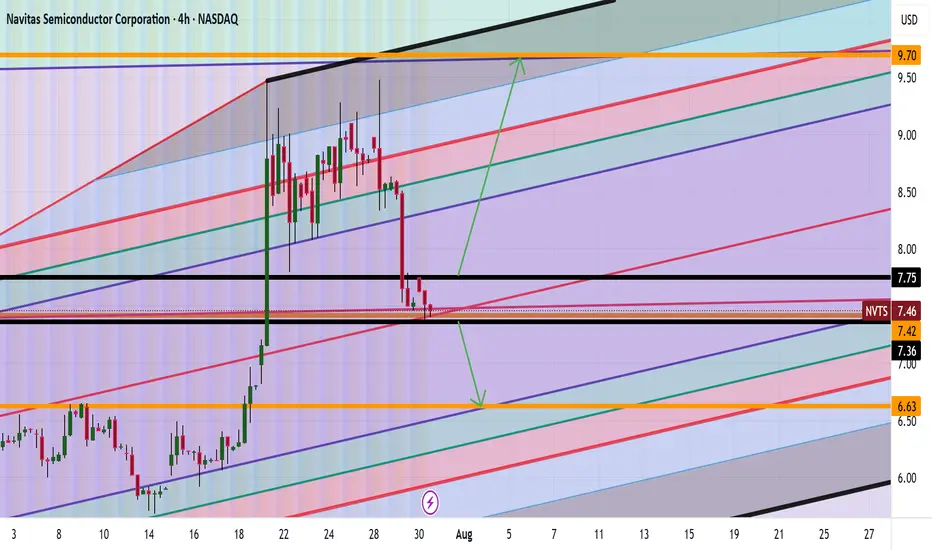
NVTS Analysis Are we Heading to $9+ Good afternoon Trading Family
Based on what we currently see with NVTS are two scenarios happening:
1) Above 7.80 highs we will thus be heading to the 9-9.7 range
2) Below 7.30 lows then we will be heading to the 6 dollar range
Happy Trading
Trade Smarter/ Live Better
Kris
Is it right time and choice to buy UNH Stock - {15/07/2025}Educational Analysis says that UNH Stock (USA) may give trend Trading opportunities from this range, according to my technical analysis.
Broker - NA
So, my analysis is based on a top-down approach from weekly to trend range to internal trend range.
So my analysis comprises of two structures: 1) Break of structure on weekly range and 2) Trading Range to fill the remaining fair value gap
Let's see what this Stock brings to the table for us in the future.
Please check the comment section to see how this turned out.
DISCLAIMER:-
This is not an entry signal. THIS IS FOR EDUCATIONAL PURPOSES ONLY.
I HAVE NO CONCERNS WITH YOUR PROFIT OR LOSS,
Happy Trading.

RGTI Heading to $17+ Good evening trading family
So currently due to price action it appears we are on our way to 17 dollar target however we expect a little bit of a correction at the 15 range.
However worst scenario if we go below 11 dollars be prepared for a sinker down to 8.
Trade Smarter Live Better
Kris/ Mindbloome Exchange

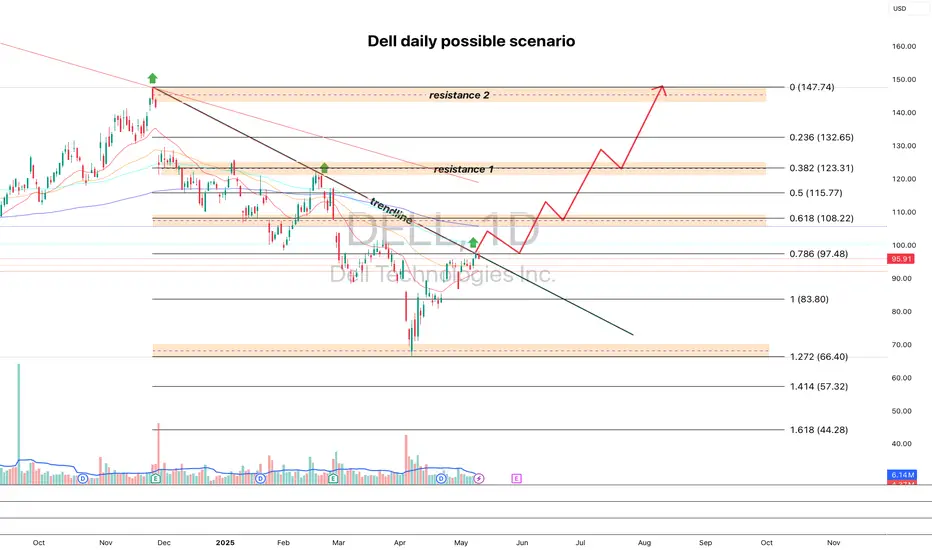
DELL looks good for pump dailyI'm watching DELL for a breakout of the trendline and a cross above the 100 MA — targeting a move toward 108.22, followed by a retest of the breakout and further upside targets at 123.31 and 147.74.
Fundamentally, the company looks strong, and the next earnings report is expected on May 29.
If you like the analysis, hit that rocket 🚀
$ROOT IS IN A LONG TERM WEDGE WHICH SHOULD BREAK OUT SOONNASDAQ:ROOT that is in that bullish wedge is constricting and consolidating, it's like a rocket ship getting ready to launch NASDAQ:ROOT to $200 and higher like $230 or so.

ADM 1D: 10-Month Channel Says Goodbye?Since July 18, 2024, ADM had been locked in a clean downward channel — well-behaved, well-respected. But in May 2025, the structure finally cracked: price broke out, crossed above the 50-day MA, and pulled back for a textbook retest right on the channel’s upper edge. So far, the breakout is holding. The next targets sit at 50.6 (0.618), 53.5 (0.5), and 56.5 (0.382). As long as price stays outside the channel, the bullish structure remains intact.
Connor’s RSI down below is quietly doing its job — already bounced from deep oversold, now curling up with momentum. It’s not flashy, but in this context it signals early strength before the crowd notices.
Fundamentally, ADM is still cleaning up after the early-2024 accounting scandal that nuked investor trust. But management moved fast: reinstated buybacks, tightened guidance, and Q1 2025 came in strong — $22.6B revenue, $0.88 EPS, both beating expectations. ADM remains a pillar of the U.S. ag sector, and in an era of global food anxiety, that means structural demand isn’t going anywhere.
Вот адаптированный перевод финального блока под **английский пост**, в том же живом и профессиональном стиле:
Enjoyed the idea? Like, share, and drop your thoughts in the comments.
It helps keep the content visible, free, and accessible to everyone.
Got your own charts or takes? Let’s discuss them below.

NVIDIA 1D — When “Head & Shoulders” Aren’t Just for the GymOn the daily chart, NVDA has broken out of the descending channel and reclaimed the 50-day moving average (MA50), triggering a classic inverted head and shoulders formation. Price is now holding above the key $113–$114.50 zone, confirming a structural shift. As volume picks up, buyers are eyeing the next levels of resistance.
Near-term upside targets: – $119.80 (0.5 Fibonacci) – $127.62 (0.382) – $137.28 (0.236) — primary resistance zone – Extended target — $152.91 (1.0 Fibonacci projection)
Technical setup: — Breakout from channel + above MA50
— Inverted head and shoulders pattern completed
— $114.50–$118.00 now acts as buyer support
— EMA and MA convergence supports trend reversal
— Increasing volume on rallies supports bullish momentum
Fundamentals: NVIDIA remains the AI and semiconductor sector leader. Growing demand for high-performance GPUs in AI and data centers positions NVDA as a core tech play. Expectations of strong earnings and continued institutional accumulation support the bullish narrative.
The confirmed breakout and inverted H&S setup mark a clear structural reversal. As long as price stays above $114.50, the path toward $127–$137 remains the primary target zone, with $152.91 in sight if momentum continues.

NEM SHORT IDEANEM Insurance stock is ready to have a drop. There's a bearish divergence signal from the awesome oscillator showing that there's a high tendency for the price of the stock to drop as much as to 11.65 and below that value. Any value below 11.50 is the discount level where there can be a potential for the next long opportunity.
Looking at the past data, some patterns were revealed. In September 2016, there was a bearish divergence signal and the price dropped from around 3.71 to around around 1.51. Likewise, in September 2022, there was a bearish divergence and the price dropped from around 5.65 to around 3.71. Similar pattern is what is repeating itself showing that there's a higher probability that the price dropped into the discount level. For an investor holding this stock, this maybe a signal to sell and wait for another long opportunity. For a trader, it's an opportunity to short the stock, targeting the discount price around 11.65.
Confluences for the short signal:
1. Price is showing higher high while awesome oscillator is showing lower high indicating bearish divergence.
2. When similar patterns occured in the past, price dropped into the discount level.
3. A bearish engulfing candlestick had been formed showing that price is likely going to drop further.
Disclaimer: This is not a financial advice. The outcome maybe different from the projection. If you can't accept the risk, don't take the signal.

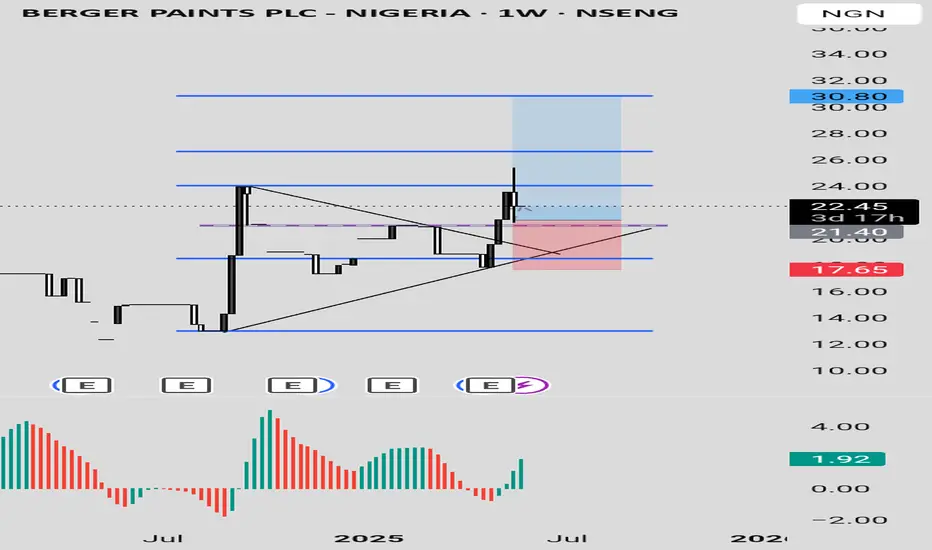
Berger Paints PLC Berger Paints PLC stock is showing a bullish signal for appreciating in value. The price dropped into a discount level and broke a down trend line with a strong bullish candle, closing above the trendline. This happened when the price was also in an oversold region as indicated by Awesome Oscillator.
Currently, there has been a pull back with a rejection, showing more confidence in the bullish move. The stock can be bought at the current price while targeting 24, 26.60 and 30.80 as the final target based on the Fibonacci level.
Confluences for the long signal:
1. Price is coming from a discount level
2. Price was in oversold level before and it is showing more bullish signal
3. Price had broken out of a down trend line with a strong bullish candle
4. There was a strong rejection from last week candle.
Disclaimer: this is not a financial advice. The outcome maybe different from the projection. Don't take the signal if you don't accept the risk.
RT BRISCOE PLC LONG IDEART BRISCOE PLC stock, after reaching its all time high, dropped to discount level. Currently, it has broken out of down trend line with a strong weekly bullish candle closing above a the down trend line and resistance level. The awesome oscillator is also in the oversold region with a bullish signal. An aggressive trader or investor can buy at the current price while a conservative trader or investor may wait for a drop to around 2.20 and 2.30 to place a buy. While you can also so spread your risk by buying at the current market price and add more positions when price drop towards the resistance turned support.
The entry is at the current market price or buy at 2.20 while the stop can be at 1.73 and the target can be around 2.90 and 4.30.
Confluences for the long signal:
1. Price is in discount level
2. Price broke out of a down trend line and resistance level with a strong bullish candle.
3. Awesome oscillator is in oversold region and showing bullish signal.
Disclaimer: this is not a financial advice. The outcome maybe different from the projection. If you can't accept the risk, don't take the signal.

SMCI LONG IDEASMCI broke out of a downtrend and support level with a strong weekly bullish candle. This is a signal that the stock is ready for appreciating in value. The first signal was in November 2024 when there was a divergence on awesome oscillator. This was followed by a breakout of down trend line in February 2025, which made price to move from around 36 to around 66.
Currently, price is showing a strong momentum to rally up again. With a pullback to the key level, the best time to buy the stock is at current price or between 38 and 40. An aggressive trader/investor could have when the previous weekly candle closed bullish, while a conservative trader/investor would have waited for the pullback to the key level which is what's happening at the moment.
The entry is around 38 and 40 while the stop could be 25 and the target can be 66 and 119.
Confluences for the signal:
1. Price broke out of a down trend line and closed with a strong weekly bullish candle.
2. Price also closed above a support level.
3. Price was coming from a strong support level.
4. Awesome oscillator is still below 0 and it's just resuming bullish region.
Disclaimer: this is not a financial advice. The outcome maybe different from the projection. If you can't accept the risk, don't take the signal.

EVLV 1WEVLV — a rectangle pattern has formed, and the 100 MA has crossed above the 200 MA, signaling the start of a potential trend reversal. Targets: $8.29 and $12.94.
As of May 2025, the fundamental outlook for Evolv Technologies Holdings Inc. (ticker: EVLV) is as follows:
The company continues to show strong revenue growth and improving key financial metrics, despite remaining unprofitable. Revenue for 2024 reached $103.9 million, up 31% from 2023, while the net loss was halved to $54 million. EBITDA improved to -$21 million from -$51.8 million the year before. Annual recurring revenue (ARR) grew by 39% to $99.4 million. The company maintains a strong financial position with $51.9 million in cash and zero debt.
The stock is currently trading at $4.44, above its estimated intrinsic value of $2.76 according to AlphaSpread. Analysts remain optimistic, giving EVLV a “Strong Buy” rating and forecasting an average price target of $5.31, suggesting about 19.6% upside potential.
However, investors should keep in mind that the company is still unprofitable, and the current market valuation exceeds its fundamental value.

UPS United Parcel Service Stock. Top stock to buy in 2025UPS United Parcel Service Stock. Top stock to buy in 2025 after reaching the strong monthly demand level. It took 50 months to reach it and now it's trying to play out as expected. Long-term longs for this American stock.

MFSL: Cup & HandleStock has given a breakout of Cup & Handle pattern and retested the neckline in Jan'25. The measured target for the same is coming in the region of 1900. On the downside the key level can be 1080.

Kotak Bank: Impulse formationStock is rising in an impulsive manner and currently trading under wave-4 correction. This correction is likely to conclude in the zone of 2215-2200 zone and then we can expect another rally on the upside under wave-5 towards 2350 zone.

GUJRAT GAS: INVERSE H&SThe Inverse Head and Shoulders pattern is a bullish reversal chart pattern that signals a potential trend reversal from bearish to bullish. It consists of three key components:
Structure of the Pattern:
Left Shoulder: A price decline followed by a temporary rally.
Head: A deeper decline forming the lowest point, followed by another rally.
Right Shoulder: A decline similar in size to the left shoulder but not as deep as the head, followed by a move higher.
Neckline: A resistance level that connects the highs of the two rallies after the left shoulder and head.
The Inverse Head and Shoulders pattern in Gujrat Gas, with a neckline at ₹396, indicates a potential bullish reversal. The stock has formed a well-defined left shoulder, head, and right shoulder, suggesting that selling pressure is weakening. A breakout above ₹406, supported by strong volume, could confirm the pattern and trigger an upward move. The target price for this breakout is ₹440, calculated by measuring the distance from the head’s low to the neckline and projecting it upwards. If the stock sustains above the neckline, it could gain further momentum. However, traders should consider placing a stop-loss below the right shoulder i.e. 376 to manage risk in case of a failed breakout.

QMCO: 19.24 Holds or Crashes to 18? #BullRun to 25.61? It appears if we can hold 19.24 and price action continues bulish we can see levels of 25.61 being hit. However if we hold below 21 dollars next level down is 18. Let me know what you think love to hear your thoughts below

2 Minute DXYZ Analysis: Key Levels to Watch for the Next MoveWe hit our 34 target on DXY, but what’s next? If we break above 49, we could see a solid bull run. However, if weakness continues, we might test lower levels at 31, then 29, and possibly 23.50 for a deeper correction.
Watching these levels closely—what’s your outlook on DXY? Drop your thoughts below.
Kris/Mindbloome Exchange
Trade Smarter Live Better

Pricol Ltd – Bearish on 1D Time FramePricol Ltd - Symmetrical Triangle Breakdown giving us a potential short trade.
You can use your own strategy and trade accordingly.
Give me some energy!! ✨
We pour our heart and soul into uncovering potential opportunities and crafting ideas that truly matter to you. Your support fuels our passion and keeps us going! 💚
With gratitude,
ProfitsNinja
✅ Thank you for being part of our journey! For more insights and ideas, show some love with a ❤️ Like ❤️ and 🌟 Follow 🌟!
⚠️ Stay alert!
Markets are dynamic and unpredictable. Even with the best signals, shifts can happen swiftly and powerfully. Stay prepared, stay ahead!

Meta's Q3 Financial Results | Growth and the Future of AI & AR Meta's Q3 Earnings: AI Investments Shape the Future of Engagement and Monetization
Last week, Meta shared its Q3 earnings, revealing a familiar trend: while the results were strong, rising AI investments cast a shadow. With over 3.2 billion daily users across Meta’s apps, the company alongside Google and YouTube is in a prime position to bring AI into the mainstream. However, this shift could potentially disrupt the creator economy as we know it
So, how will this affect the future of Meta’s apps?
Did you know META is 222% up since our first analysis ?
Let’s break down the quarter and explore the latest updates
Today’s Highlights
- Overview of Meta Q3 FY24
- Recent business highlights
- Key quotes from the earnings call
- The potential decline of the creator economy
1. Meta Q3 FY24 Overview
Meta operates within two main segments
FoA: Family of Apps (Facebook, Instagram, Messenger, and WhatsApp)
RL: Reality Labs (virtual reality hardware and software)
Daily Active People in FoA grew by 5% year over year, reaching 3.29 billion. However, user growth has slowed, with Meta adding 20 million daily users in Q3 2024 down from 50 million earlier in 2024.
Meta’s reach now extends to over half of the global population aged 15 to 80, meaning future growth will hinge more on engagement and ad efficiency than adding new users.
Key Insights from Zuckerberg:
-Facebook: Positive engagement trends among Gen Z in the U.S.
-Instagram: Sustains “strong” growth globally.
-WhatsApp: Now surpasses 2 billion calls daily.
-Meta AI: 500 million monthly active users.
-Threads: 275 million monthly active users, up from 200 million in Q2, with notable growth in regions like the U.S., Taiwan, and Japan (currently not monetized and unlikely to drive significant revenue by 2025).
Advertising Performance:
- Ad impressions grew 7% year-over-year (compared to 10% in Q2).
- Average ad price increased by 11% year-over-year (10% in Q2).
- Average revenue per user grew by 12% year-over-year, reaching $12.29 (compared to Snap at $3.10 and Reddit at $3.58).
- Despite some critics suggesting potential inflation due to bot activity, ARPU growth points to real ad value; fake users can’t generate revenue.
Financials
- Revenue rose 19% year-over-year to $40.6 billion.
- FoA saw a 19% increase, reaching $40.3 billion.
- RL grew by 29% to $0.3 billion.
- Gross margin was 82% (-1pp Y/Y, +1pp Q/Q).
- Operating margin stood at 43% (+2pp Y/Y, +5pp Q/Q).
- FoA operating profit was $21.8 billion (54% margin, +2pp Y/Y).
- RL reported an operating loss of $4.4 billion (down slightly from $4.5 billion in Q2).
- EPS rose by 37% year-over-year to $6.03.
Cash Flow
- Operating cash flow was $24.7 billion (61% margin, +1pp Y/Y).
- Free cash flow was $15.5 billion (38% margin, -2pp Y/Y).
Balance Sheet
- Cash and marketable securities totaled $71 billion
- Long-term debt was $29 billion
Guidance:
- Q4 FY24 revenue is forecasted at $46.5 billion in the mid-range
- FY24 expenses estimated at $96-$98 billion (previously $96-$99 billion)
- FY24 Capex is expected to be $38-40 billion (previously $37-$40 billion)
Summary Analysis
Revenue growth was 20% in constant currency (compared to 23% in Q2), with ad revenue growth driven by increased ad prices. Strong demand for ads continued, largely due to higher ad performance, especially in online commerce, healthcare, and entertainment. Geographically, North America and Europe led growth at 21%, while Asia slowed from 28% to 15%.
Reality Labs’ revenue rose 29%, mainly from hardware sales, though the division continues to post significant losses. As shown in the visuals, FoA operating profit reached an all-time high, while RL’s losses remain around $4 billion quarterly.
Headcount increased by 9% year-over-year to 72,404, signaling a return to hiring, particularly in priority areas such as monetization, infrastructure, Reality Labs, and generative AI.
Stock buybacks amounted to nearly $9 billion in Q3, up from $6 billion in Q2, though lower than the $15 billion in Q1. Management’s confidence in Meta’s stock remains strong, with an additional $1.3 billion paid in dividends.
Capital expenditures climbed by 36% to $9.2 billion compared to $8.5 billion in Q2, with guidance staying on track. Management anticipates “significant acceleration in infrastructure expenses” for 2025, which will affect both the cost of revenue and R&D expenses.
Despite heavy AI spending, Meta remains highly profitable, generating nearly $52 billion in free cash flow over the past 12 months—just shy of Alphabet’s $56 billion over the same period.
Q4 FY24 revenue guidance points to deceleration, with mid-range growth forecasted at 16%.
Let’s examine Meta’s investments and market position further.
2. Recent Business Highlights
Meta Orion
Meta's Orion AR glasses mark an ambitious step towards a future beyond smartphones, showcasing the potential of augmented reality (AR):
-Prototype Status: Orion is a high-tech AR prototype, equipped with advanced features, but high production costs keep it out of reach for consumers.
-Advanced AR Display: Using Micro LED projectors and silicon carbide lenses, Orion offers a broad field of view with sharper visuals than most current AR devices.
-Interactive AI Integration: With Meta's generative AI, Orion enables users to interact with virtual elements, identify real-world objects, and create immediate solutions, such as recipes.
-Complex Hardware: Orion relies on a neural wristband for control and a wireless compute puck, creating a multi-part system.
-High Cost & Limited Production: With a price tag estimated at $10,000, Orion isn’t ready for mass production. Meta has produced around 1,000 units for demonstrations and internal testing.
- Future Vision: Meta aims to release a consumer-friendly AR device within a few years, working toward a slimmer, more affordable model that could rival smartphone prices.
Orion reflects Meta's goal to lead the next wave of computing, though significant technological and cost hurdles remain.
Timing and Competitive Landscape**: Zuckerberg’s reveal of Orion may aim to justify Reality Labs' annual $16-20 billion operating loss to shareholders and gather feedback. Meanwhile, Apple has initiated its “Atlas” project to explore the smart glasses market, indicating potential plans to shift focus from the high-end $3,500 Vision Pro VR headset.
How AI Is Already Impacting Meta
Beyond future-oriented projects like Orion, Meta’s AI advancements are actively enhancing its core business in two strategic areas: engagement and monetization.
-Engagement: Meta's recommendation engine uses AI to tailor feeds with highly relevant video content, keeping users engaged. AI-driven prediction systems further increase app usage by showing content that maximizes interaction.
-Monetization: AI boosts ad efficiency across the entire lifecycle—from creation to performance tracking. Generative AI assists with ad copy, images, and video, while advanced models analyze user behavior to serve targeted ads, improving conversion rates incrementally.
-Meta AI Studio: This platform allows developers to create, train, and deploy custom AI models within Meta’s ecosystem. By enabling personalized assistants, interactive AI, and AR applications, Meta seeks to drive new consumer apps and maximize ad potential across its platforms.
Market Share
Meta’s advertising revenue hit $39.9 billion in Q3, reaching 81% of Google’s search revenue, up from 76% last year. Meta’s ad revenue is expanding at the same rate as Amazon’s, despite Meta’s larger base, signaling regained market share and effective adaptation to the post-ATT environment.
3. Key Quotes from the Earnings Call
CEO Mark Zuckerberg
- On AI and the Family of Apps: “Improvements to our AI-driven feed and video recommendations have led to an 8% increase in time spent on Facebook and a 6% increase on Instagram this year alone. More than a million advertisers used our GenAI tools to create over 15 million ads last month, and we estimate businesses using Image Generation are seeing a 7% conversion lift.”
-On Llama 4: “We're training the Llama 4 models on a cluster larger than 100,000 H100s, more extensive than anything reported elsewhere.”
-On RayBan Meta Glasses: “Glasses are the ideal AI form factor as they let your AI see, hear, and communicate with you. Demand remains strong, with the new clear edition selling out quickly.”
-On Meta AI: “We’re on track for Meta AI to become the world’s most used AI assistant by year-end, with popular uses including information gathering, task assistance, and content exploration.”
CFO Susan Li
-On Recommendations: “Inspired by scaling laws observed in large language models, we’ve developed new ranking architectures for Facebook video that enhance relevance and increase watch time”
-On Capital Allocation: “We’re optimistic about our opportunities and believe that investing now in infrastructure and talent will accelerate progress and returns.”
4. The Potential Decline of the Creator Economy
Facebook and Instagram have evolved from social networks to content networks, benefiting creators with wide-reaching platforms. However, this era may be coming to a close.
-AI-Generated Content: Zuckerberg shared plans to introduce AI-generated and AI-summarized content on Facebook, Instagram, and potentially Threads, gradually shifting away from creator-generated content as the primary engagement driver.
-Impact on Creators: As AI learns to identify and generate engaging content, creators could struggle to compete, with algorithms delivering exactly what audiences want. Over time, creators may face a landscape where AI determines the most engaging posts, relegating them to the sidelines in a world increasingly powered by self-generating content.
-Why It Matters: Platforms like YouTube share 55% of ad revenue with creators, but Meta does not, meaning that an AI-driven shift isn’t primarily about cost-cutting. Instead, it allows for more integrated ad placements within algorithmic feeds, potentially boosting impressions and conversions.
Although AI generated feeds may sound dystopian, current high engagement accounts already use tactics to maximize engagement, meaning the shift to AI might go largely unnoticed by audiences.

Supply and Demand Trading Made Simple With Astrazeneca StockIn the ever-evolving world of stock trading, where news headlines can shift markets in a heartbeat, savvy investors often turn to the age-old principles of supply and demand to find clarity. Enter AstraZeneca stock (NASDAQ: AZN) — a biopharmaceutical titan that has played a pivotal role in global health. It is a beacon for traders seeking to unlock the secrets hidden within its price movements.
There is a monthly demand level at $66 per share, which took control last November 2024. It's the end of January 2025, and the stock is rallying as expected.
