Seattle Genetics juicy entry point!Support zone + Side of Bollinger bands + Hammer + Divergence + Nice discount
Stockstotrade

GILEAD SCIENCES (GILD) buy signals on D1.GILEAD SCIENCES, daily timeframe: Support line + Side of Bollinger bands + Nice discount + Divergence + Hammer

UnitedHealth Group buy signals on D1.UnitedHealth Group (UNH), daily timeframe: Uptrend looks like from a book. Support line + Hammer + Hidden Divergence

MODERNA buy signals on D1.Moderna, daily timeframe: Support line + Mirror Level + Side of Bollinger Bands + Hidden Divergence + Nice discount

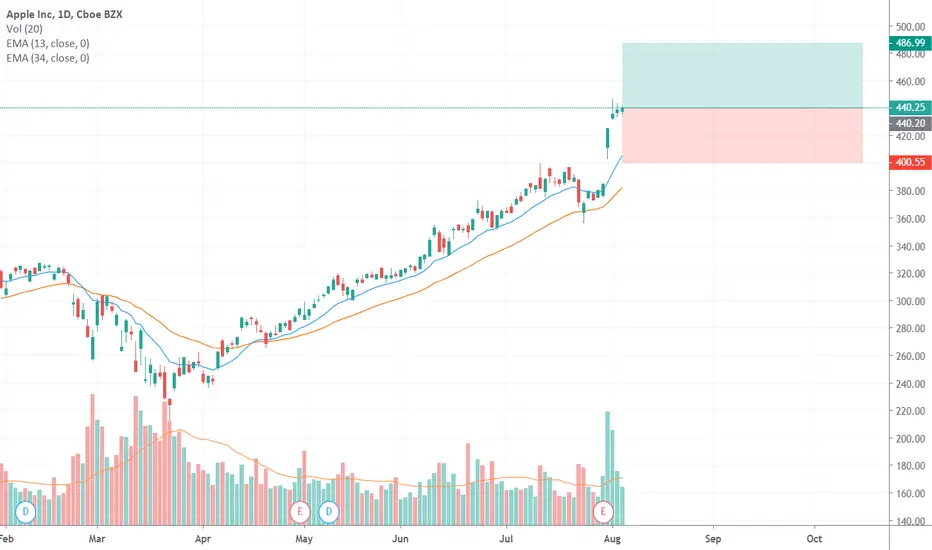
Buy Apple 6-8-2020Apple's stock is moving in a short-term bullish direction
and able to achieve new higher prices with high volumes
So we can buy
Target 487
Stop 400 losses
TESLA! Great BUY here... STILL OPEN!Yes, our strategy can also trade STOCKS! here we have a BUY indicated to us on TESLA still open and running well.
What is our strategy?
Our strategy is a trend following strategy - that is coded in pine script to use with the trading view platform - the entries are shown automatically! NOTHING is done manually, it can be used on any instrument and time frame. However, we have hard coded specific parameters for when trading the H1 time frame, so we can back up over 4200 previous trades to confirm our edge from previous data. This gives us confidence in execution and belief in our trading strategy for the long term.
The strategy simply sits in your trading view, so you will see exactly what we see - the trade, entry price, SL and multiple TPs (although we hold until opposite trade as this is the most profitable longer term plan), lot size, etc.
This could be on your phone trading view app, or laptop of course.
The hard work is done, so we have zero chart work time, no analysis, no time front of the chart doing technical analysis - technical analysis is very subjective - you may see different things at different times - how do you have a rigid trading plan on a H&S shoulder pattern? Your daily routine, diet, sleep, exercise can affect what you 'see' and your decision making, this doesn't happen when a strategy is coded like this; what we do have is a mechanical trading strategy...
What does this mean?
It means, we are very clear on our entry and our exit and use strict risk management (this is built in - put in your account size, set your risk in % or fixed amount and it will tell you what lot size to trade!) so we have no ego with our position and we are comfortable with all outcomes - its simply just another trade. This free's our mindset from worry and anxiety as we take confidence from knowing our edge is there and also that we have used sensible risk management.
The strategy itself can be used as a live trading journal too!

Virgin Galactic powerful buy signals.Virgin Galactic, D1: Support line + Side of Bollinger bands + Hammer + Hidden divergence

$KODK - Short at the gap fillFirst push towards gap fill level of 14.50 area is always good for a short. Currently at 11.6-12 during premarket session. Trapped longs from insider trader news.
Unless volume comes back in, target levels below at every 0.50 drop, T1: 14.01, T2: 13.51 etc. Ultimate target would be 11.65, though might not happen intraday. GL Tuesday
@archi_trader

PINTEREST sell signals on D1.Pinterest, daily timeframe: Resistance zone + Side of Bollinger bands + Hanging Man + Overbought

GOOGLE powerful buy signals on D1.Google, daily timeframe: Support line + Horizontal mirror level + Side of Bollinger bands + Hammer + Volume

GILEAD SCIENCES buy signals on D1.GILEAD SCIENCES, daily timeframe: Support zone + Side of Bollinger Bands + Hammer

Pfizer sell signals on D1.Pfizer, D1: Resistance zone + Side of Bollinger Bands + Hanging Man + Overbought

NextEra Energy sell signals on D1.NextEra Energy, daily timeframe: Resistance zone + Shooting Star + Bollinger Bands + Overbought

D&O green tech - top 20 jewel series of malaysia stockstop 20 jewels frm a very popular local bank...
fundamental : I don't know...
technical : let's look at some price action...
D&O green tech has been in uptrend movement since 2012-2018...after reaching peak at RM1.00 in Oct 2018, it has been trading sideway with a lower-high formed at RM0.92, in early Jan 2020 this year...during “The Big Fall” in mid March this year, the strong support at RM0.49 still holds...the rebound come back to RM0.78... a possible bullish cypher pattern formation but need to hit RM0.865 as the C leg and moving back to kill zone ranging frm RM0.525 -0.565...again, it is too early to say...
current support : RM0.70-0.78
lower support : RM0.49-0.56
strong support : RM0.43-0.49
resistance : RM0.92-1.00
in overall, D&O is still trading in a sideway consolidation...
WARNING : this is juz a trading idea...trade at your own risk!
plz like and share...

STOCK TRADING:12)MItech- top 20 jewel series of malaysia stocksTHIS IS TRADE 100) FRM HAIDOJO TRADING...
-top 20 jewels frm a very popular local bank...
-technical : let's look at some price action...
MI has been in uptrend ever since its commence in June 2018…even after the “Great Fall” in mid-March this year, MI has never stopped its uptrend and rebounded frm RM1.40 to gain over 100% plus…! MI has been in my close scrutiny bcx of its interesting uptrend…
Recent move, it has been making new structure high and reached the peak at RM4.00…
current support : RM3.50-3.30
lower support : RM3.00
resistance : RM4.00 new high
Overall, MI is still in tandem with its uptrend momentum…if no more bad news frm the market, MI is expected to move higher to form further new structure high…
WARNING : this is juz a trading idea...trade at your own risk!
**your "LIKE" and "FOLLOW" are my main source of motivation to continue posting more valuable contents...TQ**

Bull Flag&Breakout For Medtronic Plc Just Another Reason To LongMedtronic Plc has recently agreed to acquire all outstanding shares of spinal surgery device maker, Medicrea at €7.00/share, representing a 22% premium over Friday's closing price. This merger and acquisition has driven the share price to move up as well as giving the stock a promising future amidst the advent of second wave of the pandemic which most of the analysts foresee the economy to be worse than before.
Key Trading Plan:
Since the price has broken the trend line, wait for pull back to the support level of 94.67, and LONG the stock with the Take Profit Target of 104.88 (Key Resistance Level).
‼️Disclaimer: Please be advised that we are NOT Financial Advisors. We are not responsible for the results of your Forex or CFDs trading. The only person responsible for profits or losses is yourself. You should not consider any market information, educational and analytical material as trading advice that defines your trading actions but purely as educational market material. Please be advised that S.I.D. Capital shall not be liable for any errors in quotes and trading platform software errors.
‼️This Channel and all information is intended for educational purposes only and does not give financial advice. S.I.D. Capital Signals is not a service to provide legal and financial advice; any information provided here is only the personal opinion of the author (not advice or financial advice in any sense, and in the sense of any act, ordinance or law of any country) and must not be used for financial activities.

Beyond Meat buy signals on D1.Beyond Meat (BYND), daily timeframe: Mirror level + Harami + Side of Bollinger bands

Alibaba sell signals on W1.Alibaba, weekly timeframe: Resistance zone + Shooting Star + Side of Bollinger bands + Divergence

Illumina (ILMN) shares sell signalsIllumina (ILMN): weekly chart: Resistance zone + 2 Shooting Stars + Inside Bar

Charter Communications sell signals on W1Charter Communications (CHTR), Weekly timeframe: Resistance zone + Inside Bar & Shooting Star candle patterns + Divergence on RSI(14)


TESLA INC. - Timeframe: 1H Technical analysisTRENDS
Court terme: STRONGLY BULLISH TECHNICAL INDICATORS: 50% BULLISH / 0% BEARISH / 50% NEUTRAL
MY OPINION: BULLISH ABOVE 800.51 USD
MY TARGETS
862.95 USD (+6.37%)
869.82 USD (+7.21%)
MY ANALYSIS
The bullish trend is currently very strong on TESLA INC.. As long as the price remains above the support at 800.51 USD, you could try to benefit from the boom. The first bullish objective is located at 862.95 USD. The bullish momentum would be boosted by a break in this resistance. Buyers would then use the next resistance located at 869.82 USD as an objective. Crossing it would then enable buyers to target 917.42 USD. Be careful, given the powerful bullish rally underway, excesses could lead to a possible correction in the short term. If this is the case, remember that trading against the trend may be riskier. It would seem more appropriate to wait for a signal indicating reversal of the trend.
FORCE : 7.7/10
Quotes:
The TESLA INC. rating is 811.29 USD. On the day, this instrument gained -0.99% and was traded between 785.00 USD and 824.00 USD over the period. The price is currently at +3.35% from its lowest and -1.54% from its highest.
Technical:
A technical analysis in 1H of this TESLA INC. chart shows a strongly bullish trend. 92.86% of the signals given by moving averages are bullish. The overall trend is supported by the strong bullish signals from short-term moving averages. The Indicators scanner detects a bullish signal on moving averages that could impact this trend.
Numerical data:
The following are the details of the technical indicators and moving averages that were collected to generate this technical analysis:
Technical indicators:
RSI (14): 58.02
MACD (12,26,9): 9.7500
Directional Movement: 2.62
AROON (14): 21.43
DEMA (21): 818.06
Parabolic SAR (0,02-0,02-0,2): 819.55
Elder Ray (13): 3.00
Super Trend (3,10): 781.02
Zig ZAG (10): 817.90
VORTEX (21): 1.0900
Stochastique (14,3,5): 81.60
TEMA (21): 821.64
Williams %R (14): -6.76
Chande Momentum Oscillator (20): 10.03
Repulse (5,40,3): 1.7600
ROCnROLL: 1
TRIX (15,9): 0.2100
Courbe Coppock: 5.70
Moving averages:
MA7: 775.62
MA20: 755.58
MA50: 633.22
MA100: 620.35
MAexp7: 812.49
MAexp20: 804.12
MAexp50: 787.18
MAexp100: 760.04
Price / MA7: +4.60%
Price / MA20: +7.37%
Price / MA50: +28.12%
Price / MA100: +30.78%
Price / MAexp7: -0.15%
Price / MAexp20: +0.89%
Price / MAexp50: +3.06%
Price / MAexp100: +6.74%

