Narayana Hrudayalaya can turnaround from trendline. Narayana Hrudayalaya Ltd. engages in the provision of medical and health care services. It also provides services in the areas of cardiac surgery, cardiology, diabetes and endocrinology, gastroenterology, general surgery, neurosciences, facial surgery, nephrology, obstetrics and gynecology, orthopedics, oncology, pediatrics, transplant, urology, and vascular surgery; and other specialty services, such as dental, dermatology, emergency medicine, ears, nose, and throat, family medicine, general medicine, and genetic.
NH Closing price is 1945.50. The positive aspects of the company are Companies with Zero Promoter Pledge, Company able to generate Net Cash - Improving Net Cash Flow for last 2 years and FII / FPI or Institutions increasing their shareholding. The Negative aspects of the company are high Valuation (P.E. = 50.6), Stocks Underperforming their Industry Price Change in the Quarter, Increasing Trend in Non-Core Income, PEG greater than Industry PEG and MFs decreased their shareholding last quarter
Entry can be taken after closing above 1950 Historical Resistance in the stock will be 2015, 2063 and 2098. PEAK Historic Resistance in the stock will be 2148, 2195 and 2269. Stop loss in the stock should be maintained at Closing below 1863 or 1648 depending upon your risk taking ability.
Disclaimer: The above information is provided for educational purpose, analysis and paper trading only. Please don't treat this as a buy or sell recommendation for the stock or index. The Techno-Funda analysis is based on data that is more than 3 months old. Supports and Resistances are determined by historic past peaks and Valley in the chart. Many other indicators and patterns like EMA, RSI, MACD, Volumes, Fibonacci, parallel channel etc. use historic data which is 3 months or older cyclical points. There is no guarantee they will work in future as markets are highly volatile and swings in prices are also due to macro and micro factors based on actions taken by the company as well as region and global events. Equity investment is subject to risks. I or my clients or family members might have positions in the stocks that we mention in our educational posts. We will not be responsible for any Profit or loss that may occur due to any financial decision taken based on any data provided in this message. Do consult your investment advisor before taking any financial decisions. Stop losses should be an important part of any investment in equity.
Stockstowatchout

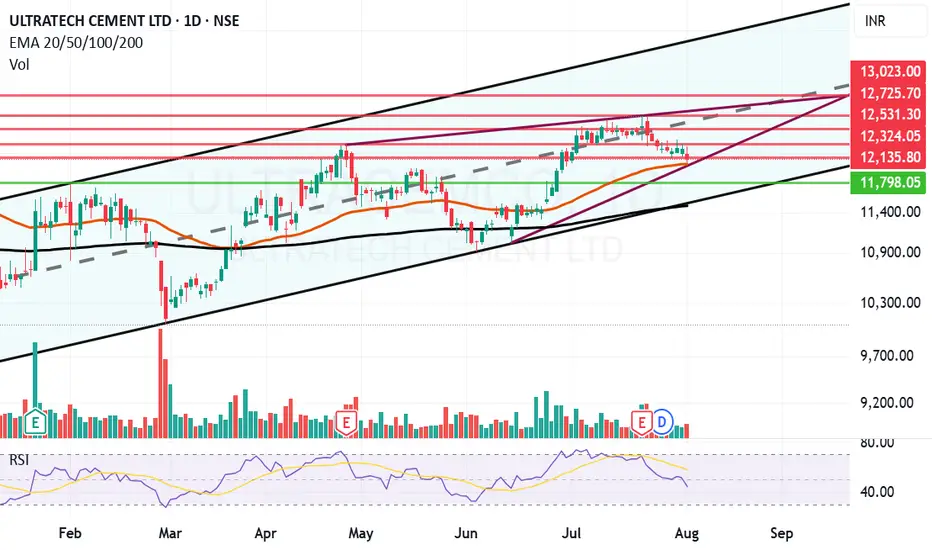
Ultratech can bounce back from Motherline support. UltraTech Cement Ltd. is a holding company, which engages in the provision of manufacture and sale of cement and cement related products.
UltraTech Cement Ltd. Closing price is 12113. The positive aspects of the company are Companies with Zero Promoter Pledge, Companies with Low Debt, FII / FPI or Institutions increasing their shareholding and MFs increased their shareholding last quarter. The Negative aspects of the company are high Valuation (P.E. = 51), Stocks Underperforming their Industry Price Change in the Quarter, RSI indicating price weakness, Increasing Trend in Non-Core Income and Declining Net Cash Flow : Companies not able to generate net cash.
Entry can be taken after closing above 12136 Historical Resistance in the stock will be 12324 and 12531. PEAK Historic Resistance in the stock will be 12725 and 13023. Stop loss in the stock should be maintained at Closing below 11798 or 11492 depending upon your risk taking ability.
Disclaimer: The above information is provided for educational purpose, analysis and paper trading only. Please don't treat this as a buy or sell recommendation for the stock or index. The Techno-Funda analysis is based on data that is more than 3 months old. Supports and Resistances are determined by historic past peaks and Valley in the chart. Many other indicators and patterns like EMA, RSI, MACD, Volumes, Fibonacci, parallel channel etc. use historic data which is 3 months or older cyclical points. There is no guarantee they will work in future as markets are highly volatile and swings in prices are also due to macro and micro factors based on actions taken by the company as well as region and global events. Equity investment is subject to risks. I or my clients or family members might have positions in the stocks that we mention in our educational posts. We will not be responsible for any Profit or loss that may occur due to any financial decision taken based on any data provided in this message. Do consult your investment advisor before taking any financial decisions. Stop losses should be an important part of any investment in equity.
Hindustan Unilever looks strong. Hindustan Unilever Ltd. engages in the manufacture of consumer goods. It operates through the following segments: Home Care, Beauty and Personal Care, Foods and Refreshments, and Others. It is one of leading company in FMCG sector.
Hindustan Unilever Closing price is 2453.60. Dividend Yield @CMP = 1.78%. The positive aspects of the company are Stocks Outperforming their Industry Price Change in the Quarter, Companies with Zero Promoter Pledge, Company able to generate Net Cash - Improving Net Cash Flow for last 2 years, FII / FPI or Institutions increasing their shareholding and MFs increased their shareholding last quarter. The Negative aspects of the company are high Valuation (P.E. = 53.9), Increasing Trend in Non-Core Income, Declining Revenue every quarter for the past 2 quarters and PEG greater than Industry PEG.
Entry can be taken after closing above 2460 Historical Resistance in the stock will be 2498 and 2534. PEAK Historic Resistance in the stock will be 2571 and 2601. Stop loss in the stock should be maintained at Closing below 2391 or 2369 depending upon your risk taking ability.
Disclaimer: The above information is provided for educational purpose, analysis and paper trading only. Please don't treat this as a buy or sell recommendation for the stock or index. The Techno-Funda analysis is based on data that is more than 3 months old. Supports and Resistances are determined by historic past peaks and Valley in the chart. Many other indicators and patterns like EMA, RSI, MACD, Volumes, Fibonacci, parallel channel etc. use historic data which is 3 months or older cyclical points. There is no guarantee they will work in future as markets are highly volatile and swings in prices are also due to macro and micro factors based on actions taken by the company as well as region and global events. Equity investment is subject to risks. I or my clients or family members might have positions in the stocks that we mention in our educational posts. We will not be responsible for any Profit or loss that may occur due to any financial decision taken based on any data provided in this message. Do consult your investment advisor before taking any financial decisions. Stop losses should be an important part of any investment in equity.

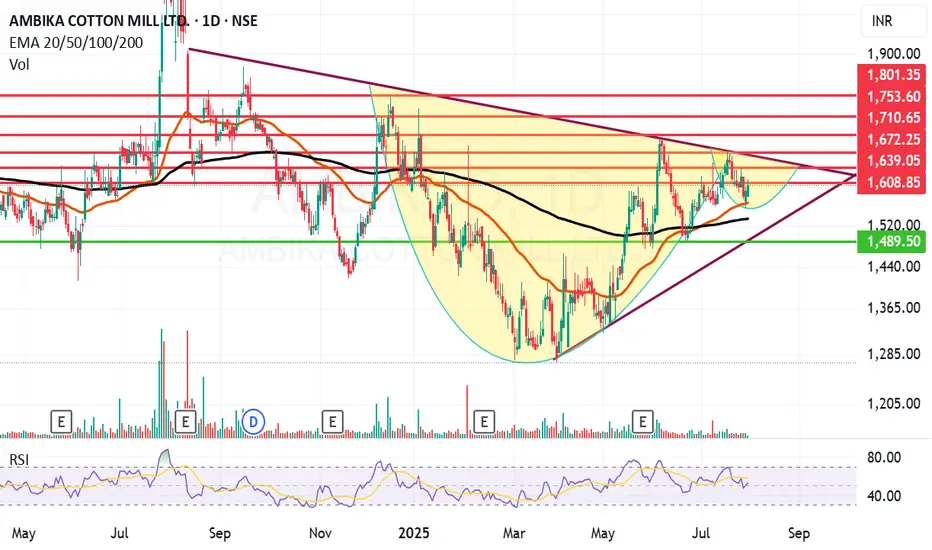
Ambika Cotton looking ambitious on the charts and fundamentally.Ambika Cotton Mills Ltd. engages in the provision of manufacturing and selling of cotton yarn catering to the needs of manufacturers of premium branded shirts and t-shirts.
Ambika Cotton Mills Ltd. Closing price is 1603.20 Dividend Yield @CMP = 2.35%. The positive aspects of the company are attractive Valuation (P.E. = 13.9), Stocks Outperforming their Industry Price Change in the Quarter, Companies with Zero Promoter Pledge, Companies with Low Debt, Rising Net Cash Flow and Cash from Operating activity and FII / FPI or Institutions increasing their shareholding. The Negative aspects of the company are Increasing Trend in Non-Core Income, Fall in Quarterly Revenue and Net Profit (YoY) and Companies with growing costs YoY for long term projects.
Entry can be taken after closing above 1609 Historical Resistance in the stock will be 1631, 1672 and 1710. PEAK Historic Resistance in the stock will be 1753 and 1801. Stop loss in the stock should be maintained at Closing below 1533 or 1489 depending upon your risk taking ability.
Disclaimer: The above information is provided for educational purpose, analysis and paper trading only. Please don't treat this as a buy or sell recommendation for the stock or index. The Techno-Funda analysis is based on data that is more than 3 months old. Supports and Resistances are determined by historic past peaks and Valley in the chart. Many other indicators and patterns like EMA, RSI, MACD, Volumes, Fibonacci, parallel channel etc. use historic data which is 3 months or older cyclical points. There is no guarantee they will work in future as markets are highly volatile and swings in prices are also due to macro and micro factors based on actions taken by the company as well as region and global events. Equity investment is subject to risks. I or my clients or family members might have positions in the stocks that we mention in our educational posts. We will not be responsible for any Profit or loss that may occur due to any financial decision taken based on any data provided in this message. Do consult your investment advisor before taking any financial decisions. Stop losses should be an important part of any investment in equity.
Wipro in recovery mode on monthly chart.Wipro Ltd. is a global information technology, consulting and outsourcing company, which engages in the development and integration of solutions.
Wipro Closing price is 249.67. The positive aspects of the company are Attractive Valuation (P.E. = 19.9), Companies with Zero Promoter Pledge, Companies with Low Debt, Annual Profit Growth higher than Sector Profit Growth, Company able to generate Net Cash - Improving Net Cash Flow for last 2 years and FII / FPI or Institutions increasing their shareholding. The Negative aspects of the company are Stocks Underperforming their Industry Price Change in the Quarter, Promoter decreasing their shareholding, Increasing Trend in Non-Core Income and MFs decreased their shareholding last quarter.
Entry can be taken after closing above 251 Historical Resistance in the stock will be 257 and 277. PEAK Historic Resistance in the stock will be 292 and 312. Stop loss in the stock should be maintained at Closing below 227.
Disclaimer: The above information is provided for educational purpose, analysis and paper trading only. Please don't treat this as a buy or sell recommendation for the stock or index. The Techno-Funda analysis is based on data that is more than 3 months old. Supports and Resistances are determined by historic past peaks and Valley in the chart. Many other indicators and patterns like EMA, RSI, MACD, Volumes, Fibonacci, parallel channel etc. use historic data which is 3 months or older cyclical points. There is no guarantee they will work in future as markets are highly volatile and swings in prices are also due to macro and micro factors based on actions taken by the company as well as region and global events. Equity investment is subject to risks. I or my clients or family members might have positions in the stocks that we mention in our educational posts. We will not be responsible for any Profit or loss that may occur due to any financial decision taken based on any data provided in this message. Do consult your investment advisor before taking any financial decisions. Stop losses should be an important part of any investment in equity.

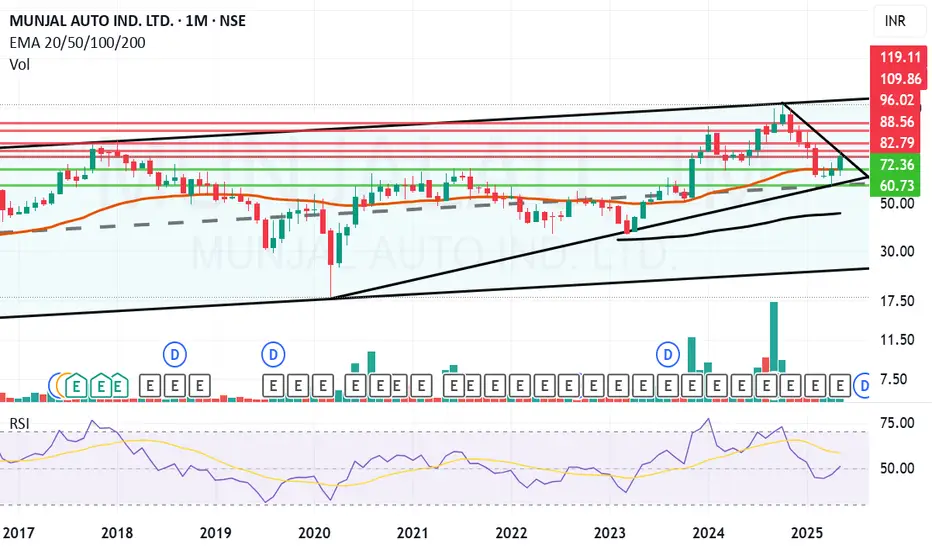
Munjal Auto giving a Breakout on Monthly chart. Munjal Auto Industries Ltd. engages in the production of automobile components. It operates through the Auto Components and Composite Products and Molds segments. It manufactures exhaust systems for two wheelers and four wheelers, spoke rims for two wheelers, steel wheel rims for two wheelers and four wheelers, fuel tanks for four wheelers, sheet metal components, seat frames for four wheelers, and other automotive assemblies.
Munjal Auto Closing price is 82.98. The positive aspects of the company are Companies with Zero Promoter Pledge, Companies with Low Debt and FII / FPI or Institutions increasing their shareholding. The Negative aspects of the company is Stocks Underperforming their Industry Price Change in the Quarter.
Entry can be taken after closing above 83 Historical Resistance in the stock will be 88.5 and 96. PEAK Historic Resistance in the stock will be 109 and 119. Stop loss in the stock should be maintained at Closing below 72.3 or 60.7 depending upon your risk taking ability.
Disclaimer: The above information is provided for educational purpose, analysis and paper trading only. Please don't treat this as a buy or sell recommendation for the stock or index. The Techno-Funda analysis is based on data that is more than 3 months old. Supports and Resistances are determined by historic past peaks and Valley in the chart. Many other indicators and patterns like EMA, RSI, MACD, Volumes, Fibonacci, parallel channel etc. use historic data which is 3 months or older cyclical points. There is no guarantee they will work in future as markets are highly volatile and swings in prices are also due to macro and micro factors based on actions taken by the company as well as region and global events. Equity investment is subject to risks. I or my clients or family members might have positions in the stocks that we mention in our educational posts. We will not be responsible for any Profit or loss that may occur due to any financial decision taken based on any data provided in this message. Do consult your investment advisor before taking any financial decisions. Stop losses should be an important part of any investment in equity.
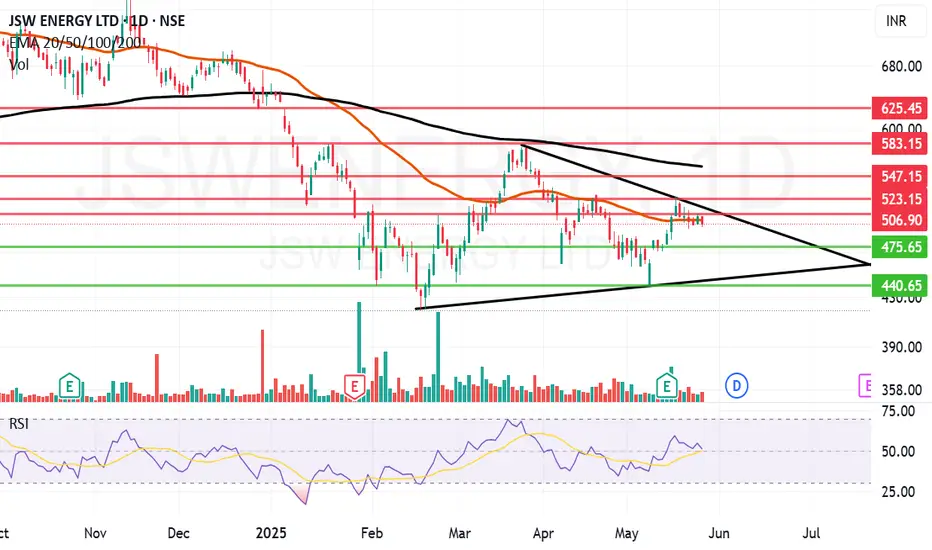
JSW Energy trying to gain some energy and momentum.JSW Energy Ltd. engages in the business of power generation. It operates through the following business segments: Power Generation, Power Transmission, and Power Trading. The company was founded by Om Prakash Jindal on March 10, 1994 and is headquartered in Mumbai, India.
JSW Energy Ltd. Closing price is 497.4. The positive aspects of the company are Annual Net Profits improving for last 2 years, Consistent Highest Return Stocks over Five Years and MFs increased their shareholding last quarter. The Negative aspects of the company are high Valuation (P.E. = 45.2), Stocks Underperforming their Industry Price Change in the Quarter, Increasing Trend in Non-Core Income, Companies with Increasing Debt, Promoter decreasing their shareholding and Companies with high market cap, lower public shareholding.
Entry can be taken after closing above 507 Historical Resistance in the stock will be 528, 547 and 567. PEAK Historic Resistance in the stock will be 583 and 625. Stop loss in the stock should be maintained at Closing below 475 or 440 depending upon your risk taking ability.
Disclaimer: The above information is provided for educational purpose, analysis and paper trading only. Please don't treat this as a buy or sell recommendation for the stock or index. The Techno-Funda analysis is based on data that is more than 3 months old. Supports and Resistances are determined by historic past peaks and Valley in the chart. Many other indicators and patterns like EMA, RSI, MACD, Volumes, Fibonacci, parallel channel etc. use historic data which is 3 months or older cyclical points. There is no guarantee they will work in future as markets are highly volatile and swings in prices are also due to macro and micro factors based on actions taken by the company as well as region and global events. Equity investment is subject to risks. I or my clients or family members might have positions in the stocks that we mention in our educational posts. We will not be responsible for any Profit or loss that may occur due to any financial decision taken based on any data provided in this message. Do consult your investment advisor before taking any financial decisions. Stop losses should be an important part of any investment in equity.
MSumi Wiring trying to wire up to old levelsMotherson Sumi Wiring India Ltd. engages in the manufacture and sale of wire harnesses, components, and wires to automotive original equipment manufacturers. The company was founded on July 2, 2020 and is headquartered in Mumbai, India.
Motherson Sumi Wiring India Ltd. Closing price is 59.35. The positive aspects of the company are Stocks Outperforming their Industry Price Change in the Quarter, Companies with Zero Promoter Pledge, Companies with Low Debt and FII / FPI or Institutions increasing their shareholding. The Negative aspects of the company are high Valuation (P.E. = 43.1), Increasing Trend in Non-Core Income, Declining Net Cash Flow : Companies not able to generate net cash, Companies with growing costs YoY for long term projects and MFs decreased their shareholding last quarter.
Entry can be taken after closing above 60 Historical Resistance in the stock will be 62.3 and 66.2. PEAK Historic Resistance in the stock will be 69.6 and 72.7. Stop loss in the stock should be maintained at Closing below 55.3 or 53.9 depending upon your risk taking ability.
Disclaimer: The above information is provided for educational purpose, analysis and paper trading only. Please don't treat this as a buy or sell recommendation for the stock or index. The Techno-Funda analysis is based on data that is more than 3 months old. Supports and Resistances are determined by historic past peaks and Valley in the chart. Many other indicators and patterns like EMA, RSI, MACD, Volumes, Fibonacci, parallel channel etc. use historic data which is 3 months or older cyclical points. There is no guarantee they will work in future as markets are highly volatile and swings in prices are also due to macro and micro factors based on actions taken by the company as well as region and global events. Equity investment is subject to risks. I or my clients or family members might have positions in the stocks that we mention in our educational posts. We will not be responsible for any Profit or loss that may occur due to any financial decision taken based on any data provided in this message. Do consult your investment advisor before taking any financial decisions. Stop losses should be an important part of any investment in equity.

Premier Explosives is exploding on charts. Premier Explosives Ltd. engages in the manufacture of explosives, detonators, propellants, services, and other traded items. Its product portfolio includes defense products and commercial explosives. Premier Explosives Ltd. Closing price is 493.50.
The positive aspects of the company are Companies with Low Debt, Strong cash generating ability from core business - Improving Cash Flow from operation, Companies with Zero Promoter Pledge, RSI indicating price strength and FII / FPI or Institutions increasing their shareholding. The Negative aspects of the company are high Valuation (P.E. = 83.7), Stocks Underperforming their Industry Price Change in the Quarter, Companies with growing costs YoY for long term projects and MFs decreased their shareholding last quarter.
Entry can be taken after closing above 496 Historical Resistance in the stock will be 530, 583 and 605. PEAK Historic Resistance in the stock will be 633 and 673. Stop loss in the stock should be maintained at Closing below 429 or 405 depending upon your risk taking ability.
Disclaimer: The above information is provided for educational purpose, analysis and paper trading only. Please don't treat this as a buy or sell recommendation for the stock or index. The Techno-Funda analysis is based on data that is more than 3 months old. Supports and Resistances are determined by historic past peaks and Valley in the chart. Many other indicators and patterns like EMA, RSI, MACD, Volumes, Fibonacci, parallel channel etc. use historic data which is 3 months or older cyclical points. There is no guarantee they will work in future as markets are highly volatile and swings in prices are also due to macro and micro factors based on actions taken by the company as well as region and global events. Equity investment is subject to risks. I or my clients or family members might have positions in the stocks that we mention in our educational posts. We will not be responsible for any Profit or loss that may occur due to any financial decision taken based on any data provided in this message. Do consult your investment advisor before taking any financial decisions. Stop losses should be an important part of any investment in equity.

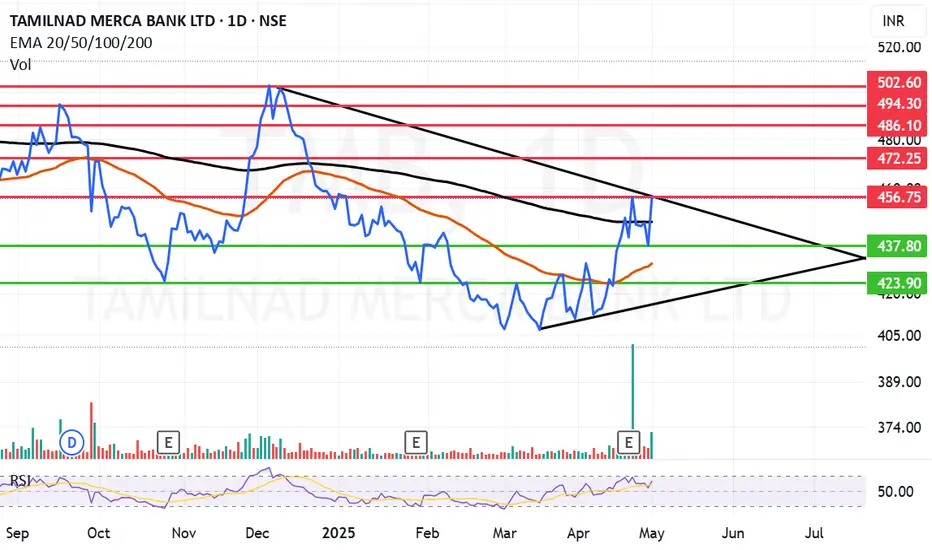
Tamilnad Merca Bank trying to rise with volumes.Tamilnad Mercantile Bank Ltd. engages in the provision of banking services. It offers loan products, current accounts, business and prepaid cards, online and foreign exchange services. It operates through the following business segments: Treasury, Corporate/Wholesale Banking, and Retail Banking.
Tamilnad Mercantile Bank Ltd. Closing price is 456.10. The positive aspects of the company are Very Attractive Valuation (P.E. = 6.1), Companies with Zero Promoter Pledge, Companies with Low Debt, Company able to generate Net Cash - Improving Net Cash Flow, FII / FPI or Institutions increasing their shareholding and Mutual Funds Increased Shareholding over the Past Two Months. The Negative aspects of the company are Stocks Underperforming their Industry Price Change in the Quarter, Declining profits every quarter for the past 2 quarters and Increase in Provisions in Recent Results.
Entry can be taken after closing above 457 Historical Resistance in the stock will be 472 and 486. PEAK Historic Resistance in the stock will be 494 and 502. Stop loss in the stock should be maintained at Closing below 437 or 423 depending upon your risk taking ability.
Disclaimer: The above information is provided for educational purpose, analysis and paper trading only. Please don't treat this as a buy or sell recommendation for the stock or index. The Techno-Funda analysis is based on data that is more than 3 months old. Supports and Resistances are determined by historic past peaks and Valley in the chart. Many other indicators and patterns like EMA, RSI, MACD, Volumes, Fibonacci, parallel channel etc. use historic data which is 3 months or older cyclical points. There is no guarantee they will work in future as markets are highly volatile and swings in prices are also due to macro and micro factors based on actions taken by the company as well as region and global events. Equity investment is subject to risks. I or my clients or family members might have positions in the stocks that we mention in our educational posts. We will not be responsible for any Profit or loss that may occur due to any financial decision taken based on any data provided in this message. Do consult your investment advisor before taking any financial decisions. Stop losses should be an important part of any investment in equity.
CHSN Price Watch: Critical Levels to MonitorCHSN is approaching a key decision point. If we see a confirmed break above the $0.33 high, there’s strong potential for a move up to $0.58, with $0.75 as a possible extension.
On the flip side, if the price breaks below the $0.29 low, we could see a retracement down to the $0.21 level.
Kris/Mindbloome Exchange
Trade Smarter Live Better

Watch This Before Trading Delta Airlines Stock in 2025!The Art of Trading: Price Action, Supply and Demand, and Patience in Delta Airlines. Trading in the stock market is a skill that requires a deep understanding of market dynamics, disciplined decision-making, and the ability to remain patient in the face of volatility. Among the most effective strategies for achieving consistent success are price action analysis, supply and demand principles, and meticulous money management. This supply and demand stock analysis will explore how these strategies can be applied to Delta Airlines (DAL), focusing on key price levels, candlestick patterns, and the importance of patience in making informed investment decisions.
A strong demand level for Delta Airlines (DAL) has been identified at $43. This level represents a price zone where buyers have historically shown significant interest, leading to price reversals. By waiting for the stock to retrace to this level, traders can enter positions with a higher probability of success as the likelihood of renewed buying pressure increases.

Jyoti CNC Trying to make a comeback. Jyoti CNC Automation Ltd. engages in the provision of manufacturing solutions for computerized machine cutting tools. It operates under the Within India and Outside India geographical segments.
Jyoti CNC Automation Ltd. CMP is 1273.05. The Positive aspects of the company are Company with Low Debt, Company able to generate Net Cash - Improving Net Cash Flow for last 2 years and Companies with rising net profit margins. The Negative aspects of the company are extremely high Valuation (P.E. = 105.5), High promoter stock pledges, Increasing Trend in Non-Core Income and Companies with growing costs YoY for long term projects.
Entry can be taken after closing above 1293Targets in the stock will be 1337, 1368 and 1406. The long-term target in the stock will be 1434, 1463 and 1513. Stop loss in the stock should be maintained at Closing below 1157 or 1079 depending on your risk taking ability.
Disclaimer: The above information is provided for educational purpose, analysis and paper trading only. Please don't treat this as a buy or sell recommendation for the stock or index. We do not guarantee any success in highly volatile market or otherwise. Stock market investment is subject to market risks which include global and regional risks. I or my clients might have positions in the stocks that we mention in our posts. We will not be responsible for any Profit or loss that may occur due to any financial decision taken based on any data provided in this message. Do consult your investment advisor before taking any financial decisions. Stop losses should be an important part of any investment in equity.

Good Results makes Reliance a great oppertunityReliance Industries Ltd. engages in hydrocarbon exploration and production, petroleum refining and marketing, petrochemicals, retail, FMCG, and telecommunications, Digital Entertainment and Media. Reliance is one of the biggest Indian companies and vivid sectoral presence.
Reliance Industries Ltd. CMP is 1302.35. The Positive aspects of the company are Company with Low Debt, Company with Zero Promoter Pledge, Annual Net Profits improving for last 2 years. The Negative aspects of the company are high Valuation (P.E. = 25.5) and Declining Net Cash Flow.
Entry can be taken after closing above 1303 Targets in the stock will be 1355, 1378, 1414 and 1451. The long-term target in the stock will be 1522 and 1556+ Stop loss in the stock should be maintained at Closing below 1184.
Disclaimer: The above information is provided for educational purpose, analysis and paper trading only. Please don't treat this as a buy or sell recommendation for the stock or index. We do not guarantee any success in highly volatile market or otherwise. Stock market investment is subject to market risks which include global and regional risks. I or my clients might have positions in the stocks that we mention in our posts. We will not be responsible for any Profit or loss that may occur due to any financial decision taken based on any data provided in this message. Do consult your investment advisor before taking any financial decisions. Stop losses should be an important part of any investment in equity.

Ambika Cotton Looking strong on weekly chart. Ambika Cotton Mills Ltd. engages in the provision of manufacturing and selling of cotton yarn catering to the needs of manufacturers of premium branded shirts and t-shirts.
Ambika Cotton Mills Ltd. CMP is 1581.05. The Positive aspects of the company are Attractive Valuation (P.E. = 14), Company with Zero Promoter Pledge, Company with Low Debt and FII / FPI or Institutions increasing their shareholding. The Negative aspects of the company are Increasing Trend in Non-Core Income, Stocks Underperforming their Industry Price Change in the Quarter, and Annual net profit declining for last 2 years.
Entry can be taken after closing above 1589 and compounding above 1630 closing. Targets in the stock will be 1714 and 1760. The long-term target in the stock will be 1868 and 1906+. Stop loss in the stock should be maintained at Closing below 1467 or 1382 depending on your risk taking ability.
Disclaimer: The above information is provided for educational purpose, analysis and paper trading only. Please don't treat this as a buy or sell recommendation for the stock or index. We do not guarantee any success in highly volatile market or otherwise. Stock market investment is subject to market risks which include global and regional risks. I or my clients might have positions in the stocks that we mention in our posts. We will not be responsible for any Profit or loss that may occur due to any financial decision taken based on any data provided in this message. Do consult your investment advisor before taking any financial decisions. Stop losses should be an important part of any investment in equity.

PGHL searching for a breakout.Procter & Gamble Health Limited is one of India’s largest VMS Companies manufacturing and marketing over-the-counter products, vitamins, minerals, and supplements products for a healthy lifestyle and improved quality of life.
Procter & Gamble Health Ltd. CMP is 5258.5. The Positive aspects of the company are Company with No Debt, Company with Zero Promoter Pledge and Growth in Net Profit with increasing Profit Margin. The Negative aspects of the company are high Valuation (P.E. = 40.1).
Entry can be taken after closing above 5264. Targets in the stock will be 5333 and 5477. The long-term target in the stock will be 5565 and 5600+. Stop loss in the stock should be maintained at Closing below 5156 or 4956 depending on your risk taking ability.
Disclaimer: The above information is provided for educational purpose, analysis and paper trading only. Please don't treat this as a buy or sell recommendation for the stock or index. We do not guarantee any success in highly volatile market or otherwise. Stock market investment is subject to market risks which include global and regional risks. I or my clients might have positions in the stocks that we mention in our posts. We will not be responsible for any Profit or loss that may occur due to any financial decision taken based on any data provided in this message. Do consult your investment advisor before taking any financial decisions. Stop losses should be an important part of any investment in equity.

Delta Corp forming a bottom. Delta Corp. Ltd. (India) engages in the business of gaming and entertainment. The firm owns and manages casinos in India. It operates through the following segments: Gaming, Online Skill Gaming, and Hospitality.
Delta Corp. Ltd. (India) CMP is 118.93. The Positive aspects of the company are Moderate Valuation (P.E. = 20.5), Company with No Debt, Company with Zero Promoter Pledge, The Negative aspects of the company are Increasing Trend in Non-Core Income, Declining Net Cash Flow : Companies not able to generate net cash, Companies with growing costs YoY for long term projects and De-growth in Revenue and Profit.
Entry can be taken after closing above 125.25. Targets in the stock will be 125, 129, 131 and 141. The long-term target in the stock will be 149 and 156. Stop loss in the stock should be maintained at Closing below 108 or 104 depending on your risk taking ability.
Disclaimer: The above information is provided for educational purpose, analysis and paper trading only. Please don't treat this as a buy or sell recommendation for the stock or index. We do not guarantee any success in highly volatile market or otherwise. Stock market investment is subject to market risks which include global and regional risks. I or my clients might have positions in the stocks that we mention in our posts. We will not be responsible for any Profit or loss that may occur due to any financial decision taken based on any data provided in this message. Do consult your investment advisor before taking any financial decisions. Stop losses should be an important part of any investment in equity.

Aadhar Housing looks enticing. Aadhar Housing Finance Ltd. engages in the provision of home loans. It also offers loans to customers including individuals, Companies, Corporations, Societies or Association of Persons for purchase; construction; repair and renovation of residential property.
Aadhar Housing Finance Ltd. CMP is 434.25. The positive aspects of the company are Stocks Outperforming their Industry Price Change in the Quarter, Decrease in Provision in recent results, Company with Zero Promoter Pledge and Annual Net Profits improving for last 2 years. The Negative aspects of the company are Moderately High Valuation (P.E. = 22.4), Poor cash generated from core business - Declining Cash Flow from Operations for last 2 years and Companies with high market cap, lower public shareholding.
Entry can be taken after closing above 439 Targets in the stock will be 453, 468 and 480. The long-term target in the stock will be 495 and 518. Stop loss in the stock should be maintained at Closing below 399 or 375 depending upon your risk taking ability.
Disclaimer: The above information is provided for educational purpose, analysis and paper trading only. Please don't treat this as a buy or sell recommendation for the stock. We do not guarantee any success in highly volatile market or otherwise. Stock market investment is subject to market risks which include global and regional risks. We will not be responsible for any Profit or loss that may occur due to any financial decision taken based on any data provided in this message.

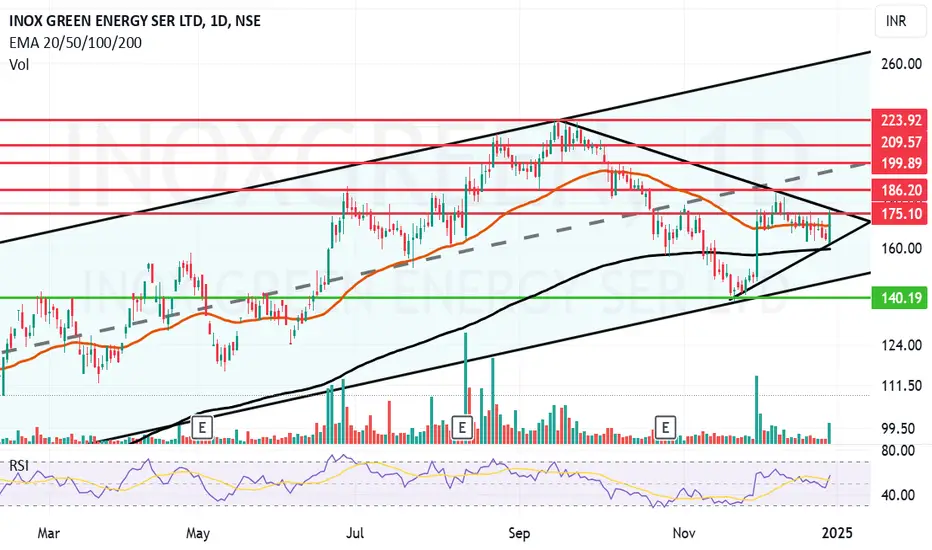
Inox green looking clean. Inox Green Energy Services Ltd. provides wind power operation and maintenance services. The company is engaged in the business of providing long-term O&M services for wind farm projects,
Inox Green Energy Services Ltd. CMP is 175.19. The positive aspects of the company are Company with Low Debt, Company able to generate Net Cash - Improving Net Cash Flow for last 2 years, Company with decreasing Promoter pledge, Annual Profit Growth higher than Sector Profit Growth and Negative to Positive growth in Sales and Profit. The Negative aspects of the company are extremely Highest Valuation (P.E. = 214.8) and Increasing Trend in Non-Core Income.
Entry can be taken after closing above 176 Targets in the stock will be 186 and 199. The long-term target in the stock will be 209 and 223. Stop loss in the stock should be maintained at Closing below 159 or 140 depending upon your risk taking ability.
Disclaimer: The above information is provided for educational purpose, analysis and paper trading only. Please don't treat this as a buy or sell recommendation for the stock. We do not guarantee any success in highly volatile market or otherwise. Stock market investment is subject to market risks which include global and regional risks. We will not be responsible for any Profit or loss that may occur due to any financial decision taken based on any data provided in this message.
Gallantt Ispat looking to gallop ahead. Gallant Ispat Ltd. engages in the manufacture of steel and steel products. It operates through the following segments: Agro, Iron and Steel, Power, and Real Estate.
Gallantt Ispat Ltd. CMP is 352.55. The positive aspects of the company are Company with Low Debt, Growth in Quarterly Net Profit with increasing Profit Margin (YoY). The Negative aspects of the company are High Valuation (P.E. = 26.7), High promoter stock pledges and Increasing Trend in Non-Core Income.
Entry can be taken after closing above 356 Targets in the stock will be 366 and 377. The long-term target in the stock will be 390 and 400. Stop loss in the stock should be maintained at Closing below 334 or 297 depending upon your risk taking ability.
Disclaimer: The above information is provided for educational purpose, analysis and paper trading only. Please don't treat this as a buy or sell recommendation for the stock. We do not guarantee any success in highly volatile market or otherwise. Stock market investment is subject to market risks which include global and regional risks. We will not be responsible for any Profit or loss that may occur due to any financial decision taken based on any data provided in this message.

Tolins Tyre looking to tilt the scale. Tolins Tyres Ltd. engages in the manufacture and sale of tires & accessories. It’s products include two-wheeler, three- wheelers, light commercial vehicle and agricultural tyres, pre-cured tread rubber and other accessories including bonding gum, tyre flap, vulcanizing solutions.
Tolins Tyres Ltd. CMP is 210.97. The positive aspects of the company are Company with Zero Promoter Pledge, The Negative aspects of the company are High Valuation (P.E. = 26.2), Increasing Trend in Non-Core Income.
Entry can be taken after closing above 212 Targets in the stock will be 222, 228 and 244. The long-term target in the stock will be 251 and 258. Stop loss in the stock should be maintained at Closing below 193 or 173 depending upon your risk taking ability.
Disclaimer: The above information is provided for educational purpose, analysis and paper trading only. Please don't treat this as a buy or sell recommendation for the stock. We do not guarantee any success in highly volatile market or otherwise. Stock market investment is subject to market risks which include global and regional risks. We will not be responsible for any Profit or loss that may occur due to any financial decision taken based on any data provided in this message.

Devyani International can give a tasty breakout. Devyani International Ltd. engages in the development and operation of quick service restaurant. It operates through Within India and Outside India segments. The company manages brands like Costa Coffee, KFC, Pizza Hut, Vangoo and The Good Street.
Devyani International Ltd. CMP is 172.37. The Positive aspects of the company is Company with Zero Promoter Pledge and increasing revenues for last 4 Quarters. Book value of the share is also increasing for the last 2 years. The Negative aspects of the company are extremely high Valuation (P.E. = 644.2), Companies Increasing Debt as per Annual Report, Declining Net Cash Flow : Companies not able to generate net cash.
Entry can be taken after closing above 174 Targets in the stock will be 181, 188 and 198. The long-term target in the stock will be 205, 218 and 223. Stop loss in the stock should be maintained at Closing below 167 or 158 depending on your risk taking ability.
Disclaimer: The above information is provided for educational purpose, analysis and paper trading only. Please don't treat this as a buy or sell recommendation for the stock. We do not guarantee any success in highly volatile market or otherwise. Stock market investment is subject to market risks which include global and regional risks. We will not be responsible for any Profit or loss that may occur due to any financial decision taken based on any data provided in this message.

Cyient DLM looking like it will deliver. Cyient DLM Ltd. engages in providing total electronic manufacturing solutions. It operates through the following segments: Aerospace and Defense, Medical, Industrial, and Transportation and Telecom. It offers design-led manufacturing (DLM) solutions.
Cyient DLM Ltd. CMP is 677.85. The Positive aspects of the company are Company with Low Debt, Company with Zero Promoter Pledge. The Negative aspects of the company are extremely high Valuation (P.E. = 79.8) and Inefficient use of shareholder funds.
Entry can be taken after closing above 686 Targets in the stock will be 722, 747 and 775. The long-term target in the stock will be 802, 841 and 869. Stop loss in the stock should be maintained at Closing below 649 or 599 depending on your risk taking ability.
Disclaimer: The above information is provided for educational purpose, analysis and paper trading only. Please don't treat this as a buy or sell recommendation for the stock. We do not guarantee any success in highly volatile market or otherwise. Stock market investment is subject to market risks which include global and regional risks. We will not be responsible for any Profit or loss that may occur due to any financial decision taken based on any data provided in this message.
