Only the beginning Hi during my analysis of DJI I have seen multiple indicators to lead me to my conclusion that the market will continue in a downward direction. First off is there was a trading gap at the 15k level that has never been addressed and will eventually be filled. There is never a time frame but taking into consideration that the market is making bearish moves downward this would make most sense to happen in the near future. Also there was significant bearish divergence leading up to the crash which in turn means that it had a long period of time to build up and now we are going to experience the aftermath. Currently we have bounced right on the .5 Fibonacci line but I believe this to be temporary because no market can reverse vertically, and has never in history. Even in the 08 market crash there was a reversal pattern known as a inverse H&S which played out amazingly but in our current situation I can see no reversal patterns present. I believe that the market will continue to go down to the 15340 level and maybe form sometime of reversal there, but if not then 12035 level is more like the outlook. This is the .382 Fib and .236 Fib respectively. The longest running bull-market in history looks to have ended and the corresponding bear-market looks to have entered.
Thank you all for your time and good luck on your trades!!!!
-Robbby
Stockstrading

Buy ETRN 15/11/2021You can buy ETRN target 11.5 stop loss 10
Money management your responsibility.
I recommend entering a maximum of 10% of the portfolio.
Good luck

ENLC BuyLooking at a day trade position on ENLC, it's following my strategy entry requirements, and it's also showing some hidden bullish divergence. This is just my opinion and idea for a stock, and this is not financial advice. Let me know what you think and let's see what happens with the trade.

Buy MMAT 1/11/2021You can buy MMAT target 6.78 stop loss 4
Money management your responsibility.
I recommend entering a maximum of 10% of the portfolio.
Good luck

Microsoft | Fundamental Analysis | Must Read...Microsoft's stock price reached an all-time high after the tech behemoth published its first-quarter earnings report last Tuesday. The company's revenue increased 22% year-over-year to $45.3 billion, beating analysts' forecasts by $1.3 billion. Adjusted earnings surged 25% to $2.27 per share, $0.19 above expectations.
For the second quarter, Microsoft management expects revenue growth of 16% to 18% year-over-year, which also beat analysts' expectations of 14%.
Microsoft's performance is majestic, but some investors may not crave to buy its stock after its price has already risen almost 50% in 2021. Let's look at a few reasons to buy Microsoft stock, as well as one argument for selling it, to see if it is still an attractive investment at these prices.
First and foremost, of course, is the growth of Microsoft Cloud Computing.
Microsoft's dramatic growth over the past seven years has been booste by the expansion of its cloud services, particularly Azure, Office 365, Dynamics, LinkedIn, and other cloud software. The business records the performance of these businesses together as "Microsoft Cloud."
In the first quarter, Microsoft Cloud's revenue grew 36% year over year to $20.7 billion, matching the 36% growth rate in the fourth quarter.
Revenue from Azure, the most thoroughly supervised segment of Microsoft Cloud, grew 48% on a constant currency basis. That represents an acceleration from Azure's 45% growth on a constant currency basis in the fourth quarter and should allay fears of a possible slowdown.
Azure's share of the global cloud infrastructure market also grew from 19% to 21% between the third quarters of 2020 and 2021, according to Canalys. That puts it in second place behind Amazon Web Services (AWS), whose year-over-year market share was unchanged at 32%.
Microsoft probably could not have achieved this growth without Satya Nadella, who took over as third CEO in 2014 and aggressively expanded these services with his mantra "mobile first, cloud first."
Second, we should not forget the recovery of favorable trends.
Over the past few years, Microsoft has become a fast-growth company again, but it continues to return tens of billions of dollars to its investors.
During the pandemic, several Microsoft enterprise services, including Office 365 Commercial, Dynamics 365, and LinkedIn Marketing Solutions, were disrupted as businesses closed.
However, as businesses resumed operations, those factors eased. In the first quarter, Office 365 and Dynamics 365 provided an acceleration in growth on a constant currency basis, and LinkedIn Marketing continued to grow.
The growth of these "resurgent" segments, along with the continued growth of Azure and other cloud services, is offsetting the slowdown in Microsoft's Surface and Xbox units, which suffered from chip shortages and other supply chains constraints in the first quarter.
Finally, it's returning a lot of cash to shareholders.
In the fiscal year 2021, Microsoft spent more than $39 billion on dividends and stock buybacks, accounting for about 70% of free cash flow (FCF). The company will spend another $10.9 billion, or 58% of FCF, on both activities in the first quarter of 2022.
Microsoft's forward dividend yield of 0.8% won't drag serious investors, but the company has reduced its stock by nearly 10% over the past seven years, offsetting the dilution from stock-based compensation plans.
Still, there is one single reason to sell Microsoft: its valuation.
Today Microsoft is worth $2.4 trillion, about eight times its market value of $300 billion when Satya Nadella became its CEO.
The company's stock currently trades at 13 times this year's sales forecast and 35 times its earnings forecast. Those estimates are slightly overstated compared to analysts' expectations for sales growth of 14% and earnings growth of 9% this year.
Massive market capitalization and high valuations could make it tough for Microsoft to repeat its multiple growth over the past seven years.
Microsoft stock is priced very high, but bears have been sounding the alarm about th is for years while the company's stock has been soaring. Still, most would agree that Microsoft deserves such a high valuation because it is still a perfect long-term investment that will continue to profit from the expanding cloud services market.

$HYLN - Hyliion Holdings Corps. Investment idea 💡 $HYLN popping up soon, here are the targets..
⚠️ - This idea is based on my technical analysis only. Do your research and trade on your own risk!

IBM | Fundamental Analysis | Must Read...IBM shares fell nearly 10 percent to a seven-month low on Oct. 21 after the tech behemoth released a weak Q3 report.
IBM's revenues rose just 0.3 percent from a year earlier to $17.6 billion, $190 million less than forecasts. But excluding divestitures and foreign exchange rates, the company's revenues were down 0.2%.
Excluding the impending Kyndryl spin-off, IBM's revenue was up 2.5% in the period. Excluding divested businesses and foreign exchange rates, "excluding Kyndryl" earnings were up 1.9%.
IBM's GAAP earnings, which include Kyndryl spin-off expenses, fell 34% to $1.25 per share. Non-GAAP earnings, which exclude those expenses, still fell 2% to $2.52 per share, but beat forecasts by one penny.
IBM's performance was unimpressive, but it was in line with the outlook the company presented at an investor briefing in early October. Did investors exaggerate IBM's disappointing third-quarter report and create a new buying opportunity?
As in previous quarters, IBM reported third-quarter earnings in five main segments: cloud and cognitive software, global business services, global technology services, systems, and global finance.
IBM's cloud and cognitive software revenues grew thanks to double-digit growth in its cloud-related business, which offset low growth in its applications business and lower revenues in its transaction processing business.
The global business services segment profited from strong demand for cloud services, consulting, application management, and global technology services.
However, the Global Technology Services division weakened again, as weak growth in cloud services could not offset the continued decline in the Managed Infrastructure Services segment, which will be taken out by the Kyndryl spin-off.
The company's systems division struggled because of cyclically declining sales of IBM Z and Power systems, and financing revenues declined amid lower demand for financing services and slow sales of used equipment.
Once again, IBM's strengths failed to offset vulnerabilities, and investors were left attempting to find positives in lackluster reporting segments. However, this may all change as the "old" IBM ceases to exist.
After IBM spins off from Kyndryl next week, it will present four new reporting segments: consulting (29% of continuing operations revenue in 2020), software (42%), infrastructure (25%), and finance (2%).
IBM thinks these four segments will make it easier for investors to track the expansion of its faster-growing businesses.
IBM expects the software segment, which includes Red Hat and other hybrid cloud and artificial intelligence services, to be a major growth driver.
It also probably anticipates a streamlined consulting segment to better stand up to faster IT services and consulting companies, such as Accenture and Globant.
IBM's infrastructure business, which includes the legacy systems business as well as other hardware products and services, is likely to remain underperforming. However, IBM's earnings outlook suggests that the company will focus on streamlining its business and cutting costs to improve margins.
IBM believes that after the Kyndryl spin-off, it will deliver "sustained mid-single-digit revenue growth" from 2022 to 2024.
The company believes this growth to be driven by the expansion of hybrid cloud and AI services that can be integrated with public cloud platforms such as Amazon Web Services (AWS) and Microsoft Azure.
IBM probably realizes that it is too late to catch up with AWS and Azure in the public cloud market, but it can still use its large enterprise customer base and Red Hat's open-source software to develop services for the hybrid cloud, which sits between private clouds and public cloud services.
IBM investors will get Kyndryl stock next month. If they keep both shares, they will initially receive a combined dividend equivalent to IBM's current dividend, but then both companies may reduce their payouts.
It would seem that IBM investors should sell their Kyndryl stock immediately since the latter would likely have difficulty keeping up with companies like Accenture, but hold onto their shares of a "renewed" IBM to see if its plans to get out of the crisis work.
Nevertheless, today is not a good time to buy IBM stock. Right now, the stock may seem cheap at 12 times forward earnings, but the company still faces stiff competition from Amazon and Microsoft, which are expanding their public clouds in a hybrid market, and an unstable infrastructure business could derail growth in its software and consulting business.
Investors should wait for IBM to complete its spin-off and for results to improve for a few quarters before believing that the tipping point has arrived. Until then, they should buy other blue-chip stocks, not Big Blue.


COKE: Fearful of TrapsTypical retail patterns such as the flag breakouts seem to become more and more manipulated in this day and age.
I am fearful that this breakout could be a fake one to lure more buyers into the market.
Ideally, I would like to see deeper retracements before I load up buys on this stock.
What do you think of this idea?
Please, support this post with a like and comment!


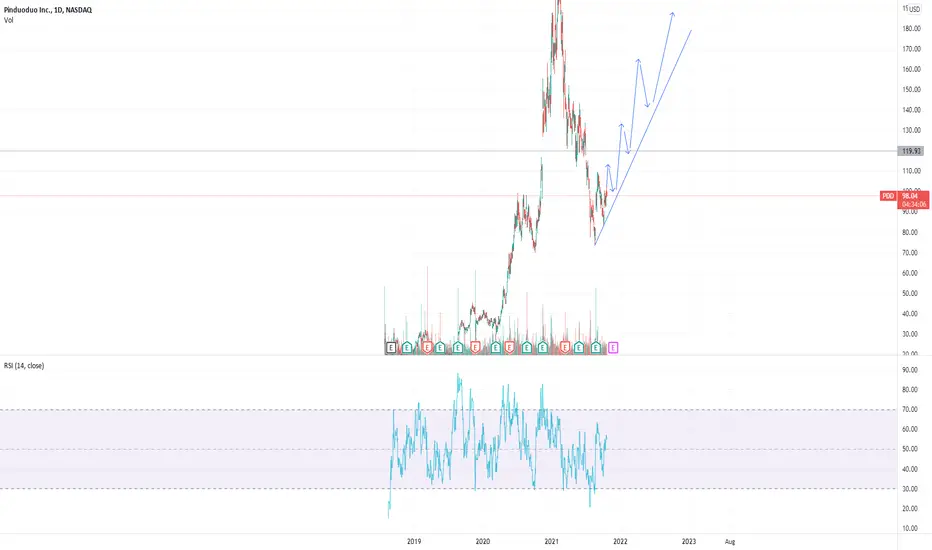
Pinduoduo seems very cheapPDD have reached profit levels and growing 70% y/y.
Large insider ownership motivated to grow the company, IMO its a bargain
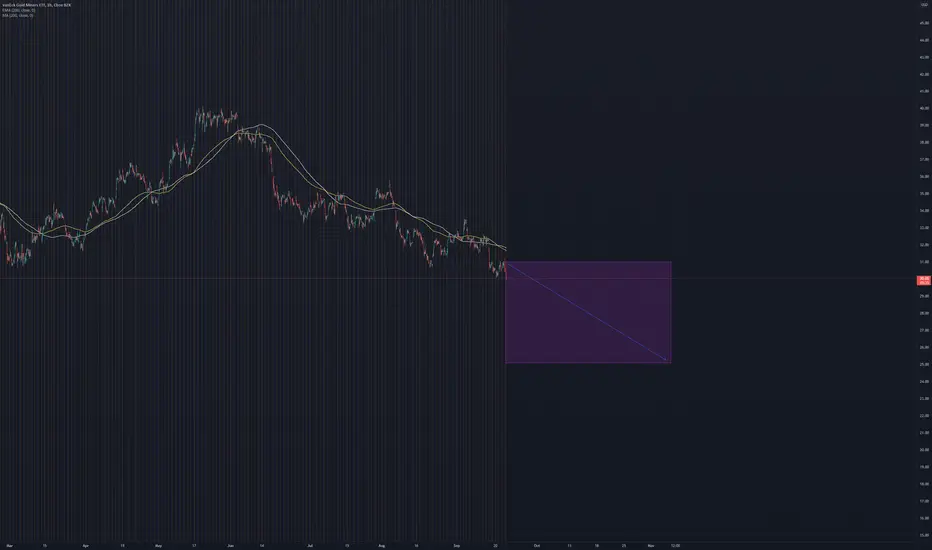
GDX SHORT SWING TRADE | GDX | SHORT @ 31 - 30 | TP @ 29, 28, 27, 26, 25 | SL @ 33 | PATTERN = DOUBLE BOTTOM BREAKDOWN |
PNF chart on the hourly shows a breakout, DOUBLE BOTTOM BREAKDOWN
The strategies I use involve a mix of PNF and Renko. My type of trading is strictly swing trading.
MORE DOWN SIDE ON MGL.MGL is as per charts very negative. 5 days future data shows short build up. 1 day future analysis shows 67200 shorts vs 2000 long. still the sector is reinventing gas prices to be higher and here the stock is making low buy the stock for long term however for now its a short.
yogesh aggarwal.

APPLE Has Probably Peaked, Can FallTraders, APPLE stock can fall as it is forming a pattern and is showing signs of fatigue. This comes along with Amazon, Google Tesla, and Netflix stocks showing same signs. This can have a knock on effect on the NASDAQ which is already trying hard to recover from the recent "so far" minor correction.
Rules:
1. Never trade too much
2. Never trade without a confirmation
3. Never rely on signals, do your own analysis and research too
✅ If you found this idea useful, hit the like button, subscribe and share it in other trading forums.
✅ Follow me for future ideas, trade set ups and the updates of this analysis
✅ Don't hesitate to share your ideas, comments, opinions and questions.
Take care and trade well
-Vik
____________________________________________________
📌 DISCLAIMER
The content on this analysis is subject to change at any time without notice, and is provided for the sole purpose of education only.
Not a financial advice or signal. Please make your own independent investment decisions.
____________________________________________________

TSR Q1 EPS $3.18, Sales $22.90M Up From $14.51M YoYTSR (NASDAQ:TSRI) reported quarterly earnings of $3.18 per share. The company reported $22.90 million in sales this quarter. This is a 57.78 percent increase over sales of $14.51 million the same period last year.

Expected Breakout in TSLA, Target at 1200Trend Analysis
The main view of this trade idea is on the 2-Hour Chart. The stock Tesla, Inc (TSLA) is channeling higher towards resistance at 880. The channel with the resistance around 880 looks like an ascending triangle setup. If TSLA breaks above 880, it can go as higher as 1200. If resistance holds and TSLA declines, failure of the pattern would occur if TSLA declines towards 700.
Technical Indicators
In the upward trend channel, TSLA is trading above its short (50-MA), medium (100-MA) and long (200-MA) fractal moving averages. The RSI and the KST complements the trend as the RSI is above 50 and the KST recently had a positive crossover.
Recommendation
The recommendation will be to go long at market, with a stop loss at 700 and a target of 1200. This produces a risk/reward ratio of 3.45.
Disclaimer
The views expressed are mine and do not represent the views of my employers and business partners. Persons acting on these recommendations are doing so at their own risk. These recommendations are not a solicitation to buy or to sell but are for purely discussion purposes.

PERFECT BUY THE DIP SETUP/EXAMPLE !! STOCK MARKET EDITION A50 - Monthly
Recent factors impacting the Asian markets, have included worries of financial system contagion from a deeply leveraged Evergrande , regulatory crackdown across several industries, and continued trade tensions. Nevertheless, one is beginning to see some indications of a bullish bullish divergence on the charts
Break and Retest - Prices are likely to rebound to the breakout level, which should now serve as support and draw buying activity in the case of a bullish break and retest
Ascending Triangle - The ascending triangle pattern is a bullish pattern that indicates the market is consolidating following an upswing, having buyers still very much in control. As the wedge narrows, the occurrence of higher lows signals that a breakout is impending.
Hidden Bullish Divergence - When the oscillator produces a higher high or lower low while the price movement does not, this is known as hidden divergence. Hidden bullish divergence develop during a corrective or consolidation phase in an uptrend
Sell Wall - A sell wall occurs when a high number of sell orders are made at the same time at any price level. Asset prices can be suppressed and forced to trade within a specific range due to sell walls. Since we have broken and now are retesting this sell wall its a very low risk entry

VUZI - longI think with the push today wee saw the confirmation that $VUZI is likely bottomed and move up from here, for anyone who want information from the company, im just watching now a video about the annual shareholder meeting 21':
www.youtube.com
I will manually update the progress in the trade, I have no TP and will watch the stock manually to close - derisk or let it run - how it comes. Hope we can profit together.

Buy MARA 15/9/2021Stock above EXMA 200 and still in uptrend Stock is making higher low and tests the EXMA 13 and EXMA 34 So you can buy target 52.09 stop loss 30.08 Good luck

SHIP Retraced...Now What?SHIP retraced back to the 50 fib finally, bounced and now attempting to get back to the 236 area but recent volume has ben lighter than in previous weeks. As it approaches this area yet again, I think volume will ultimately dictate the next move. Sure, you've got supply chain bottlenecks and higher prices for shipping specifically to Capesize vessels. However, industry fundamentals have their tipping points.
Seanergy isn’t vocal via its newswire; however, its Twitter feed has become a soapbox of sorts. The company has made it known that there’s a significant value in Cape vessel rates right now. A recent tweet explained that cape vessel rates were $75k/day and that “SHIP has unique benefit through index-linked contracts for most of the fleet.”
Other than that, SHIP stock price movement has reflected a similar tone in a direction that other reopening stocks have seen.
SHIP Stock Forecast
Maxim is the most recent analyst to weigh in on SHIP stock. The firm upgraded its rating to Buy and announced a $2.50 price target . Based on open prices on October 8, this target is 78% higher.

Buy BTU 28/9/2021You can buy BTU target 19.1 stop loss 12.42
money management your responsibility.
I recommend entering a maximum of 10% of the portfolio.
Good luck

BUY LNT 5/10/2021You can buy LNT target 61.45 stop loss 54.32
Money management your responsibility.
I recommend entering a maximum of 10% of the portfolio.
Good luck

$TATA Motors --> Buyside Long$TATA motors seems to be retracing back up towards 600INR on the positive buyside, and recently has been picking up some support levels. As always, this is on an opinion based basis and not financial advice. Information provided is "as is".
