Stockstrading

S&P500 | Does History Repeat Itself?Hi,
Do be honest, I discovered this "pattern" at the beginning of January and I presented this at the local conference of investment. At this time I didn't know it could happen SO fast, it was just a simple coincidence, but now it has come reality - the price of SP500 has started to approach super-aggressively old strong resistance levels which now becomes support!
Those resistance levels are 2000 and 2007 yearly highs. Two times within one decade the price found resistance from the same price levels.
The resistance in 2000 pushed the price down and the price falls 50% from the peak. If you have seen my previous ideas about stocks then there is a "The club of 50%". It means if the price falls 50% from the last clean high (it would be better if it starts to fall from all-time high) then this price level starts to act as a strong support level, the support level "window" will stay between 47%-53% from the top. Example: from $200 to $100 and this $100 will act as a strong support).
...and here is a perfect example - the downwards movement which started in 2000, found a support level exactly after it dropped 50% from the top and the climb continued.
The climb continued until the price reached to 2000 yearly high in 2007, another crisis has started, the price starts to fall and we got another confirmation that 1500-1700 is a super strong resistance level.
After the tiny all-time high in 2007, the price starts to fall and again it founds a support level after the price is reached into "The club of 50%", it dropped 52% and perfectly matching with our 50% club window which was 47%-53% from the last peak.
....and the climb continued, another confirmation that those 50% drops are pretty powerful support levels. This climb which started in 2009 guided us to the longest and craziest bull run ever. Obviously, now it is over and we have a big question, where is the bottom of this crisis??
Where is the bottom, technically!?
Fast education:
1. The old clean resistance level becomes a support level.
2. A bit more specific but long-term Fibonacci levels are really powerful, and the most powerful Fibonacci retracement level is 62%, known as the Golden Ratio!
3. 50% drop from the all-time high starts to act as a support level (the window was 47%-53%)
Adding those criteria to the chart:
1. We have a super-powerful resistance level from the last decade. Two times, in 2000 and 2007, the price got a rejection from 1500-1700. The third time was a successful attempt and it guided the SP500 into the all-time-bull-run. After the breakout, this strong resistance level becomes a support level and as said previously, the price has started to approach it super-aggressively. So, the first major stop should stay between 1500-1700.
2. The Fibonacci Golden Ratio of 62% is waiting for the price around the same area as talked on the previous point, definitely adding strength to the mentioned support level.
3. The price fall, which began in 2000, found support after a 50% drop. The price fall, which began in 2007, found support after it dropped 52%. Now, from the all-time high to the previously discovered strong support area (1500-1700) is ~52%!!!
Long story short: start building your portfolio after the S&P500 has reached to the major support around 1500-1700! :)
Hopefully, it was helpful. Hopefully, it was informative and if you agree with me then hit the "LIKE" button! :)
Best regards,
Vaido


NETFLIX STOCK oppBased on wyckoff accumulation presented in price and new features launched by Netflix, it sees a good opportunity to invest in netlifx stocks. Also based on global conditions, including lockdowns, at the moment netlix has increased their stocks by 17%. Look for price action as given in the analysis and enter at own risk.
Let's see what happens in the next few weeks.

AMERICAN AIRLINES has found its SupportAAL found its support and showing some respected price action on it. I believe this support gonna support the AAL to have some breath in near future

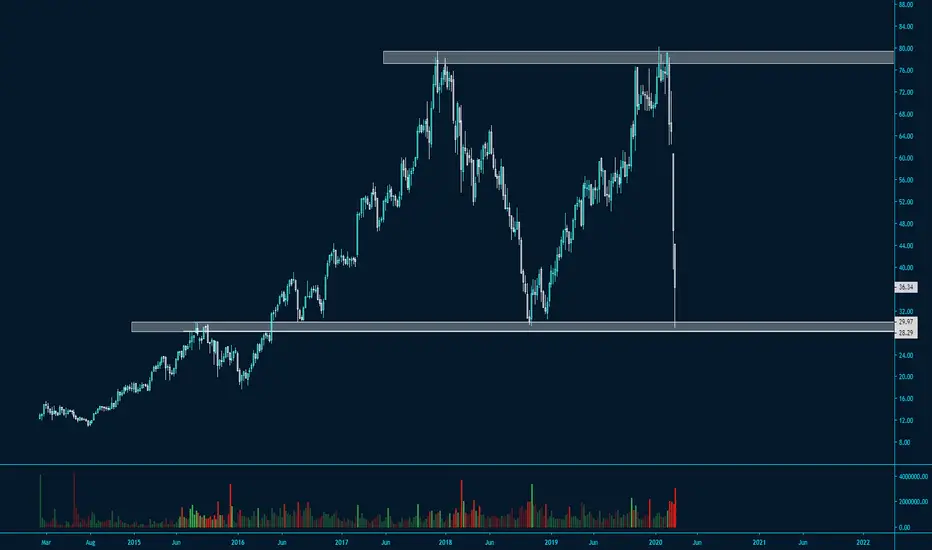
Taylor Wimpey TW *GOOD LONG TERM BUYING OPPORTUNITY*Taylor Wimpey Analysis.
Currently trading at more than a 54% discount from the current yearly highs and price is sat around 109/110 support zone. This price level was the very bottom of the lows seen during the 2016 sell-off.
They have a strong dividend yield history paying over 9% and before covid-19 came on to the scene, their company financials were looking good. Revenue increased by 10% last year and their cash in hand balance is over 600m.
Interest rates have been cut further last week and this theoretically will help to boost new home sales when we pull through the current market climate. It also appears that the construction industry is still firing on all cylinders with site works continuing until further notice.

INFN LONG SET UPBUY INFN
LONG ENTRY 1 3.95
LONG ENTRY 2 4.12
SL $2.00
Take Profit 1 $4.86
Take Profit 2 $5.60
Take Profit 3 $6.12

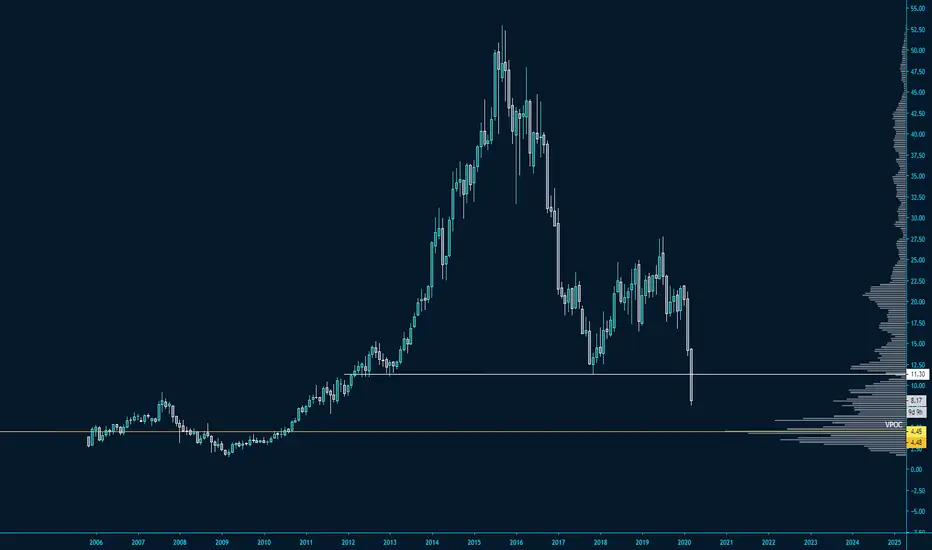
Genting Singapore Limited - AnalysisSTOCK IN FOCUS: GENTING SING
As the pandemic situation continues, tourism-related companies are greatly affected. Travel advisories, bans and even country lock-downs see a stark drop in local and tourist traffic, and revenue for the retail and hospitality sector. Genting Singapore PLC had been involved in the development, and currently operating 2 Integrated Resorts in Singapore. With noticeable absence of foot traffic, we can expect revenue to drop. A pick-up of tourism is linked to the recovery not only of healthcare aspect of the pandemic situation, but also a recovery of countries' economies.
Price has melted from the descending triangle and looks to continue melting with the ongoing situation. We could see price levels reach GFC crisis levels, ranging from 0.325 to 0.470.
Price YTD: down 33% (from 0.930 to 0.620)
Price from end Jan'20: down 28% (from 0.865 to 0.620)
Dividend yield FY'18: 5.65%
Dividend yield FY'19: 5.65%
I believe dividend yields will fall for FY'20 but it could be a good hold as I believe that this stock has potential to climb as tourism picks up in future, and possibly with plans to expand.


Let's talk correlations: Bitcoin and the Stock MarketCryptohopper Newsletter
Chart
Bitcoin has lost around 30% of its value since its high on February 13th 2020. At the same time the SP 500 fell over 20% around the same time. So, is there any correlation between the two markets, or is it just coincidence?
That is what we will explore in this newsletter!
Correlation or coincidence?
Throughout 2017 both cryptocurrencies and the stock markets experienced strong growth in an almost unbroken uptrend. The SP 500 grew around 20% from the beginning of the year until the year’s end. Meanwhile Bitcoin had an astonishing growth of over 1,300% in the same year. Although this seems to be a strong sign of a possible correlation between Bitcoin and the Stock market, this is just about where the correlation ends; at least for the time being.
Over the course of 2018, Bitcoin was in a steady decline until February 2019. Meanwhile the Stock market has had a small downtrend, an uptrend where it made new highs, then an even stronger downtrend until December 2018.
Afterwards, Bitcoin had a strong uptrend from February up until June but it failed to make a new high, then followed an over 50% correction, and then a short uptrend from December 2019 until February 2020. At the same time, the stock market has had an uptrend where it just made higher highs, a range, and then an even stronger uptrend where the price rose by 15% more than the previous high.
In the middle of February however, both BTC and the SP 500 started a rapid descent at the same time. Many people suspected this is due to the Corona virus outbreak.
To find out whether there really is a correlation or not between the Stock market and cryptos, we have looked at the total number of days in which both BTC and the SP 500 have been in an uptrend or downtrend simultaneously. We have thus found out that 64% of the time Bitcoin and the Stock market are both in an uptrend or in a downtrend simultaneously. This number is dragged higher due to the strong uptrend of both markets during 2017. In 2018 and 2019 there hasn’t been a strong correlation between the two markets. However in 2020, since the outbreak of the Coronavirus, both the stocks and the crypto market have been behaving very similarly.
In conclusion it is hard to tell with certainty whether the crypto market and the stock market are correlated, however there are more chances that they are correlated rather than not

BOEING BUY PUT NYSE:BA just Bought a PUT . I am expecting the price to continue to fall and maybe get trapped in that range of prices.

$RCL Possible selling climax$RCL at highly negotiated level of volume. Monthly chart. Huge increase in volume yesterday with a hummer candle (take a look at daily chart) that could be indicating a possible selling climax or the buys by institutional investors. If this level does not hold, the next to look is around $26.


Pinterest is worth your interestPinterest #PINS is a fast-growing company with favorable demographics, the stock has dropped in price while outperforming expectations.
Pinterest (PINS) debuted on the public markets less than a year ago at a price of $23.75. Since that time, Pinterest has dropped in price by a great percentage and do not thing for a moment that the coronavirus is to blame 🙂
The interesting part is that Pinterest has actually been profitable and has beaten earnings estimates in the last quarters. So why is it that Pinterest is dropping strongly, why? Because fundamentals are not that important when trading a supply and demand strategy.
I’ve happened to read that some analysts are claiming that Pinterest #PINS is a buy for anyone with at least a two-year time horizon. Well, it may be that Pinterest stock will be revalued in two years time, but why buying Pinterest now and lock in part of your capital in a stock that is dropping like a rock reacting to super strong weekly supply zones?
It makes no sense how some analysts and web sites are recommending buying Pinterest stock to hold it for two years when the stock is in a clear downtrend.
Take a look at Pinterest #PINS supply and demand weekly timeframe analysis. There is a strong weekly supply around $25 per share, these supply zones act like magnets to price, a price level where there are a lot of interest by professional investors.

$ENPH Waves, This is been previously pushed and noted by another twitter member so I decided to take a look. Honestly this all the characteristics to move up. Keep your eye on this
Over the green line we go higher, under the red we go lower.
KEEP IT SIMPLE.
BTD traders.

NYSE Yamana Gold (AUY) long.All description on the chart.
Please, don't forget to like and follow.
Thank you.

Great Buy with FISV for potential 10%+ ReturnFISV offers a great dip buy opportunity for a minimum 10% return. FISV has been on a strong upward trend for the past several years and will continue on this trend because of solid fundamentals.

The Next Great Depression - A Massive Shift Soon I've written at length about how I feel about the stock market. I've talked about how price action closely resembles the years leading up to the Great Depression, and I've also discussed why I think a large crash needs to happen in order for some structural changes to be made.
Here are a few of those posts:
Where I called a potential blow-off top:
Where I talk about why I think a crash is necessary:
A crash can happen for any number of reasons. Humanity has grown exponentially in the last 200 years. This causes stresses on our economy, environment, and our species as a whole. When any number of things happen (war, environmental change, viral epidemics, even greed itself), our society's fragility becomes exposed. Right now, it happens to be COVID-19 (the new coronavirus), but it could be anything. Any external variable that puts stress on our infrastructure has the potential to expose the flaws in our hyper-connected, top-heavy world. What do I mean by top-heavy? I mean it in terms of wealth concentration. In the event of disaster, the bottom 90% of the world has very little resources to protect themselves. When you have a top-heavy system built on a shaky foundation...you can guess what would happen.
From a technical standpoint, yes, stocks can continue to go up until at least the U.S. Presidential election. Perhaps the DJI can surpass 30K or even 40K, but ultimately I think we'll visit some lows not seen in many years. This can easily be the top here as well, with major indexes unable to invalidate the major bearish divergence on the monthly chart (drawn above). No one can time it perfectly, but I do continue to believe that this current rally is a "seller's rally" or an opportunity for people to take their money and run.
I think today's selloff resulted not only from fears of the virus disrupting major supply chains and global economic efficiency, but from the rise of Bernie Sanders. A Bernie presidency would likely send markets reeling, in a period of major economic uncertainty. Regardless of whether or not his policies are a good idea in the long run, I think it could cause some serious upheaval in the short term. I think some stock traders are anticipating a rise in democratic socialism, and trying to front run a deeper market selloff.
Once we get a drop (and I do think we're in for a MAJOR stock market selloff), how low we go will really depend on how our governments react to it. It can go far lower than probably most people are expecting, simply from a technical standpoint. The technicals just show the parabolic growth. As I mentioned above, parabolic growth cannot be sustained because of how stress on the system impacts the fragile underlying nature of such growth. What we've seen over the last several decades is not slow, sustained growth. It's not healthy. And I think this will be exposed soon.
Looking at the linear chart for the S&P 500, it can drop 50% and still be at the 200 Month Moving Average. That's how overextended this rally is.
In conclusion, I think there will be a massive shift in financial markets, the ripple effects of which can last decades. I think it will take this much time for things to get sorted out. Of course, I may be wrong. All I'm doing is speculating, observing, and offering my opinion. This is not financial advice.
-Victor Cobra

