GUINEAINS LONG IDEA GUINEAINS stock presents a long opportunity based on trendline and support level. To take advantage of this opportunity, there's a need to wait for price to drop to the support level around N75 and N73. An aggressive approach is to enter a long position at that price while a conservative approach is to wait for a candlestick confirmation such as bullish engulfing or hammer. The last high around N1.23 (68.49%) can be the target while the stop can be around N0.57 (21.92%).
Confluences for the long idea:
1. Bullish trendline
2. Support level
3. Bullish market structure.
Disclaimer: this is not a financial advice. The outcome maybe different from the projection. Don't take the signal if you're not willing to accept the risk.
Stocktrader

A life-changing SBET long ideaSBET stock presents an amazing long opportunity that has a potential to do over 100x. After the break out of a down trend line, price retraced to the support, with price closing above this support level.
To advantage of this long opportunity, you can buy from the current market price while the exit can be at $1.34 and the targets can be at $123.70, $178.48, $541.22, $1041.90 and the final target at $2155.20.
Confluences for the long opportunity are as follows:
1. Break out of down trendline
2. Retest of the down trendline and support level.
3. Bullish divergence signal from awesome oscillator.
Disclaimer: This is not a financial advice. The outcome maybe different from the projection. Don't take the signal if you're not willing to accept the risk.

GME LONG IDEA UPDATEDIn my previous post regarding the long opportunity on GME stock, I called a long signal after a break out of a downtrend line. However, price had dropped down to the demand zone, giving another long opportunity.
To take advantage of this long opportunity, you can buy at the current market price, while the exit will be at $20.30 and the targets can be at $35.70, $47.90 and the final target at $64.70.
Confluences for the long idea are as follows:
1. Weekly break of structure
2. Valid Inducement
3. Orderflow
4. Price within the discount
5. Price respecting bullish trendline
6. Hammer candlestick confirmation
7. Price at a support level
Disclaimer: This is not a financial advice. The outcome maybe different from the projection. Don't take the signal if you're not willing to accept the risk.

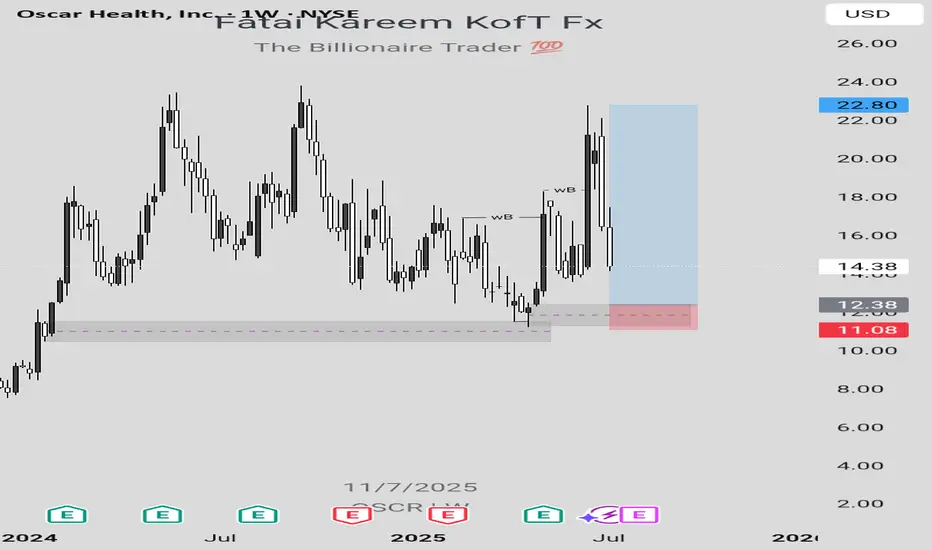
OSCR LONG IDEALooking at the weekly chart of OSCR stock, there's a long opportunity which can be taken advantage of to make some money provided that market follows the projection.
In order to take advantage of this long opportunity, a buy order limit can be placed at $12.38 while the exit can be at $11.09 and the final target can be at $22.80.
Confluences for this long idea are as follows:
1. Weekly break of structure
2. Valid Inducement (structural liquidity)
3. Orderflow
4. Sweep
5. Valid demand zone in the discount level
6. Imbalance
7. Pattern confirmation formed after mitigation of a demand zone indicating that there's a bullish change of trend.
Disclaimer: This is not a financial advice. The outcome maybe different from the projection. Don't take the signal if you're not willing to accept the risk.
After 45% Profit On Last Trade, I Am Re-entering UMACTrading Family,
On our stock trades, using my new liquidity indicator, we have been solidly beating the market with a cool 15% profit since our first trade with it. If you had held the SPY from the same time, your profit would have been a more meager 6.5%. Our indicator is proving beneficial, to say the least. And the last time it gave me a buy signal on UMAC, we banked 45% in profit on my last exit. I then determined that if it did not give me a sell signal (it hasn't), I would look to re-enter at that 7.66 level. We have reached that level, and I have dipped my toes back in at 7.94. I would look to double up my position if we drop even further to that 6.44 level, but I don't know that we will. My target of 11.76 will give us another 48% profit on this trade, and I have a SL set at 6.18 for a nice 2.17 rrr.
Let's go!
Stew

WHAT'S THE FATE OF INTEL CORPORATION STOCK?From the perspective of technical analysis, INTC is approaching a key psychological level at $19. In addition, it's in a downtrend. If the key level should hold by pushing price higher, leading to a break out of the downtrend line and closing with a strong bullish candle above the down trend line and resistance level around $22, this will indicate a strong bullish signal. Likewise, this is supported by a bullish divergence signal from the awesome oscillator. Otherwise, a failure of the psychological level of $19 may lead to price dropping further.
Furthermore, we need to look beyond technical analysis. Fundamental analysis also has some insights for our decisions.
Fundamentals for INTC established a bearish bias. The summary is as follows:
Financial Health:
• Negative EPS (-$4.47): Intel is losing money.
• High Debt ($50B): This can limit growth and increase risk.
• Declining Revenue: Sales dropped from $80B (2021) to $51B (2024).
Valuation:
• Cheap P/S (1.66x), but no P/E (due to negative earnings).
• Dividend yield (2.56%) is at risk of being cut.
Sentiment:
Stock price fell from $56 to $19.55 (65% drop). Institutional investors may be wary.
Fundamentally, INTC is weak — best suited for speculative, long-term bets (if you believe in a turnaround).
Strategy for Traders:
1. Conservative Approach:
- Wait for:
- Break out of downtrend line and resistance around $22 and positive earnings/news.
- Rising volume to confirm momentum.
- Target: $27–$30
- Stop-loss: Below $17 (apply proper risk management).
2. Aggressive Approach:
- Buy near $18–$19 with tight stop-loss ($16).
- Target resistance level at $22.
3. Avoid If:
- You’re risk-averse or prefer stable companies.
- Intel’s debt/revenue trends worsen.
Note:
- Short-Term Trade: Only if breakout confirms ($22+). High risk, but possible 20% bounce.
- Long-Term Investment: Avoid unless Intel shows profit/debt improvement.
Always use stop-losses —Intel’s fundamentals make it volatile.
Disclaimer: This is not a financial advice. The outcome maybe different from the projection. Don't take the signal if you can't accept the risk.

WHAT'S THE FAITH OF INTEL CORPORATION STOCK? From the perspective of technical analysis, INTC is approaching a key psychological level at $19. In addition, it's in a downtrend. If the key level should hold by pushing price higher, leading to a break out of the downtrend line and closing with a strong bullish candle above the down trend line and resistance level around $22, this will indicate a strong bullish signal. Likewise, this is supported by a bullish divergence signal from the awesome oscillator. Otherwise, a failure of the psychological level of $19 may lead to price dropping further.
Furthermore, we need to look beyond technical analysis. Fundamental analysis also has some insights for our decisions.
Fundamentals for INTC established a bearish bias. The summary is as follows:
Financial Health :
• Negative EPS (-$4.47): Intel is losing money.
• High Debt ($50B): This can limit growth and increase risk.
• Declining Revenue: Sales dropped from $80B (2021) to $51B (2024).
Valuation:
• Cheap P/S (1.66x), but no P/E (due to negative earnings).
• Dividend yield (2.56%) is at risk of being cut.
Sentiment:
Stock price fell from $56 to $19.55 (65% drop). Institutional investors may be wary.
Fundamentally, INTC is weak — best suited for speculative, long-term bets (if you believe in a turnaround).
Strategy for Traders:
1. Conservative Approach:
- Wait for:
- Break out of downtrend line and resistance around $22 and positive earnings/news.
- Rising volume to confirm momentum.
- Target: $27–$30
- Stop-loss: Below $17 (apply proper risk management).
2. Aggressive Approach:
- Buy near $18–$19 with tight stop-loss ($16).
- Target resistance level at $22.
3. Avoid If:
- You’re risk-averse or prefer stable companies.
- Intel’s debt/revenue trends worsen.
Note:
- Short-Term Trade: Only if breakout confirms ($22+). High risk, but possible 20% bounce.
- Long-Term Investment: Avoid unless Intel shows profit/debt improvement.
Always use stop-losses —Intel’s fundamentals make it volatile.
Disclaimer: This is not a financial advice. The outcome maybe different from the projection. Don't take the signal if you can't accept the risk.

WATCH OUT FOR VERITASKAPFrom around 0.83, VERITASKAP created an all-time high of around 1.81. This happened between August 2024 and September 2024. Then, price dropped into the discount level where is currently. The current price action shows that price is in a discount level, at a demand zone and within a falling wedge.
From a chart pattern perspective, falling wedge can be seen on the chart and a break out of the downtrend and resistance level around 1.06 with a bullish candle closing above these levels will serve as a strong indication that the stock is ready to rally up as much as the all-time high.
From a technical indicator perspective, awesome oscillator is below 0, showing that the stock is oversold. In addition, there is a bullish indication on the awesome oscillator as shown by its colour and upward movement. This is pointing to the fact that the value of the awesome oscillator is moving towards 0 and can cross over it which can be a good indication for a rise in price as well.
From a smart money concept perspective, a break of the last high (around 1.27) that led to the last bearish internal break of structure will as serve as indication of a bullish trend. Hence, the target will the all-time high.
Either way, the stock has a good potential. An aggressive trader or investor may buy at the current market price. While a conservative trader or investor may wait for a breakout.
Watch out for the confluences indicating potential rise in price so as to not miss out on the benefit.

NEM SHORT IDEANEM Insurance stock is ready to have a drop. There's a bearish divergence signal from the awesome oscillator showing that there's a high tendency for the price of the stock to drop as much as to 11.65 and below that value. Any value below 11.50 is the discount level where there can be a potential for the next long opportunity.
Looking at the past data, some patterns were revealed. In September 2016, there was a bearish divergence signal and the price dropped from around 3.71 to around around 1.51. Likewise, in September 2022, there was a bearish divergence and the price dropped from around 5.65 to around 3.71. Similar pattern is what is repeating itself showing that there's a higher probability that the price dropped into the discount level. For an investor holding this stock, this maybe a signal to sell and wait for another long opportunity. For a trader, it's an opportunity to short the stock, targeting the discount price around 11.65.
Confluences for the short signal:
1. Price is showing higher high while awesome oscillator is showing lower high indicating bearish divergence.
2. When similar patterns occured in the past, price dropped into the discount level.
3. A bearish engulfing candlestick had been formed showing that price is likely going to drop further.
Disclaimer: This is not a financial advice. The outcome maybe different from the projection. If you can't accept the risk, don't take the signal.

SRF: Breakout of Symmetrical TriangleA symmetrical triangle is a chart pattern in technical analysis that forms when the price consolidates with lower highs and higher lows, creating a converging triangle shape. This pattern indicates a period of consolidation before the price breaks out in either direction.
SRF stock has already given a bullish breakout. One should go long on the stock with Stop loss below 2550 for the measured target of 3475-80 zone.

Pattern Patience: Mastering Emotional Discipline Morning Trading Community
Ever feel like your emotions mess with your trading? This video's for you. We'll explore how patience with chart patterns, like the double bottom, can teach us discipline. It's about waiting for the right moment, not rushing in.
Kris/Mindbloome Exchange
Trade What You See

Unlock Your Trading Potential: How to Design the Perfect Trading
Morning Trading Family
Ever wonder how the pros keep getting better? It's all about the journal! Join me in this video where I spill the beans on setting up your own trading journal that'll skyrocket your learning curve.
We'll go through how to record each trade like a pro, capturing not just the when and where, but the why. I'll share simple methods to make your journal entries meaningful and insightful. Check out a real-life example from my journal, where I share not just the trades but the feelings behind them. Learn to spot the patterns in your trading - the good, the bad, and the ugly.
Whether you're just starting out or you've been trading for years, this video is your roadmap to personal growth in the trading world. I'll show you how a few minutes each day can transform your trading strategy. Drop your thoughts, questions, or your own journaling hacks in the comments!
Kris/Mindbloome Exchange
Trade What You See

Oracle’s Cloud Conquest|Climbing Mount Hyperscaler with AI BootsWill Oracle Cloud Infrastructure aka OCI Emerge as the 4th Hyperscaler?
Although OCI hasn’t yet reached the scale of the top three cloud giants (AWS, Azure, GCP), it’s rapidly advancing, much like d’Artagnan joining the musketeers. Riding the AI wave, Oracle’s Infrastructure as a Service (IaaS) segment surged by 52% to $2.4 billion in Q2. Over the past year, OCI has overtaken Salesforce and IBM, surpassing even Snowflake. Its next target, Alibaba Cloud, grew just 7% YoY to $4.2 billion in Q3. However, this impressive growth comes at a price—Oracle’s capital expenditure is expected to double in FY25 to meet AI demand.
Oracle Q2 FY25 Highlights
Key Metrics
-Remaining Performance Obligations (RPO): A measure of future revenue from existing contracts. RPO grew 50% YoY, with Cloud RPO jumping nearly 80%, reflecting strong momentum. Sequentially, total RPO declined slightly from $99 billion in Q1 to $97 billion in Q2. 39% of this is expected to convert into revenue over the next year.
-Cloud Services Revenue: Up 24% YoY to $5.9 billion:
-IaaS: Grew 52% YoY to $2.4 billion, up from 45% in Q1, driven by OCI adoption for high-performance workloads and multi-cloud deployments.
-SaaS: Increased 10% YoY to $3.5 billion, with stable demand for cloud-based ERP, HCM, and CRM solutions.
- Fusion Cloud ERP: Gained 18% YoY to $0.9 billion.
-NetSuite Cloud ERP: Rose 19% YoY to $0.9 billion.
- Total Revenue: Increased 9% YoY to $14.1 billion, missing estimates by $20 million.
-Cloud Services & License Support: Up 12% YoY to $10.8 billion, with cloud services alone growing 24% YoY to $5.9 billion.
-Cloud License & On-Premise: Up 1% YoY to $1.2 billion.
-Hardware: Declined 4% YoY to $0.7 billion.
-Services: Dropped 3% YoY to $1.3 billion.
-Margins: Gross margin held steady at 71%, while operating margin improved 2 percentage points to 30%.
-Non-GAAP EPS:$1.47, missing estimates by $0.01
Cash Flow & Balance Sheet
-Operating Cash Flow (TTM):** $20.3 billion (+19% YoY).
- Cash & Cash Equivalents:** $11.3 billion.
-Debt: $88.6 billion.
Q3 FY25 Guidance
- Revenue growth of 7%-9% YoY (10% expected).
- Cloud revenue projected to grow 25%-27% YoY, accelerating further.
Analysis and Insights
1.Momentum in Cloud Infrastructure
Oracle’s focus on AI workloads is paying off, with major clients like Meta, Uber, and TikTok driving GPU consumption up by 336%. The company also unveiled the largest AI supercomputer, featuring 65,000 NVIDIA H200 GPUs. However, a potential TikTok ban in the U.S. could pose a $2 billion revenue risk.
2.Growth Despite Missed Targets
While revenue and adjusted earnings missed estimates due to slower SaaS growth, cloud revenue of $5.9 billion was just shy of the $6 billion forecast. Shares dipped post-earnings but remain up nearly 70% year-to-date, exceeding most investors' expectations
3.Capex Surge for AI
Capital expenditures reached $4 billion this quarter, a sharp increase from under $7 billion in FY24. Management expects FY25 Capex to double, driven by AI demand, resulting in negative free cash flow ($2.7 billion used) for the quarter. These investments align with industry trends but may stretch the balance sheet.
4.Expanding Multi Cloud Partnerships
Oracle’s partnerships with Meta, AWS, Azure, and Google Cloud enhance its relevance in multi-cloud environments. These alliances enable seamless workload interoperability and help Oracle compete effectively while broadening its customer base.
5.Balance Sheet Challenges
Oracle’s net debt of $80 billion, despite robust $20 billion annual operating cash flow, restricts its ability to pursue aggressive growth strategies or acquisitions. Rising Capex could further limit flexibility.
6.Bullish Long-Term Outlook
Management projects total cloud revenue to exceed $25 billion in FY25, fueled by AI demand and OCI’s competitive positioning. Analysts remain optimistic about Oracle’s prospects, particularly in multi-cloud ecosystems and generative AI workloads.
This explains why Larry Ellison envisions Oracle’s data centers expanding tenfold

SQQQ I It will decline from top of the resistance channel
Welcome back! Let me know your thoughts in the comments!
** SQQQ Analysis - Listen to video!
We recommend that you keep this pair on your watchlist and enter when the entry criteria of your strategy is met.
Please support this idea with a LIKE and COMMENT if you find it useful and Click "Follow" on our profile if you'd like these trade ideas delivered straight to your email in the future.
Thanks for your continued support!Welcome back! Let me know your thoughts in the comments!

NASDAQ 100 / 1H / TECHNICAL ANALYSIS NASDAQ:NDX I have indicated the completed targets of the ABCD pattern on the chart. Resistance is at 17670, and support is at 16248.
Please don't forget to like and follow. I'm sharing analysis exclusively for you. You can express your gratitude by liking and following

Indus Tower ready to breakoutAfter a long period of consolidation, on the back of good earnings releases, Indus Towers is ready to break out. DMI also indicates bullish strength with increased volume activity
Entry - 232
Stop Loss - 203
Target - 310

spy spx That just might be your daily top and time to intraday short/put this h*.
Now lets sell it off.

TSLA has a flat?If you find this information inspiring/helpful, please consider a boost and follow! Any questions or comments, please leave a comment! Also, check out the links in my signature to get to know me better!
Still following the green path.
Several ways to label this, but I think a flat here would be an interesting take on things.
There are some levels to hold and pivots to break to be sure.
The Gap and High are nice draws.

Pin point prediction Of Bharati Airtel For 18 to 22 Sep 23Hello Traders,
This is my trade plan for next week in this stock complete marking and would be followed cases marked for detail check below.

Tsla, looks like battery drain... If you find this information inspiring/helpful, please consider a boost and follow! Any questions or comments, please leave a comment! Also, check out the links in my signature to get to know me better!
Followed green path, but looking like a ZZ up.
Still think the reaction to this 238.40 area could be a good clue. A bounce to another ZZ at the lower degree, would be looking for some further downside.

Pin point predictions Of Escorts For 4 to 8 sep 23Hello Traders,
This is the trade plan for next week of Bharat Forge. Outline is showed on chart . For detail understanding of price action check below.

FSLY Fastly Options Ahead of EarningsIf you haven`t sold FSLY Head and Shoulders bearish Chart Pattern here:
Then analyzing the options chain and the chart patterns of FSLY Fastly prior to the earnings report this week,
I would consider purchasing the $17.50 strike price Calls with
an expiration date of2023-9-15,
for a premium of approximately $1.97.
If these options prove to be profitable prior to the earnings release, I would sell at least half of them.
Looking forward to read your opinion about it.

ASI - Falling Wedge Pattern in CSEASI might bounce from 8500 level. Closely monitor this falling wedge pattern and fib levels in the chart.
Disclaimer : The information and analysis provided in this publication are for educational purposes only and should not be construed as financial advice or recommendations to buy, sell, or hold any securities. The author and TradingView are not responsible for any investment decisions made based on the content presented herein. Always consult a financial professional before making any investment decisions.
