Buy the Dip: Tata Motors Set to Zoom from ₹713 to ₹799!Consider buying Tata Motors stock below ₹713 with a long-term target of ₹799, offering a potential profit of approximately 12%.
Stocktrading

MY BEST TRADE - CRCLCRCL. A beautiful retest on liquidity zone. The stock retraced to exact marked levels and grabbed all the liquidity two times near 102 to 104.
UP 31% till now.

S&P 500 Daily Chart Analysis For Week of June 13, 2025Technical Analysis and Outlook:
The S&P 500 Index has displayed both upward and downward movements throughout this week's trading session, narrowly missing the targeted Outer Index Rally level of 6073. Currently, the index is characterized by a bearish trend, warranting attention towards the Mean Support level of 5940, with additional critical support identified at 5888.
Conversely, there exists a significant potential that, upon reaching the Mean Support of 5940, the index may recover and rise to the Mean Resistance level of 6046. This upward movement could facilitate an interim rally, culminating in the completion of the Outer Index Rally at 6073 and enabling the index to address the Key Resistance level positioned at 6150.

NAVA LIMITED – Bullish breakout in 1d soonNAVA Limited is currently exhibiting strong bullish momentum, supported by both technical indicators and improving fundamentals. The stock has shown a sustained uptrend with higher highs and strong volumes, indicating buyer dominance.
✅ Key Bullish Factors:
📊 Strong Fundamentals: Consistent profitability with solid EBITDA margins and minimal debt. Recent buyback reflects management's confidence in the company.
💡 Technicals in Favor: Price trading above key moving averages (20/50/100 EMA), showing strong trend continuation.
🔄 Breakout Confirmation: Stock recently broke past a key resistance zone and is now forming a new base, suggesting potential for the next leg up.
📈 Momentum Indicators: RSI above 60, MACD showing bullish crossover, and volume buildup on green candles.
🏭 Diversified Business: Exposure to energy, ferro alloys, and mining – adding stability and growth potential.
🎯 Potential Upside Levels:
Immediate Target: ₹658
🔒 Stop-Loss: ₹419 (Below key support or recent swing low)
📌 Strategy: Ideal for swing or positional traders looking for high-probability setups with risk-reward in favor.
🧠 Disclaimer: This is not investment advice. Please conduct your own analysis or consult a financial advisor before making any trading decisions.

GE Vernova Inc. (GEV) – Powering the Global Energy TransitionCompany Overview:
GE Vernova NYSE:GEV is becoming a cornerstone of the global clean energy shift, providing advanced power generation, transmission, and renewable energy technologies that are now mission-critical for national energy strategies.
Key Catalysts:
Explosive Electrification Growth ⚡
Grid Solutions backlog tripled YoY, driven by demand for modern, resilient, and clean grids.
HVDC & FACTS technologies place GEV at the forefront of a global multi-decade grid overhaul.
Recurring Revenue from Wind Repowering 🌬️
1 GW of upgraded capacity in 2024 under the Repower program.
GEV operates the most widely installed wind platform in the U.S., giving it dominance in the high-margin retrofit market.
Strategic Manufacturing Expansion 🏭
$600M+ in investments across Florida and India expand capacity and de-risk the supply chain.
Supports global demand from infrastructure stimulus and decarbonization mandates.
Investment Outlook:
Bullish Case: We are bullish on GEV above $410.00–$415.00, as clean energy investment accelerates.
Upside Potential: Price target of $600.00–$610.00, backed by order momentum, retrofit leadership, and global energy reform.
🔋 GE Vernova – Electrifying the Future. #GEV #CleanEnergy #GridModernization #WindPower

APPLE: 3 year Channel Up targets $285.Apple is marginally bearish on its 1D technical outlook (RSI = 43.788, MACD = -0.260, ADX = 30.978) as the recent weakness impeded the price from making the decisive bullish break-out above it. The 1W RSI structure though indicates that this is a bottom formation and it is evident on the Channel Up that the April 7th low has been the start of the new bullish wave. The first bullish wave which also started after a -32% correction, made a first peak on the 1.236 Fibonacci extension. We are bullish on Apple long term, TP = 285.00.
## If you like our free content follow our profile to get more daily ideas. ##
## Comments and likes are greatly appreciated. ##

Rocket (RKLB) From Launch Innovator to Space Systems PowerhouseCompany Evolution:
Rocket Lab NASDAQ:RKLB is transforming into a vertically integrated space and defense systems company, leveraging its launch heritage to build long-term, diversified revenue streams.
Key Catalysts:
Rapid Launch Cadence 🛰️
3 Electron launches in 24 days demonstrate operational agility and scalability.
Meets rising demand for high-frequency satellite constellation deployments.
Strategic GEOST Acquisition 🛡️
$275M deal expands into electro-optical and infrared payloads, key for defense/ISR.
Boosts margin profile, backlog durability, and government contract appeal.
Validated Execution & Recurring Revenue 💼
100% mission success rate and multi-launch contract with Japan's iQPS reinforce credibility.
Positions RKLB for long-term cash flow stability and multiyear contract wins.
Investment Outlook:
📈 Bullish above $23.00–$24.00, backed by high reliability and strategic expansion.
🎯 Price Target: $42.00–$43.00, reflecting an expanding TAM, defense sector momentum, and vertically integrated execution.
🌠 RKLB is no longer just reaching orbit—it's building the infrastructure of space. #RKLB #SpaceStocks #DefenseGrowth

S&P 500 Breaks Out — Trump, Tariffs & Bullish Island PatternDonald Trump has mentioned the US stock market in every meeting he has held in the past few days, which has caused the US stock market indices , including the S&P500 Index ( SP:SPX ), to rise:
"Better go out and buy stocks now".
President Donald Trump told a crowd in Saudi Arabia on Tuesday that the markets are just getting started. “It’s going to get a lot higher,” he said, right as the S&P 500 posted its first gain since late February.
But one of the main reasons for the increase in the S&P 500 Index and US stocks is The United States has dropped its tariffs on Chinese goods to 30% , down from a brutal 145% , while China is slashing its own duties on US imports to just 10% , temporarily, for the next 90 days .
-------------------------------------------------
Now let's take a look at the S&P 500 Index chart on the daily time frame .
S&P500 Index managed to break the Resistance zone($5,737_$5,506) and 21_SMA(Weekly) by Breakaway Gap .
In terms of Classic Technical Analysis , the S&P500 Index has managed to form a Bullish Long Island Pattern , and this pattern is one of the continuing patterns and will be a sign of the continuation of the S&P500 Index's upward trend .
In terms of Elliott Wave theory , it seems that the S&P500 index has completed the corrective wave and is in new impulsive waves , which could cause a new All-Time High(ATH) to form.
I expect the S&P500 index to increase by at least +5% as it approaches the Uptrend line , and we will see the possibility of a new ATH .
Please respect each other's ideas and express them politely if you agree or disagree.
S&P 500 Index Analyze (SPX500USD), Daily time frame.
Be sure to follow the updated ideas.
Do not forget to put a Stop loss for your positions (For every position you want to open).
Please follow your strategy and updates; this is just my Idea, and I will gladly see your ideas in this post.
Please do not forget the ✅' like '✅ button 🙏😊 & Share it with your friends; thanks, and Trade safe.

Intel (INTC) Shares Drop Over 6% in a DayIntel (INTC) Shares Drop Over 6% in a Day
As shown on the Intel (INTC) chart, after Tuesday’s candle closed above $21, the price dropped sharply on Wednesday. INTC was the worst-performing stock of the day among the components of the S&P 500 index (US SPX 500 mini on FXOpen).
Why Did INTC Shares Fall?
The decline is linked to growing competitive pressure. According to media reports:
→ On one hand, AMD continues to rapidly expand its share of the server CPU market. A report by Mercury shows that the company already controls 40% of the segment and could match Intel as early as next year.
→ On the other hand, Nvidia is preparing to launch two accelerated processing units (APUs) for the consumer market, which will combine CPU and GPU capabilities in a single product.
Technical Analysis of the INTC Chart
In 2025, the price remains:
→ within a broad downward trend (marked in red);
→ supported by the $18.50–$20 zone.
Meanwhile, price fluctuations in May and June are forming a narrowing triangle (marked in black). Following the recent negative news, it is possible that INTC shares could fall towards the lower boundary of the triangle — or even retest the psychologically important $20 level.
This article represents the opinion of the Companies operating under the FXOpen brand only. It is not to be construed as an offer, solicitation, or recommendation with respect to products and services provided by the Companies operating under the FXOpen brand, nor is it to be considered financial advice.

META: Close to a 1D Golden Cross. Strong buy.META is almost overbought on its 1D technical outlook (RSI = 69.797, MACD = 30.360, ADX = 40.237) but is about to form a 1D Golden Cross, the first such pattern since March 1st 2023, which was a little after the November 2022 market bottom. The market technically thrives on such conditions and since 2019, the 3 Golden Cross patterns that were formed were bullish continuation formations. Based on the 1W RSI, the current Golden Cross might be more similar with the June 2nd 2020 Golden Cross that was formed after the COVID crash. It rose by +123.42% before pulling back to the 1D MA200 again, so we remain bullish on META with TP = 1,000.
## If you like our free content follow our profile to get more daily ideas. ##
## Comments and likes are greatly appreciated. ##

Differences Between Trading Stock Market and Coin Market
Hello, traders.
If you "Follow", you can always get new information quickly.
Have a nice day today.
-------------------------------------
Please read with a light heart.
-
Trading stock market and coin market seem similar, but they are very different.
In stock market, you have to buy and sell 1 share at a time, but in coin market, you can buy and sell in decimals.
This difference makes a big difference in buying and selling.
In the stock market, you should buy when the price is rising from a low price if possible.
The reason is that since you buy in units of 1 week, you have to invest more money when you sell and then buy to buy 1 week.
I think the same goes for the coin market, but since you can buy in decimal units, you have the advantage of being able to buy at a higher price than when you buy in the stock market.
For example, if you sell and then buy again at the same price, the number of coins (tokens) will decrease, but there will be no cases where you can't buy at all.
Therefore, the coin market is an investment market where you can trade at virtually any price range.
-
In terms of profit realization, the stock market can only be traded in a way that earns cash profits.
The reason is that, as I mentioned earlier, since you have to trade in units of 1 week, there are restrictions on trading.
However, in the coin market, in addition to the method of earning cash profits, you can also increase the number of coins (tokens) corresponding to the profits.
The biggest advantage of increasing the number of coins (tokens) corresponding to profit is that you can get a large profit in the long term, and the burden of the average purchase price when conducting a transaction is reduced.
When the price rises by purchase price, if you sell the purchase amount (+ including the transaction fee), the coins (tokens) corresponding to profit will remain.
Since these coins (tokens) have an average purchase price of 0, they always correspond to profit even if there is volatility.
In addition, even if the price falls and you buy again, the average purchase price is set low, so it plays a good role in finding the right time to buy and starting a transaction.
Of course, when the number of coins (tokens) corresponding to profit is small, it does not have a big effect on the average purchase price, but as the number increases, you will realize its true value.
You can also get some cash when you increase the number of coins (tokens) corresponding to profit.
When selling, if you add up the purchase price + transaction fee X 2~3, you can also get some cash profit.
If you get cash profit, the number of coins (tokens) remaining will decrease, so you can adjust it well according to the situation.
When the profit is large, increase the cash profit slightly, and when you think the profit is small, decrease the cash profit.
-
Therefore, when you first move from the stock market to the coin market and start trading, you will experience that the trading is not going well for some reason.
In the stock market, there are some restrictions on the rise and fall, but in the coin market, there are no restrictions, so it is not easy to respond.
However, as I mentioned earlier, the biggest problem is the difference in the transaction unit.
When trading in the stock market, you need to check various announcements and issues in addition to the chart and determine how this information affects the stock or theme you want to trade.
This is because trading is not conducted 24 hours a day, 365 days a year like the coin market.
This is because if an announcement or issue occurs during a non-trading period, the stock market may rise or fall significantly when trading begins.
-
When using my chart on a stock chart, the basic trading strategy is to buy near the HA-Low indicator and sell near the HA-High indicator.
However, if you want to buy more, you can buy more when the M-Signal of the 1D chart > M-Signal of the 1W chart, and it shows support near the M-Signal indicator of the 1W chart.
In the stock chart, it is recommended to trade when the M-Signal indicators of the 1D, 1W, and 1M charts are aligned.
The reason is that, as I mentioned earlier, trading must be done in 1-week units, so the timing of the purchase is important.
In the coin chart, you can actually trade when it shows support at the support and resistance points.
However, since trading is possible 24 hours a day, 365 days a year, even if it shows support at the support and resistance points, psychological anxiety due to volatility increases, so it is recommended to proceed with trading according to the basic trading strategy.
The creation of the HA-Low indicator means that it has risen from the low range, and the creation of the HA-High indicator means that it has fallen from the high range.
Therefore, if it shows support near the HA-Low indicator, it is likely to rise, and if it shows resistance near the HA-High indicator, it is likely to fall.
However, on the contrary, if it is supported and rises at the HA-High indicator, it is likely to show a stepwise rise, and if it is resisted and falls at the HA-Low indicator, it is likely to show a stepwise fall.
In order to confirm this movement, you need to invest a lot of time and check the situation in real time.
-
Thank you for reading to the end.
I hope you have a successful transaction.
--------------------------------------------------

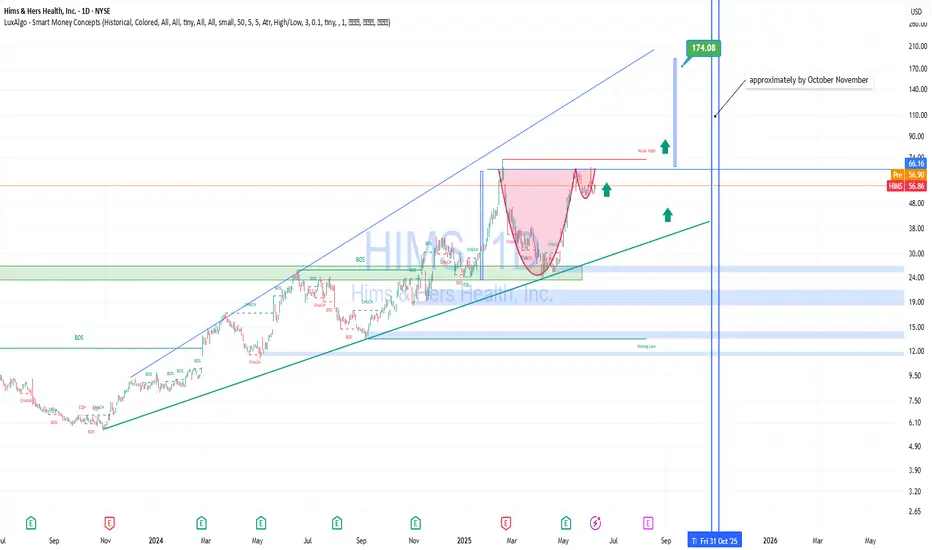
HIMS – Technically and Fundamentally Strong for Mid-to-Long TermTechnical Analysis
HIMS is trading in a clear ascending channel since 2023.
On the daily chart, a “cup and handle” formation has completed, with a confirmed breakout above the neckline ($55–$57 area).
The price is consolidating near the breakout point – classic behavior before a continuation move.
Target projection from the cup pattern is $170+, implying a 200%+ upside potential.
The stock also respects the upper trendline of the long-term channel, reinforcing bullish structure.
Fundamental Strength:
Telemedicine megatrend: Digital health is booming. HIMS is one of the few well-established D2C players in the U.S. market.
Revenue growth: Annual revenue growth exceeds 40% YoY, a sign of operational efficiency and demand.
Sticky subscription model: Over 1.5 million active subscribers — solid base for recurring revenue and LTV.
Valuation upside: Still undervalued relative to sector peers despite recent rally.
Scalable tech stack: Strong backend, customer acquisition systems, and vertically integrated infrastructure support further expansion.
Conclusion: HIMS offers an attractive risk–reward setup for swing traders and long-term investors alike
1,505% from $0.20 to $3.21 on massive 1+ Billion volume $KLTOWOW 🤯 1,505% from $0.20 to $3.21 on massive 1+ Billion shares traded 🚀 NASDAQ:KLTO
I sent out 2 Buy Alerts for everyone to get paid nicely ✅
This will trigger more runners, premarket already got movers NASDAQ:MEGL , NASDAQ:MRIN , NASDAQ:EVGN

BIG 441% Monday from $0.60 to $3.25 $OMH🔥 BIG 441% Monday from $0.60 to $3.25
Easiest money made today was on NASDAQ:OMH buy before halt, then once it came out of halt it was just gapped up into 💸💸💸

APLD - SWING TRADE BUYING ZONESAPLD. The stock was in a perfect parallel channel accumulating zone for many days. Finally we saw a breakout 8.47$
The stock rallied almost a 100 percent after the breakout and is still in a good uptrend.
Major rejection was at 10.20 to 11.65 which is the weekly bearish order block. We have seen 4 to 5 sweeps inside this bearish order block previously and now there is no liquidity left inside the order block.
The stock has made a bullish retest on the previous bearish order block at 11.65 and now its acting as a bullish buying zone.
However, there are a lot of bullish Order blocks waiting to be filled in the uptrend.
In my opinion, best way to ride this stock is to wait and buy at the order blocks.
keep adding if it goes down to fill the other order blocks that are present at the breakout.
Good buying zones for a Swing trade are 10.40 , 10.00 and 8.50 which is the strongest and most reliable.
SO WAIT AND ENJOY!

Apple (AAPL) Shares Consolidate Ahead of WWDCApple (AAPL) Shares Consolidate Ahead of WWDC
Today, 9 June, marks the start of Apple’s Worldwide Developers Conference (WWDC) — an event that traditionally attracts significant attention from investors and traders.
It is fair to say that WWDC 2025 begins against a rather negative backdrop:
→ Since the start of 2025, AAPL stock price has fallen by 19%, and Apple has lost its title as the world’s most valuable company, now trailing behind Microsoft and Nvidia.
→ Expectations raised by last year’s conference — particularly regarding new AI features in the iPhone — were not fully realised. As Barron’s noted, in March, an Apple spokesperson admitted that the new Siri “will take longer than we thought to implement these features. We expect to roll them out next year.”
Technical Analysis of the AAPL Chart
AAPL price movements are forming a narrowing triangle pattern:
→ The red trendline highlights sustained downward pressure on AAPL shares in 2025 — partly driven by concerns over the impact of the ongoing trade war;
→ On the other hand, the area below the psychological $200 level may attract buyers willing to take on risk.
WWDC 2025 could well provide fresh hope for the bulls and prompt an attempt to break out upwards from the triangle pattern.
This article represents the opinion of the Companies operating under the FXOpen brand only. It is not to be construed as an offer, solicitation, or recommendation with respect to products and services provided by the Companies operating under the FXOpen brand, nor is it to be considered financial advice.

CHAMBLFERT 1H Chart Analysis📉 CHAMBLFERT 1H Chart Analysis – Potential Breakdown Ahead
📅 Date: 7th June 2025
📊 Current Trend: Bearish continuation forming
⸻
🔍 Key Observations:
• 📌 Price: ₹539.90
• 🔻 Recent Drop: -2.27% today
• 🟩 1H FVG (Fair Value Gap): Indicates minor supply; price struggling to reclaim
• 🟥 30M FVG Above: Larger supply zone near ₹569.55, likely to act as strong resistance
📉 Bias:
Market structure shows weakness. If the price fails to reclaim the 1H FVG, further downside is likely.
🔽 Next potential targets: ₹525 → ₹510
📈 Upside Possibility?
Only if price reclaims ₹550+ and sustains above the 30M FVG zone, else sellers likely remain in control.
🧠 Strategy:
Consider short on retest of 1H FVG with SL above ₹550
Targeting downside levels as per risk-reward plan
📌 Disclaimer: This is a personal analysis, not financial advice. Do your own research before trading.

Navigating MSTR’s Price Swings: A Smart Options ApproachOverview
MicroStrategy (MSTR) has continued to capture market attention due to its aggressive Bitcoin strategy and significant stock price volatility. In 2025, MSTR surged 41% in one quarter but also reported a massive $4.22 billion net loss in Q1, raising concerns about long-term financial stability. Analysts remain divided, setting price targets ranging from $200 to $650, largely dependent on Bitcoin’s performance and broader market conditions.
Key Developments Impacting MSTR
✔ Bitcoin Exposure: MSTR maintains a large Bitcoin position, making its stock highly correlated to BTC’s price movements.
✔ AI Integration: The company is investing in AI-driven products, which could provide diversification outside of Bitcoin.
✔ Institutional View: Analysts remain split on MicroStrategy’s valuation due to its uncertain revenue model.
✔ Macro Volatility: Market-wide sentiment, interest rates, and crypto regulations will influence MSTR’s trajectory.
Options Strategy for the Week
🚀 Iron Condor Setup for June 6 Expiration
To capitalize on MSTR’s volatility while managing risk, an Iron Condor strategy is structured within a controlled range:
- Inner Range: Sell Calls at 395 and Puts at 335
- Coverage: Buy Calls at 415 and Puts at 315
✅ Objective: Profiting from sideways price movement while minimizing exposure to extreme volatility.
✅ Risk Management: If MSTR breaks above 415 or below 315, the long positions hedge against excessive losses.

3,367% or $3 to $124 in 1 week!🚀 $3 to $124 in 1 week or +3,367% is the kind of stock we all live for!
NASDAQ:SBET was May's power mover, let's see which one does this in June!

PALANTIR: Bullish breakout to $260 imminent.Palantir is on a strong bullish 1D technical outlook (RSI = 62.809, MACD = 6.320, ADX = 29.658) as it maintaines a Channel Up pattern that is supported by the 1D MA50. The starting point was of course the April 7th 2025 bottom and it looks very similar to the previous major bottom on the 1D MA200 on August 5th 2024. Expect the same total rise (+299%) before the next 1D MA50 test. TP = 260.
See how our prior idea has worked out:
## If you like our free content follow our profile to get more daily ideas. ##
## Comments and likes are greatly appreciated. ##

NuScale Power Corp. (SMR) – Leading the Nuclear RenaissanceCompany Overview:
NuScale NYSE:SMR is pioneering small modular reactor (SMR) technology—offering a scalable, carbon-free solution for baseload energy at a time when AI, quantum computing, and data centers are driving unprecedented power demand.
Key Catalysts:
Regulatory Leadership 🏛️
Only SMR design approved by the U.S. Nuclear Regulatory Commission (NRC) ✅
Creates a regulatory moat—a multi-year head start over competitors
Enhances institutional credibility and accelerates deployment
Global Flagship Project: RoPower, Romania 🇷🇴
462 MW project → pre-orders already underway
Final investment decision by year-end could validate tech and unlock global markets
First major deployment in Europe signals international expansion readiness
Explosive Growth Outlook 🚀
77% forecasted revenue CAGR through 2025 vs. industry avg of 8.3%
62% reduction in per-share losses expected → strong operating leverage
Positioned to meet clean energy mandates and private sector demands for resilient, low-carbon power
Investment Outlook:
✅ Bullish Above: $27.00–$28.00
🎯 Price Target: $48.00–$50.00
📈 Thesis Drivers: First-mover advantage, regulatory approval, and global SMR project pipeline
⚛️ NuScale isn’t just building reactors—it’s building the future of energy. #SMR #NuclearEnergy #CleanPower

SHORT $RCL | Recession UnderwayRoyal Caribbean bailout cash drying up.
This chart is a good indication of current economic weakness.
I am looking for NYSE:RCL to drop 60% - 80% from the all time high.
I will continue to monitor and provide updates.
God bless!

PIRAMAL ENTERPRISES LTDThis is the Weekly Chart of PEL !!
PEl is moving in an Ascending Channel pattern on the weekly chart.
PEL is following a HH–HL structure in the channel in Daily chart support at 1040-1050 range, confirming a bullish trend continuation.
Based on historical price behavior, the stock has
previously delivered a 74% return from its swing low, reaching the 1500–1520 range.
Thank You!!
