NVO entering a great buying zoneNOVO has entered into the golden retracement for and good buying zone.
Looking to buy between 62.50 and 60.
Sell targets $90, 110 and 135.
Stocktrading

Crossed over 6.05 SKLZSklz will be over 10$ next year mark my words!!!
Daily booming primed for a breakout of the oldest bearish trends dating back to the reverse split… been holding and buying for years got stuck in and now we are bullish with a good avg price waiting for half sell off north off 11.53$ riding the rest.
16.7m shares i own 3.1k

Broadcom Inc. (AVGO): Software-Driven Growth Meets AI Hardware ECompany Overview:
Broadcom NASDAQ:AVGO is undergoing a strategic transformation—shifting from a hardware-centric model to a hybrid software and subscription platform. The VMware acquisition is proving pivotal, reshaping AVGO’s margin profile and deepening its enterprise moat.
🔑 Growth Catalysts:
💻 VMware Integration = High-Margin Recurring Revenue
70%+ of top 10,000 VMware customers already moved to subscription model
Transition boosts revenue visibility, margin expansion, and valuation multiples
Strong cross-sell opportunities within Broadcom’s enterprise base
⚙️ Custom AI Chips – A Key NVIDIA Hedge
Broadcom’s custom AI accelerators offer an alternative amid export curbs
Strong demand from hyperscalers and cloud players (Amazon, Google, Meta)
Positioned as a strategic silicon supplier in the AI infrastructure stack
📶 Diversification = Resilience
Deep reach across networking, broadband, storage, and wireless
Reduced cyclicality vs. pure-play semiconductor firms
Balanced between enterprise software and hardware demand
🛡️ Geopolitical Edge
Broadcom’s chip solutions provide alternatives in regions impacted by U.S.-China tech tensions
VMware’s software suite ensures relevance in multi-cloud and hybrid IT environments
📊 Financial Highlights:
Consistent double-digit free cash flow growth
EBITDA margin expansion via software scale and cost synergy post-VMware
Shareholder-friendly with strong buybacks and dividend growth
📈 Investment Outlook:
✅ Bullish Above: $165.00–$170.00
🚀 Upside Target: $270.00–$280.00
🎯 Thesis: With AI tailwinds, VMware synergies, and rising recurring revenues, Broadcom is evolving into a software+silicon powerhouse—positioned for outsized returns and resilience in volatile markets.
#Broadcom #AVGO #VMware #AIchips #Semiconductors #EnterpriseSoftware #RecurringRevenue

AAPL | Apple Stock | Three Drives Down PATTERNThe Three Drives / Three Dives Down pattern is usually short term bearish , but near term and long term bullish .
Previously, we saw a -32% correction. This time, it could be a little higher if we consider the previous neckline support:
The only way I see this paying out differently, is if the price captures the current resistance zone, and CLOSES above it:
__________________
NASDAQ:AAPL

Tesla - The Next 7 Days Decide Everything!Tesla ( NASDAQ:TSLA ) is sitting at a crucial structure:
Click chart above to see the detailed analysis👆🏻
Despite the -60% correction which we have been seeing over the past couple of months, Tesla still continuously validates its overall uptrend. That's exactly the reason for my strong bullish thesis and the assumption, that after we see bullish confirmation, Tesla will reject the current support area.
Levels to watch: $250, $400
Keep your long term vision,
Philip (BasicTrading)

WHAT A LOVELY BULLISSH GAP ON AMAZON: A 4RR PROFIT TRADE CLOSEDI just closed this beautiful 4RR trade on Amazon.
The trade was entered last week, this new week market open Gap pushed the price high to my 4RR target.
Trade Idea;
The monthly is extremely bullish.
The weekly is also bullish.
Daily is bullish as well, so i entered on the daily time frame pull back swing low.
Result?
A beautiful 4RR profits trade.
Next Action?
I will wait till the daily frame correct and form a swing low before entering for a bullish trend continuation buy.

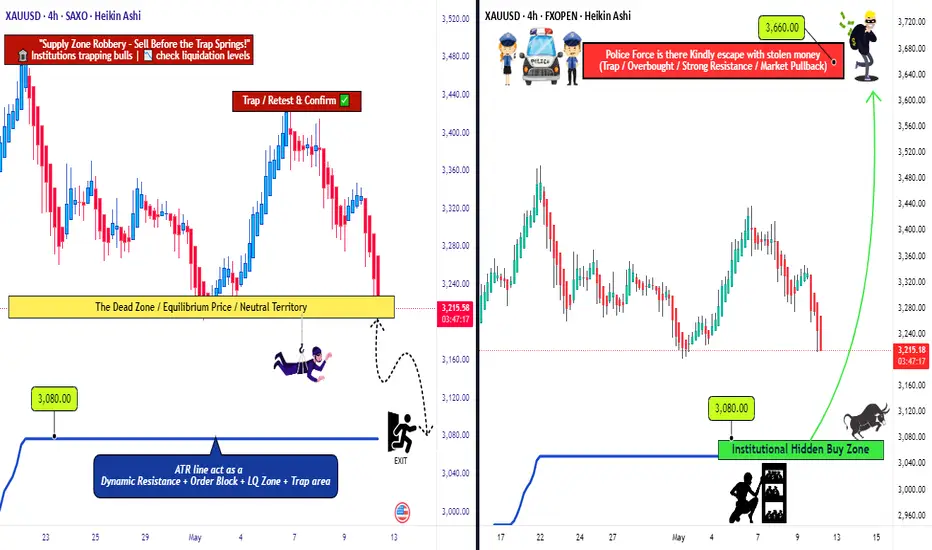
Golden Opportunity: XAU/USD’s Bull & Bear Heist Strategy!Hello Money Makers & Market Bandits! 🤑💰✈️
Get ready to raid the XAU/USD Gold Market with our cunning Thief Trading Style, blending sharp technicals and deep fundamental insights! 📊🔥 Our plan? Strike with precision on both bullish and bearish moves, grabbing profits before the market turns. Let’s outwit the charts and stack that gold! 🏆💸
📈 The Gold Heist Plan
Entry Points 🚪:
🏴☠️ Bullish Move: Wait for a pullback to the Institutional Hidden Buy Zone at 3080—your signal to jump in for bullish gains!
🏴☠️ Bearish Move: Watch for a breakout below the neutral level at 3200—time to ride the bearish wave!
Tip: Set alerts to catch these key levels! 🔔
Stop Loss (SL) 🛑:
Bullish Trade: Place SL at 2960 (4H swing low, Institutional Hidden Buy Zone).
Bearish Trade: Set SL at 3360 (4H swing high).
Adjust SL based on your risk, lot size, and number of orders. Stay sharp—this is your shield! ⚠️
Take Profit (TP) 🎯:
Bullish Robbers: Aim for 3660 or exit early if momentum fades.
Bearish Robbers: Target 3080 or slip out before the market flips.
Escape Plan: Watch for overbought/oversold signals to avoid traps! 🚨
📡 Why XAU/USD?
The Gold Market is in a bearish trend 🐻, driven by:
Fundamentals: USD strength from Fed policy, US growth, and tariffs.
Macroeconomics: US resilience vs. global economic weakness.
COT Data: Bearish speculative bets favor USD.
Intermarket: Rising US yields and equities boost USD, pressuring gold.
Quantitative: RSI and Fibonacci confirm bearish momentum.
🧠 Sentiment Outlook (May 12, 2025)
Retail Traders:
🟢 Bullish: 42% 😊 (Hoping for gold rebound on trade war fears)
🔴 Bearish: 45% 😟 (USD strength and improved US-China relations weigh)
⚪ Neutral: 13% 🤔
Source: Social sentiment & trading platform polls
Institutional Traders:
🟢 Bullish: 30% 💼 (Safe-haven demand amid geopolitical uncertainty)
🔴 Bearish: 60% ⚠️ (USD rally and higher concrete 5/12/2025)
🟢 Bullish: 30% 💼 (Safe-haven demand amid geopolitical uncertainty)
🔴 Bearish: 60% ⚠️ (USD rally and higher yields suppress gold)
⚪ Neutral: 10% 🧐
Source: COT reports & institutional flows
⚠️ Trading Alert: News & Risk Management 📰
News can shake the market like a storm! Protect your loot:
Skip new trades during major news releases.
Use trailing stop-loss to lock in profits and limit losses.
Stay vigilant—volatility is our playground, but only with a plan!
💪 Ride with the Thief Trading Team!
Hit the Boost Button to power up our Thief Trading Style and make this heist epic! 🚀 Each boost fuels our squad, helping us plunder profits daily. Let’s conquer the XAU/USD market together! 🤝
Stay tuned for the next heist! 🐱👤 Keep your charts ready, alerts on, and trading vibe high. Catch you in the profits, bandits! 🤑🎉
#ThiefTrading #XAUUSD #GoldHeist #TradingView #StackTheGold
CrowdStrike Holdings, Inc. – AI-Native Cybersecurity Powerhouse Company Snapshot:
CrowdStrike NASDAQ:CRWD remains a top-tier cybersecurity leader, redefining endpoint and cloud protection through its AI-powered Falcon platform, securing some of the most critical digital infrastructures in the world.
Key Catalysts:
Falcon Platform – AI-First, Cloud-Native 🧠☁️
Unified security architecture: endpoint, identity, cloud, and data
Leverages real-time analytics, automation, and continuous threat hunting
Widely recognized as a gold standard in modern cybersecurity (GigaOm, Gartner)
Elite Partnerships = Ecosystem Synergy 🤝
Named Google Cloud’s 2025 Security Partner of the Year
Deep collaborations with AWS, Microsoft Azure, and NVIDIA
Embedded in cloud-native DevOps workflows = high stickiness and TAM expansion
AI + Cyber = Next-Gen Growth Tailwind 🚀
Integrating generative AI and autonomous detection to proactively prevent threats
Strategic positioning at the intersection of cloud security and AI operations
Key enabler of Zero Trust architectures for global enterprises
Massive Market Opportunity 🌍
Global cyber budgets rising amid escalating threats
CrowdStrike well-positioned for land-and-expand growth via Falcon modules
Expanding presence in identity protection, XDR, and managed services
Financial Edge:
Consistent 30%+ YoY revenue growth
High gross margins (~77%)
Strong free cash flow generation, underpinning long-term profitability
📈 Investment Outlook
✅ Bullish Above: $370.00–$375.00
🚀 Upside Target: $600.00–$620.00
🎯 Thesis: Platform leverage, elite partnerships, and AI innovation make CrowdStrike a core cybersecurity growth leader for the AI era.
#CrowdStrike #Cybersecurity #AI #CRWD #FalconPlatform #CloudSecurity #NextGenTech

Walt Disney Co | DISThe Walt Disney Company is reportedly exploring options to sell or find a joint venture partner for its India digital and TV business, reflecting the company's ongoing strategic evaluation of its operations in the region. The talks are still in the early stages, with no specific buyer or partner identified yet. The outcome and direction of the process remain uncertain. Internally, discussions have commenced within Disney's headquarters in the United States as executives deliberate on the most viable course of action. These deliberations signify the company's willingness to adapt and optimize its business operations to align with changing market dynamics. The Wall Street Journal reported on July 11 that Disney had engaged with at least one bank to explore potential avenues for assisting the growth of its India business while sharing the associated costs. This approach suggests a proactive stance by the company to explore partnerships or arrangements that can drive growth while minimizing financial burdens. While it is too early to ascertain the exact direction this exploration will take, the developments in Disney's India business warrant attention, as they may shape the future landscape of the company's presence in this all-important region.
The ongoing shift from traditional TV to streaming has placed Disney and its competitors in a costly and transformative phase. As part of this transition, Disney is actively cutting costs amid macroeconomic challenges that have impacted its advertising revenue and subscriber growth. CEO Bob Iger has been at the forefront of these changes, and his contract was recently extended through 2026 to allow him sufficient time to make transformative changes while strengthening the bench with future leaders of the company.
One of the key considerations for Disney is evaluating its portfolio of TV networks, including ABC and ESPN. Bob Iger has expressed a willingness to be expansive in assessing the traditional TV business, leaving open the possibility of selling certain networks while retaining others acknowledging that networks like ABC may not be core to Disney's new business model. ESPN, as a cable TV channel, is being approached differently. Disney is open to exploring strategic partnerships, such as joint ventures or offloading ownership stakes, to navigate the challenges faced by the sports network. CEO Iger, who had previously expressed pessimism about the future of traditional TV, has found the situation to be worse than anticipated since his return to Disney.
Although the linear networks segment, which accounts for Disney's TV properties such as ABC, National Geographic, FX, and FreeForm, has struggled to grow in the recent past, this segment is still an important part of the company's business, which is evident from the positive operating income reported by this segment in fiscal 2022. As below data reveals, the DTC business and content licensing made operating losses in FY 2022 which were offset by the operating income reported by linear networks. For this reason, investors will have to closely monitor a potential sale of TV assets to evaluate the impact of such a decision on Disney's profitability.
The broadcasting landscape is experiencing a significant shift, with uncertainties surrounding its future and the changing nature of consumer preferences. While linear television channels are not expected to disappear immediately, their consumption continues to decline as viewers increasingly favor OTT platforms. This transition represents a fundamental trend shaping the industry. In terms of business models, subscription video-on-demand (SVOD) services will continue to grow with targeted advertising.
As the ascent of streaming video continues, cable, satellite, and internet TV providers in the United States faced their most significant subscriber losses to date in the first quarter of 2023. Analyst estimates indicate a collective shedding of 2.3 million customers during this period. Consequently, the total penetration of pay-TV services in occupied U.S. households, including internet-based services like YouTube TV and Hulu, dropped to its lowest point since 1992, standing at 58.5%, according to Moffett's calculations.
In Q1, pay-TV services in the U.S. witnessed a nearly 7% decline in customers compared to the previous year, with cable TV operators experiencing a 9.9% decline, while satellite providers DirecTV and Dish Network registered subscriber losses of 13.4%. Virtual MVPDs, which are multichannel video programming distributors, also suffered significant losses, shedding 264,000 customers during the quarter. Comcast, the largest pay-TV provider in the country, lost 614,000 video customers in Q1, and Google's YouTube TV was the only tracked provider to experience subscriber growth, adding an estimated 300,000 subscribers during the period. These trends illustrate the challenges faced by the pay-TV industry, with factors like increasing sports-broadcast fees driving retail prices higher, leading to cord-cutting and subsequent price adjustments by distributors. By 2026, e-Marketer predicts that the number of non-pay TV households will surpass pay TV households by over 25 million.
In efforts to achieve profitability in the streaming business, Disney has implemented significant cost-cutting measures, including saving $5.5 billion through cost reductions and layoffs, and a focus on making Disney+ and Hulu more profitable. Disney aims to enhance Hulu integration, seeing it as a vital component of the company's transition from TV to a streaming-only model. Discussions are also underway for Disney to acquire Comcast Corporation's (CMCSA) stake in Hulu, as Disney currently holds 66% ownership. The company believes that the integration of Hulu and Disney+ will bolster the streaming business and contribute to its profitability. While the negotiations with Comcast over Hulu's valuation are ongoing, the combined offering of Disney+ and Hulu is expected to be available to consumers by the end of the calendar year. Although Disney's plans for ESPN+ and the fate of its other cable channels, such as the Disney Channel, remain uncertain, Bob Iger expects ESPN to eventually move to a streaming-only model, acknowledging the disruptive nature of the traditional TV business model.
The discussions surrounding Walt Disney's TV and streaming business in India come at a critical juncture for the company, as it grapples with intensified competition and significant challenges in the market. The emergence of Reliance Industries' JioCinema streaming platform has posed a considerable threat to Disney's dominance, especially after Reliance secured digital rights for the highly popular Indian Premier League cricket tournament. This strategic move by Reliance, which offered free access to the tournament earlier this year, caused a substantial decline in Disney+ Hotstar's subscribers, a popular streaming service under Disney's India business.
Additionally, Viacom18, which is backed by Reliance and Paramount Global (PARA), made a significant impact on Disney's market position in India. Through its partnership with Warner Bros, Viacom18 secured content rights to popular shows on HBO including Succession, previously aired on Disney's platform. This collaboration forms a formidable alliance challenging Disney's dominance in the Indian market. Reliance's freemium model poses the most significant threat to Disney's current position. By offering content for free on its streaming platform, JioCinema attracted a substantial number of subscribers through the broadcast of IPL. With its ample cash reserves, Reliance has the advantage of focusing on subscriber growth without immediately focusing on monetization strategies. The loss of streaming rights for the IPL, combined with a subsequent decline in paid subscribers, had a profound impact on Disney's reputation in India in the first quarter of this year, which could very well be the most challenging Q1 Disney has had in India for a long time.
A report on video consumption trends in India by Media Partners Asia sheds light on the dynamic landscape of the online video sector in India. For the 15 months that ended in March 2023, total consumption across the online video sector reached a staggering 6.1 trillion minutes. During this period, Disney+ Hotstar emerged as the dominant player in premium VOD, capturing 38% of viewing time. The report attributes Hotstar's success to its strong sports offerings and the depth of its Hindi and regional entertainment content.
During the survey period, Zee and Sony together held a 13% share of the Indian premium video sector viewing time. While the two companies are expected to merge pending regulatory approval, they are projected to operate independently for another year, benefiting from strong engagement across sports as well as regional, local, and international content. Prime Video and Netflix, Inc. (NFLX) collectively accounted for a 10% share of viewership in the premium VOD category. Prime Video also garnered a significant portion of viewership from regional Indian titles. The report emphasizes that local content dominates premium VOD viewership, particularly outside the sports category, while international content leads paid tiers. Catch-up TV is prevalent in the free tier across freemium streaming platforms.
Although Disney was the clear winner in 2022, this report highlights a significant shake-up in the market brought about by the transformation of JioCinema. JioCinema, which previously held a mere 2% share of the premium video market, experienced a major upswing in growth since April. This surge can be attributed to JioCinema's decision to offer free live streaming of the popular IPL cricket tournament, a property that was previously exclusive to Disney-owned media in India. Despite technical glitches impacting user experience, JioCinema witnessed a more than 20-fold increase in consumption in April 2023, enabling it to dominate the premium VOD category. The report raises questions about JioCinema's ability to sustain this growth and scale in the absence of IPL action after June 2023. That being said, this could be an early indication of growth challenges Disney-owned brands may face in India.
Star India, now known as Disney Star following the rebranding last year, is expected to experience a revenue drop of around 20% to less than $2 billion for the fiscal year ending September 2023. Additionally, EBITDA is projected to decline by approximately 50% compared to the previous year. Furthermore, Hotstar is estimated to lose 8 to 10 million subscribers in its fiscal third quarter as well.
Given the current scenario, finding an outright buyer for Disney's India business is expected to be challenging. When Disney acquired the entertainment assets of 21st Century Fox in 2019, the enterprise value of the Indian business was estimated at around $15-16 billion. This high valuation, coupled with the intense competition and declining subscriber base, presents a complex landscape for potential buyers or partners.
I believe Disney stock is attractively valued today given that the company's streaming business has a long runway for growth internationally while its brand assets will continue to drive revenue higher. As an investor, I am both concerned and curious about what the future holds for Disney's linear networks segment. Going by the recent remarks of CEO Iger, major changes are on their way. A strategic decision to divest non-core assets, in my opinion, will trigger a positive response from the market. That being said, a major divestment of TV assets could materially impact the company's profitability in the next 3-5 years until its streaming business scales enough to replace lost revenue from the linear networks segment. Investors will have to closely monitor new developments to identify a potential inflection point in Disney's story.

Airbnb | ABNB Airbnb is the leader in Alternative Accommodations and experiences. I believe their community of individual hosts and strong brand differentiates them from travel peers. The emerging trend of long-term stays would boost Airbnb’s profit margins and expand the entire travel accommodation market size
Airbnb estimates its current total addressable market to be $3.4 trillion, including $1.8 trillion in short term stays, $ 210 billion in long term stays, and $ 1.4 trillion in experiences. Coupled with a notably underpenetrated market size, the global travel market is growing at an above GDP rate. Airbnb’s current market penetration represents less than 2% of the share. As such, there is a huge runway for Airbnb’s growth over the next decade.
In terms of competition, most Online Travel Agencies (OTA) provide traditional hotel accommodation (Marriott, Hilton, Accor, Wyndham, and InterContinental, for example). These OTAs are not the real competitors for Airbnb. Instead, Booking.com (BKNG) is expanding its traditional hotel business into the alternative accommodation industry. Expedia (EXPE) entered the alternative accommodation market via the acquisition of VRBO in December 2015. However, Airbnb has the first-mover advantage with a very strong brand. I believe Airbnb’s technology and supplies are superior to their peers, and it is hard for Expedia and Booking.com to compete against Airbnb in the alternative accommodations space.
One of the main expenses for Online Travel Agencies is sales and marketing. They have to spend billions of dollars on Google, Facebook, and other social media platforms to attract traffic.
The table below shows the sales and marketing expenses as a percentage of sales. Both Booking.com and Expedia spend almost half of their sales on sales and marketing. According to Airbnb’s disclosure, 80% of their website traffic comes from direct and organic search. In contrast, Booking.com and Expedia only have 60% direct traffic. In other words, Airbnb has the highest brand awareness among these travelers. With a high ratio of direct traffic and organic search, Airbnb spends much less than its peers.
In Q1 FY23’s earning call, Airbnb indicated their sales and marketing expense as percentage of sales would remain the same in FY23.
In late 2019, Airbnb's costs were rising, and growth was slowing. They spent a huge amount of money on performance marketing, which was basically selling their products as a commodity. Their product was looking less different from their competitors. When the COVID occurred, they lost 80% of sales in eight weeks, and they shut down all marketing spending. Interestingly, when the travel market rebounded, Airbnb's business came back to almost the same level as before, with much less marketing expenses. Currently, they spend much less on performance marketing, and most of their expenses are focused on their products/services. They have had 600,000 articles about Airbnb. These efforts have put Airbnb in a much better shape today.
90% of Airbnb's hosts are individuals. Airbnb can capitalize on the personal experience provided by these unique individual hosts, as opposed to a standard hotel service. Customers can find unique properties, differentiated amenities, as well as local insights from these individual hosts.
Airbnb is putting in a lot of effort into the experience market. In Q4 FY22's earnings call, Airbnb expressed that they were beginning to ramp up their Airbnb Experience business and expect to launch more products/services over the coming years. In my opinion, Airbnb Experience may not bring notable direct sales to Airbnb, but it would enhance the stickiness and loyalty of Airbnb's customers. Airbnb Experience would make the Airbnb platform unique and boost their sales indirectly.
Furthermore, Airbnb Experience could become more relevant with AI technology. In Q1 FY23's earnings call, Airbnb disclosed that they are building AI into their products. Airbnb is working with OpenAI ChatGPT, and Airbnb will embed ChatGPT into their app. The AI powered product will be launched next year.
Leveraging AI technology, Airbnb can make their Airbnb Experience and accommodation recommendations more relevant to any consumer. To put it another way, Airbnb would know your preferences for travel destinations and accommodations before you start searching for anything.
Long-term Stay: As disclosed, 20% of Airbnb's gross bookings are long-term stays currently. Long-term stays are the fastest-growing segment in terms of trip length. The pandemic also accelerated some inevitable growth for long-term stays.
Long-term stays mean higher margins for both hosts and Airbnb. In Q1 FY23's earnings call, Airbnb indicated that long-term stays would be one of the biggest growth areas over the next five years. Airbnb made over a dozen upgrades to long-term stays based on affordability, and they also have new discounting tools for hosts on weekly and monthly stays. Airbnb expects more hosts to exclusively list long-term stays with Airbnb.
In addition, 62% of Airbnb's guests are under 34 years old, and Airbnb is focusing on the next generation of travelers. These young customers are more likely to use Airbnb as the platform for long-term stays. The key thing to remember is that more long-term stays mean higher margins for Airbnb.
Airbnb indicated that, in the current macroeconomic environment, consumers are looking for affordable ways to travel on Airbnb. Airbnb is adding more affordable accommodations to their platform. The average price of Airbnb rooms is only $67 per night.
Before the pandemic, 80% of Airbnb's sales were coming from either cross-border or urban accommodations. The cross-border business would contribute more sales to Airbnb than other types of travel. The cross-border traveling could be very weak if high inflation persists. Despite this, the global travel market had been growing fast in the past, and I expect the growth will continue in the future.
We are using a two-stage DCF model to estimate Airbnb’s fair value. In the model, we assume 20% of normalized sales growth rate, which we believe is quite conservative.
We assume they can expand their operating margin by 30bps annually and will reach 25.5% in FY32.Their free cash flow conversion was quite healthy in the past, and we assume they will deliver 35.8% in FY32.
In addition, we use 10% of WACC, and 15% of nonGAAP tax rate in the model.
The present value of Free Cash Flow to the Firm (FCFF) over the next 10 years is estimated to be $32 billion, and the present value of terminal value is $88 billion. As such, the total enterprise value is estimated to be $120 billion. Adjusting gross debt and cash balance, the fair value of the stock price is $ 200, according to our estimate.
All things considered, the huge underpenetrated market, strong brand awareness, and growing trend of long-term stays, in my opinion, will provide Airbnb with a huge runway for growth over the next decade. Their competitors are way behind them, and Airbnb would be the best player for the alternative accommodation service provider. In my view, the current stock price is significantly undervalued, and we encourage investors to buy during the weakness.
at the end I always bet on Brian Chesky

Take Two | TTWO & GTA VI. Part IITakeTwo Interactive is preparing for the biggest catalyst in the company's history with the release of GTA 6. Although no definitive timetable has been set for GTA 6, the game will almost certainly release in 2024 or 2025 at the latest given all the information that has come out. Moreover, TTWO itself has started opening up about GTA 6, which is a hint that an announcement is near. The impact that GTA 6 will have on TTWO cannot be understated, given how much resources have been spent developing GTA 6 and the growing consumer frenzy surrounding the title.TTWO could see more upward momentum as GTA 6's release closes in.
GTA 6 is by far the most anticipated video game in the industry's history. The game is so hyped, in fact, that individuals have crashed televised events purely to protest for the release of GTA 6. Even Starfield, which is an incredibly hyped game in its own right, had it Gamescon presentation disrupted by a fan calling for GTA 6. GTA 6 has not even been announced yet, and it seems to have fully captured the attention of the gaming world.
This level of organic hype is an incredibly positive sign for TTWO and its investors. Despite the fact that GTA 5 had nowhere near the hype as GTA 6 at similar stages in their development, GTA 5 still managed to become the best-selling triple A game ever made, with ~185 million units sold. This is a testament to GTA 6's potential, both on a commercial and even cultural standpoint.
If GTA 6 manages to meet or exceed consumer expectations, TTWO should see its shares surge. Given the hysteria surrounding the title, positive reviews will only supercharge demand as consumers will likely find any reason to get their hands on the game. Considering the amount of resources TTWO is rumored to be spending on developing GTA 6, coupled with Rockstar's track record of producing masterpieces, there is very little chance that GTA 6 disappoints.
While GTA is TTWO's most important IP, the company also boasts a strong lineup beyond GTA. In fact, some of its other franchises are bestsellers in their own right. Red Dead Redemption, for instance, has sold more than 55 million units and continues to sell at a solid pace despite the game being nearly 5 years old. Red Dead Redemption has also been critically praised as one of the best triple A games ever made.
TTWO currently has one of its most robust product pipelines in the history of the company across all of its studios. The company has even diversified into mobile gaming, which is proving to be an increasingly large segment in the gaming industry. In fact, TTWO made a huge acquisition in Zynga for a whopping $12.7 billion. Zynga is one of the largest mobile gaming studios in the world and owns massively popular IPs like FarmVille.
Despite TTWO's growing pipeline, the company is still relatively top-heavy compared to peers like EA (EA) or Activision Blizzard (ATVI). This means that underperformance for its flagship franchises, especially GTA, will almost certainly cause the company's value to plummet. So much of TTWO's future prospects are dependent upon the success of GTA 6, especially considering how much revenue the game is expected to pull in.
To gain some perspective on how important the GTA franchise is for TTWO, GTA has generated over $8 billion in revenue since GTA 5's release in 2013. TTWO itself is only worth ~$23 billion. GTA online, for instance, still contributes heavily to the company's recurring revenue and bookings, which came in at $1.2 billion in its most recent quarter.
TTWO has a huge opportunity with GTA 6. The game has garnered unprecedented hype that is starting to grow to a fever pitch. If TTWO delivers a solid sequel, GTA 6 could potentially deliver revenues upwards of ~$20 billion over the next decade, given the revenue trajectory of GTA sequels. At TTWO's current valuation of $23 billion, the company has far more upside, given the potential of GTA 6 and the company's growing pipeline of popular titles.

GOOGL (Alphabet Inc.) – Medium-Term Position Trade SetupNASDAQ:GOOGL is showing strength as it revisits its previous all-time high, now aligning with the 50% Fibonacci retracement of the current wave. The price action suggests a bullish flip of resistance into support at the $153 zone, with clear signs of buyer defense—offering a compelling medium-term opportunity.
🔹 Entry Zone:
Around $153 (support zone)
🎯 Take Profit Targets:
🥇 $200
🥈 $230
🛑 Stop Loss:
Weekly close below $130

$2.55 to $9.30 $VEEE$2.55 to $9.30 NASDAQ:VEEE was just one of awesome movers to give great payday if you weren't too greedy 💵
Stocks that make +300% +500% moves in a day out of nowhere can also come out with offering news as company tries to get paid from the move which just happened in the market. That is the reason of stock drop and it usually happens outside of regular hours so if you buy in the morning you can ride it whole day if you want, but it's smart to lock some if not all of the massive profit into end of day and the get back in again next morning if no offering news.

JOHNSON AND JOHNSON: Re-accumulation is targeting $175.JNJ is neutral on its 1D technical outlook (RSI = 49.991, MACD = -1.040, ADX = 18.184) as it's only trading around its 1W MA50 but having made an impressive rebound 4 weeks ago inside the Demand Zone. This is the 4th time this Demand Zone provided a rally and the last one even crossed over the 3 year LH trendline that kept the stock on a downtrend since 2022. The breakout confirmed the emergence of a HH trendline which is taking the stock on a new multiyear bullish path. We expect at least one more high on the HH before the end of the year (TP = 175.00).
## If you like our free content follow our profile to get more daily ideas. ##
## Comments and likes are greatly appreciated. ##

Alphabet (GOOGL) Shares Drop Over 7% in a Single DayAlphabet (GOOGL) Shares Drop Over 7% in a Single Day
According to the Alphabet (GOOGL) stock chart, yesterday’s main trading session opened around $163.70 but then saw a sharp decline, hitting an intraday low of approximately $148 per share. By the close, bulls managed to recover only a small portion of the losses. As a result, Alphabet (GOOGL) shares fell by more than 7% during the session – marking the worst performance among the S&P 500 constituents (US SPX 500 mini on FXOpen).
Why Did GOOGL Shares Fall?
The drop followed remarks by Eddy Cue, Apple’s Senior Vice President of Internet Software and Services, who:
→ noted a decline in search traffic on Safari;
→ revealed plans to expand Safari’s search capabilities using artificial intelligence.
These developments heightened concerns over Google’s dominance in search and its advertising revenue. According to media reports, analysts are warning of rising competition from AI-powered search platforms such as OpenAI, Grok, and Perplexity.
Technical Analysis of Alphabet (GOOGL) Shares
In our 23 April analysis, we identified a descending price channel and emphasised the psychological significance of the $150 level, which had served as a key support in 2024.
Since then, bulls showed confidence by pushing the price above the red channel. In addition, the chart has begun to outline a potential ascending trend channel (marked in blue).
However, yesterday’s statement from competitors shifts the outlook. The current GOOGL stock price is positioned at the lower boundary of the blue channel – which could act as support, reinforced by the psychological $150 level.
On the other hand, a bearish breakout below this area may revive the downtrend that began in February, potentially paving the way for a test of this year’s lows.
This article represents the opinion of the Companies operating under the FXOpen brand only. It is not to be construed as an offer, solicitation, or recommendation with respect to products and services provided by the Companies operating under the FXOpen brand, nor is it to be considered financial advice.

Huge 540% day from $0.61 to $3.91⤴️ Huge 540% day from $0.61 to $3.91 for NASDAQ:ASST
Alerted to buy it twice along the way 🎯🎯 both nice wins
Also traded AMEX:GPUS

GOOG Simple Short TradeCRACK!
GOOG has now broken a key area with the potential to have a huge move down.
This is a very simple trade with great risk/reward.
Bulls!! Caution is in order!!

STOCKS | MARKET WATCH | Why Long-Term Investing Still Wins🤯 The start of 2025 was a bit of a rollercoaster for stocks.
Global markets got seriously rattled in the first few months by some sudden jitters. When President Trump announced those aggressive tariffs, it caused significant concern among investors, sending stock markets tumbling and prompting a flight to safety. Like Reuters said, April was "epic" for crazy market swings – the VIX fear index shot up to levels we hadn't seen since 2020 and 2008, and then just as quickly dropped back down. Markets went wild.
But then, by late April, the panic kind of ... disappeared. Once President Trump paused the implementation of the most severe tariffs, stocks bounced back pretty sharply. The S&P 500 recovered most of what it lost. After that nasty drop, it ended April only about 5% lower than it started the year. The Nasdaq, with all its tech stocks, pretty much ended the month where it began. So, after all that drama, major US stock markets weren't far from their all-time highs, showing how fast that "fear" can vanish.
📊 How key indexes did
S&P 500 (USA): 📉 Dipped in early April but bounced back late. Ended April around -5% for the year, after almost hitting a bear market.
Nasdaq Composite (USA): 📉 Similar story. Tanked on the tariff scare, then rallied when things calmed down, ending April pretty much flat for the year.
MSCI World (Global developed markets): 🤷♂️ Had its ups and downs along with the US markets. By the end of April, it was pretty much flat for the year – no big moves for the overall world index.
MSCI Emerging Markets: 📉 Didn't do as well as developed markets. Asian stocks, especially, took a hit early April because of trade war worries, so this index lagged, even though it recovered a bit by the end of the month.
FTSE/JSE All-Share (South Africa): 🇿🇦 The odd one out! The JSE jumped about +5% in the first three months of 2025, mainly thanks to mining stocks. It even hit a record high in March. The April craziness shook it up too, but because it did so well earlier, it was still slightly up for the year by late April.
Takeaway? Global stocks were jumpy, but they mostly recovered. By late April, most major indexes were close to where they started the year. South Africa's market was the exception, having a good first quarter that helped it weather the April storm.
⏳ Staying invested beats trying to be a stock Wizard
All this back and forth can make investors nervous. You start thinking, "Should I just sell now before it drops even more?" But history usually says that's the wrong move. Just sticking with it usually works out better than trying to guess the market's next move. BlackRock's iShares recently pointed out that "waiting for the 'right time' to invest might mean missing out on the best days," while staying invested lets you benefit from that "compounding" thing and get through the short-term bumps. Simply put, if you sit on the sidelines during big swings, you often miss the big rebound days. One study even showed that if you missed just the five best market days over 20 years, you'd end up with way less money than someone who just stayed in the market.
The legendary investor Charlie Munger put it simply: "The first rule of compounding: never interrupt it unnecessarily." Trying to jump in and out of the market around all the volatility is super tough – the biggest up days often follow right after the biggest down days. On the other hand, patient investors who just ride out the noise tend to grab more of those long-term gains. After all, with compounding, those small gains build on each other over time.
💰 The awesome power of compounding over time
Compounding basically means the sooner you invest and the longer you stay invested, the more your returns build on each other like a snowball rolling downhill. For example, the total return JSE All-Share index was up almost 23% over the last year. That kind of gain shows how just staying invested during good times can really grow your wealth. If you'd panicked and pulled out, you would have missed most of that growth. Over longer periods, like 5 to 10 years, the JSE has almost always gone up. The big lesson is that it's about "time in the market," not trying to "time the market," that really makes your returns grow and smooths out those bumps along the way.
🌍 What's driving the markets and the economy
There were a few big things happening that explain why the markets moved the way they did.
🇺🇸 US GDP Slowdown: The US economy actually shrank a bit in the first quarter of 2025. A lot of people blamed this on a big surge in imports as businesses bought stuff ahead of those potential President Trump tariffs. Even though this news spooked the stock market briefly in late April, underlying consumer spending was still looking pretty decent.
📈 US Company Profits: On the bright side, US companies reported some pretty strong profits. Analysts were expecting good growth in earnings for the S&P 500 in the first quarter, even with the economic slowdown. And it turned out even better – a lot of companies beat expectations, and overall earnings were up quite a bit from last year. This helped keep stock prices from falling too much during the pullbacks.
🇪🇺 European Spending Boost: In Europe, governments are starting to spend more. Germany, for example, proposed a huge fund for infrastructure and energy. The EU is also loosening its spending rules and increasing defense budgets. Some experts think this could actually boost Europe's economic growth a bit each year, which would mean better profits for European companies. Some even think European companies might see faster profit growth than US companies in the next few years because of this spending.
🇨🇳 Asia and Trade Wars: Asia was the weak spot. China's economy showed some signs of trouble, with a survey suggesting its manufacturing activity might have shrunk in April after a couple of months of growth. This seemed to be a direct result of the US tariffs. Asian stock markets took a hit on the tariff news, which dragged down the overall emerging markets index. Basically, tariffs and trade tensions hurt growth in Asia and its markets, which then affected returns in emerging markets globally.
✅ The bottom line
Early 2025 reminded us that markets can freak out quickly – but they can often bounce back just as fast. The swings felt scary, but history tells us that just sticking with your investments usually pays off. Major stock markets are pretty much where they were a few months ago, while economies and company earnings are still moving forward. For long-term investors, that wild week in April just reinforced an old lesson: stay invested and let compounding do its thing. As some experts say, "get invested and stay invested" because the most volatile times often have the biggest market gains. By sticking to your plan, you avoid missing those big up days when the "fear" fades and markets recover.
_________________________
SP:SPX
Sources: Recent market reports and data including the April SATRIX 2025 market newsletter “Once Again, Volatility Blinked and Fear Lost., nasdaq.com, reuters.com, ishares.com, insight.factset.com, reuters.com, iol.co.za

Eli Lilly (LLY) Shares Fall Over 15% in MayEli Lilly (LLY) Shares Fall Over 15% in May
The share price of Eli Lilly and Company (LLY), the world’s largest pharmaceutical company, has seen a sharp shift in market sentiment:
→ From its April low to high, LLY shares rose by over 30%;
→ However, since the start of May, the LLY stock price has dropped more than
15% — the closing price on the last trading day of April was around $895, while today the share is trading near $775.
Why Are Eli Lilly (LLY) Shares Falling?
The decline can be attributed to three key factors:
1→ Q1 Earnings Report: Although the company reported earnings per share above expectations ($3.34 vs $3.25), investors may have been concerned by significantly higher spending on research and development.
2→ Competitor Partnership: CVS Health’s announcement that it will offer Novo Nordisk’s Wegovy instead of Lilly’s Zepbound added further pressure to LLY shares.
3→ Sector Sentiment: Broader biotech sentiment turned negative following reports that the Trump administration is considering a pricing model that would cap drug prices based on lower rates in other countries.
The media is also discussing upcoming decisions from Vinay Prasad, the new head of the FDA division overseeing vaccines and gene therapy.
Technical Analysis: Eli Lilly (LLY) Share Chart
Key price movements (marked on the chart) justify the formation of a downward channel.
On the one hand, bearish sentiment may intensify in light of recent developments. The median line of the channel could act as resistance to any upward movement.
On the other hand, bulls may find support around the $765 level — a former resistance point and the boundary between two price gaps.
This article represents the opinion of the Companies operating under the FXOpen brand only. It is not to be construed as an offer, solicitation, or recommendation with respect to products and services provided by the Companies operating under the FXOpen brand, nor is it to be considered financial advice.

Stellantis N.V.Key arguments in support of the idea
The company's shipments are projected to recover in the latter half of the year.
STLA's valuation appears significantly lower compared to its industry peers
Investment Thesis
Stellantis N.V. Stellantis N.V. (STLA), a leading global automotive manufacturer, stands as a dominant force in both North American and European markets. The company boasts a diverse and comprehensive portfolio of automobile brands, encompassing renowned names such as Jeep, Fiat, Peugeot, Maserati, Dodge, Opel, and Chrysler. Ranking among the top five automakers worldwide in passenger car shipments, Stellantis derives approximately 45% of its total revenue from its sales in North America.
Last week, the White House signaled a policy shift by announcing the easing of tariffs for the automotive industry, providing a potentially positive catalyst for automaker stocks. On April 3, the U.S. imposed a 25% tariff on the importation of foreign-manufactured automobiles. This measure will be extended to include similar duties on imported auto parts beginning May 3. The Big Three, namely Ford, General Motors, and Stellantis, produces a portion of its vehicles and several auto parts for the U.S. market in Canada and Mexico. Consequently, these companies
have experienced significant stock declines since the beginning of the year, attributable to the new tariffs. Notably, while three out of every five cars sold by Stellantis in the U.S. are assembled domestically, approximately 20% of their components are imported and thus subject to the 25% tariff. Last Tuesday, President Donald Trump unveiled relaxed tariffs on auto parts, permitting U.S. automakers to reclaim up to 3.75% of the car’s total cost at retail for previously paid duties. This tariff relief could substantially aid Stellantis in recuperating most of its tariff expenses. If 20% of all components in automobiles produced in the region are subject to the 25% tariff, the effective tariff cost on the total vehicle will be 5%, of which 3.75% can be reimbursed. Thus, without any immediate alterations to their supply chains—which they currently have no plans to modify—the duty on a U.S.- manufactured vehicle effectively reduces to 1.25% of its final retail price. While closures and suspensions of certain production sites are inevitable, the overall impact of these duties is less severe than anticipated just weeks prior. It is our assessment that these Big Three automobile manufacturers possess the resilience and strategic capability to navigate and adapt to the newly imposed tariff environment.
Stellantis is strategically realigning its model portfolio, signaling a potential recovery in its market share. In the first quarter of 2025, the automaker unveiled three new models and is poised to introduce an additional ten models aimed at the U.S. and European markets by year's end. This comes despite a 9% y/y decline in shipments during the first quarter. However, the company has managed to bolster its market share in Europe, a trend attributed to the invigorated product lineup. We anticipate that this revitalization will enable Stellantis to achieve a 7.8% y/y increase in shipments during the second half of the year, reaching 2.8 million units. Nonetheless, first-half shipments are expected to remain subdued, a development largely anticipated by current consensus estimates.
STLA shares remain notably undervalued within the automotive sector, presenting a more economical option compared to its peers. Currently, Stellantis is trading at a 2024 EV/EBITDA multiple of 1.4x, significantly lower than the median figure of 3.8x for the six largest U.S. automakers by market share. This year, the company is confronting a "double whammy" of challenges. In addition to contending with the potential financial burden of tariffs, Stellantis has also been grappling with substantial inventory levels—a repercussion of its waning pricing competitiveness. Despite these hurdles, we view this as a strategic opportunity to initiate a long position. It is anticipated that the automotive giant will navigate the emerging challenges of 2025 effectively.
Our target price for the Company is set at $11.3, with a "Buy" recommendation. To mitigate any potential downside risks, we suggest setting a stop-loss at $8.7.

NATRIUM | Investing | Why BILL GATES is Betting on NATRIUMBill Gates is betting big on Natrium - should you be, too?
Natrium is this next-generation nuclear reactor design that's attracting a lot of attention from people like Bill Gates and other major investors. What's particularly interesting about it is that it combines a fast reactor with a built-in molten salt "battery." Essentially, it can generate a steady output of power and then provide an extra boost during peak demand by drawing on its stored heat. This design aims for greater flexibility in meeting fluctuating electricity needs.
The technology is a joint development by TerraPower, the company co-founded by Bill Gates, and GE Hitachi. They're presenting it as a zero-carbon power source capable of reliably backing up intermittent renewables like wind and solar, ensuring a consistent supply of clean energy.
The excitement from investors like Bill Gates appears to be driven by the need to address climate change and secure reliable energy supplies. They view Natrium as a way to deliver large-scale, carbon-free power while potentially overcoming some of the limitations of older nuclear reactor designs. Gates has emphasized the enhanced safety features and potential for lower operating costs. Furthermore, Natrium's specific design to complement the intermittency of solar and wind, through its energy storage, is a significant draw for investors looking at future energy solutions. The substantial public and private investment, including government funding and bipartisan legislative support, also signals strong confidence in this technology.
The description of TerraPower as a "Bill Gates-backed" firm developing this multi-billion dollar demonstration plant highlights the high-profile nature of the project. The fact that corporate partners, such as the data center company exploring Natrium for their power needs, are also getting involved indicates a broader recognition of its potential beyond just government initiatives.
Compared to traditional nuclear reactors, Natrium offers some potential advantages. Its sodium coolant operates at near-atmospheric pressure, simplifying safety compared to the high-pressure water systems in older designs. This allows for natural heat dissipation in case of issues, reducing the risk of large steam explosions. Another key aspect is Natrium's potential for more efficient fuel utilization and reduced long-lived waste generation. The design aims for better fuel efficiency and a smaller volume of long-term radioactive waste compared to current light-water reactors.
Natrium's primary advantage over wind and solar is its dispatchability. Unlike the intermittent nature of renewables, Natrium can provide power consistently, 24/7. The integrated energy storage allows it to complement renewables by absorbing excess energy or releasing power during periods of low renewable output. This firm grid support is a significant benefit for utilities concerned about grid stability and the variability of renewable sources.
For utilities transitioning away from coal, Natrium offers a carbon-free, relatively direct replacement in terms of power output. It also has a smaller land footprint compared to large-scale wind or solar installations.
There are inherent challenges with a first-of-a-kind system like Natrium. The prototype is still under construction, lacking a proven operational track record. Construction and licensing processes could face delays and cost overruns. Critics also raise valid points about the actual safety and cost-effectiveness compared to projections. The use of sodium coolant, while offering safety advantages, also presents risks due to its reactivity with air and water, requiring robust containment systems. Regulatory scrutiny will undoubtedly be extensive.
And fuel supply is a critical uncertainty. Natrium requires high-assay, low-enriched uranium (HALEU), which is not currently widely available. Disruptions in the supply chain and limited existing production capacity pose a significant risk to the timely and cost-effective operation of Natrium plants.
Looking ahead, Natrium is being considered for deployment in regions needing reliable power to complement renewables and to power energy-intensive industries. The long-term vision involves integrating Natrium with renewable energy sources to create a more stable and decarbonized grid.
The speculative outlook for Natrium in the next 5-10 years is heavily dependent on the successful completion of the Wyoming demonstration plant. If it meets its targets, it could pave the way for wider adoption. However, the timeline is ambitious, and challenges related to fuel supply and regulatory approvals remain. A successful demonstration could trigger significant investment and adoption in the coming decades, positioning Natrium as a key player in the energy transition.
If you're interested in investing in companies involved with TerraPower's Natrium reactor, several publicly traded firms are integral to its development and supply chain:
🔧 Engineering & Construction
KBR Inc. | (NYSE: KBR)
KBR has formed a strategic alliance with TerraPower to commercialize and deploy Natrium reactors globally. The collaboration focuses on creating a replicable contracting framework to reduce financial risk and ensure cost transparency in deploying Natrium technology.
terrapower.com
⚛️ Nuclear Fuel & Components
BWX Technologies Inc. | (NYSE: BWXT)
BWXT has been awarded a contract by TerraPower to design the Intermediate Heat Exchanger for the Natrium demonstration project. This component is critical for transferring heat within the reactor system.
Centrus Energy Corp. | (NYSE American: LEU)
Centrus Energy is collaborating with TerraPower to establish domestic production capabilities for high-assay, low-enriched uranium (HALEU), which is essential for fueling the Natrium reactor.
⚙️ Manufacturing & Industrial Partners
Doosan Enerbility Co., Ltd. | 034020.KQ (KOSDAQ)
Doosan Enerbility is supplying critical components for the Natrium reactor, including the core barrel and internal supports.
HD Hyundai | 329180.KQ
HD Hyundai is manufacturing the reactor vessel for the Natrium project.
🌍 International Collaborators
SK Inc. | 034730.KQ
SK Inc., a South Korean conglomerate, has invested $250 million in TerraPower to support the demonstration and commercialization of the Natrium reactor.
Korea Hydro & Nuclear Power (KHNP) | 15760.KS (KOSPI)
KHNP has entered into a strategic collaboration with TerraPower to support the Natrium project, leveraging its expertise in nuclear power development.
OTHERS:
1. Mirion Technologies (NYSE: MIR)
Mirion is supplying the Radiation Monitoring System (RMS) and Nuclear Instrumentation System (XIS) for the Natrium Reactor Demonstration Project in Wyoming.
2. GE Vernova (NYSE: GEV)
Through its subsidiary, Global Nuclear Fuel–Americas (GNF-A), GE Vernova is partnering with TerraPower to establish the Natrium Fuel Facility in Wilmington, North Carolina. This facility aims to produce high-assay, low-enriched uranium (HALEU) fuel essential for the Natrium reactor.
3. NuScale Power Corporation (NYSE: SMR)
While not directly involved with the Natrium project, NuScale is a prominent developer of small modular reactors (SMRs), a category that includes Natrium. The company's advancements in SMR technology contribute to the broader nuclear energy landscape.
4. Southern Company (NYSE: SO)
Southern Company is collaborating with TerraPower on the development of a molten chloride fast reactor (MCFR), a separate advanced nuclear project. Their involvement in advanced nuclear technologies aligns with the innovations seen in the Natrium project.
________________________________
Sources: Recent industry reports and news articles and TerraPower press releases provide the data above. Also put together with the help of AI.
world-nuclear-news.org, ans.org, gatesnotes.com, scientificamerican.com, terrapower.com, reuters.com

Apple Shares (AAPL) Drop Below $200Apple Shares (AAPL) Drop Below $200
Late last week, Apple released a quarterly report that beat analysts’ expectations:
→ Earnings per share: actual = $1.65, forecast = $1.63
→ Revenue: actual = $95.36bn, forecast = $94.5bn
However, today AAPL stock price is below the psychological $200 mark, over 7% lower than last week’s high (point E).
Why did AAPL shares fall?
According to media reports, investors were concerned about weaker-than-expected services revenue and disappointing sales in China. These factors have renewed fears that the ongoing US–China trade tensions could have a deeper impact on Apple going forward.
Bearish sentiment may also have been amplified by Warren Buffett’s decision to step down as head of Berkshire Hathaway — as we noted yesterday — since his company is one of Apple’s major shareholders.
Technical Analysis of Apple Shares (AAPL)
Key AAPL price action patterns (marked) show a sequence of lower highs and lows, forming the basis for a downward channel. Fibonacci ratios reinforce bearish characteristics in price movements:
→ The rise from B to C is approximately 50% of the decline from A to B
→ The rise from D to E is around 50% of the decline from A to D
This technical picture suggests a potential bear market, where rallies may be corrective rebounds following impulsive drops. This strengthens the scenario in which AAPL shares could continue falling within the established descending channel.
This article represents the opinion of the Companies operating under the FXOpen brand only. It is not to be construed as an offer, solicitation, or recommendation with respect to products and services provided by the Companies operating under the FXOpen brand, nor is it to be considered financial advice.

MICROSTRATEGY: Big 1W MA50 rebound targeting $845 at worst.MicroStrategy is on excellent bullish technicals on its 1D outlook (RSI = 67.412, MACD = 25.350, ADX = 58.097), capitalizing on the double bottom rebound on the 1W MA50 four weeks ago. Technically that was also a HL bottom on the 2 year Channel Up. The minimum rise it delivered on a bullish wave was +263.38%. Based on that, the trade is long, TP = $845.
## If you like our free content follow our profile to get more daily ideas. ##
