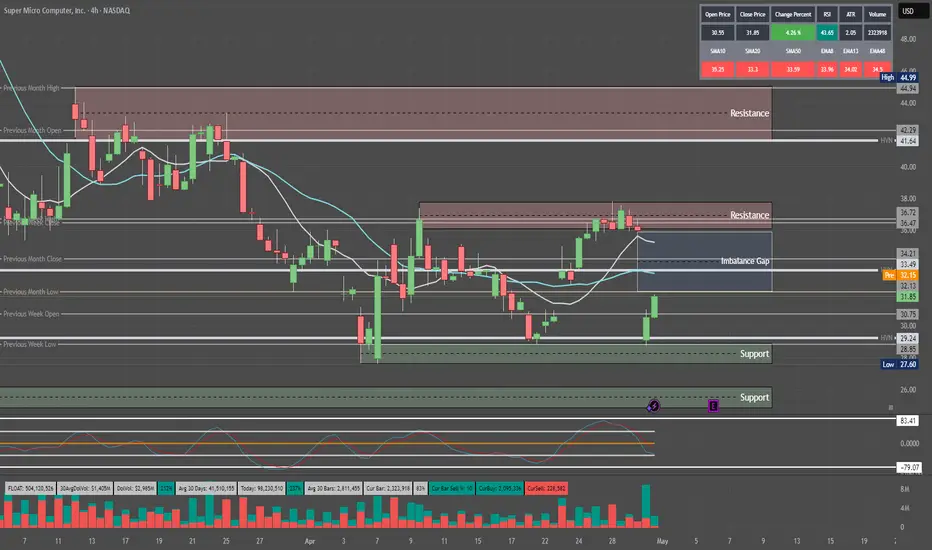
#SRF Trading Zone & predictions 5 may 2025 1st ragistance 3033
2nd ragistanc 3123
1st support 2780
2nd suport 2618
OI Deta Base trade Negetive
RSi Base Negetive
Praise Action base negetive Retresment move fib level 0.5 to 0.618
mor all detail in chart pls chek it chart
Stocktrading

BROADCOM: Long term Channel Up points to $350 within 2025.AVGO is bullish on its 1D technical outlook (RSI = 64.250, MACD = 3.500, ADX = 29.483) as last week it crossed and close over its 1W MA50 and on the current 1W candle it is about to close over the 0.618 Fibonacci retracement level as well. This is similar to the November-December 2022 fractal that followed after the last major market bottom. Both sequences bottomed on the same 1W RSI level (34.80), so the structures share more similarities than differences. Since the 3 year pattern is a Channel Up, the stock is now on the new bullish wave aiming for the next HH. The 2022 rebound reached the 1.618 Fib extension before consolidating for weeks, so our long term target is the current 1.618 Fib (TP = $350.00).
## If you like our free content follow our profile to get more daily ideas. ##
## Comments and likes are greatly appreciated. ##

Quantum's SMCI Trading Levels 5/1/25Really don't understand this stock but retail really loves it. Seems like they want to push this to 36 for a possible run up into earnings before possibly dumping.

What Is Dollar-Cost Averaging (DCA) in Investing and Trading?What Is Dollar-Cost Averaging (DCA) in Investing and Trading?
Dollar-cost averaging (DCA) is a popular strategy used by investors and traders to manage market fluctuations and build positions over time. Instead of trying to time the market, DCA focuses on consistent, regular investments regardless of price movements. This article answers “What is DCA?”, its advantages and limitations, and how it can be applied in both investing and trading.
What Is Dollar-Cost Averaging (DCA)?
So what is DCA investing? Dollar-cost averaging (DCA) is a strategy that involves consistently investing a fixed sum at regular intervals, regardless of the asset’s current price. This approach helps distribute the cost of purchases over time, potentially reducing the impact of short-term price fluctuations. Instead of trying to time the market perfectly—a challenging task even for experienced traders—a dollar-cost averaging strategy focuses on regular contributions to average the cost of assets.
This method offers a straightforward, disciplined strategy for both long-term investors and traders who wish to build or adjust positions gradually. By spreading out purchases, a DCA strategy may help mitigate the effects of market volatility. For example, during a period of market decline, the fixed investment buys more units at a lower cost, which could result in higher returns when prices recover. Conversely, during a sustained rise, the investor buys fewer units, which helps avoid overexposure. For example, if you invest $50 every week and the market is rising, you will buy fewer stocks, but when the market is moving down, you will buy more with the same amount.
What does DCA mean for market participants? DCA is particularly useful in uncertain economic environments where price swings are common. It provides a systematic approach to entering the market, removing the need to make snap decisions based on short-term market movements, and fostering a steady accumulation of assets over time.
How Does DCA Work?
DCA investing operates by establishing a regular schedule for investing a set amount of money into a chosen asset, regardless of its current market price. Instead of waiting for a particular price or market condition, funds are allocated at consistent intervals—be it weekly, monthly, or quarterly. Over time, this means buying more units when prices are lower and fewer units when prices are higher, resulting in an average purchase price that can be lower than if the investment was made in one lump sum.
Consider an investor using DCA. They commit £100 every month to buy company shares. In the first month, the share price is £20, so they purchase 5 shares. The next month, the price drops to £10, allowing them to buy 10 shares with the same £100. In the third month, the price rises to £25, and they purchase 4 shares.
Over three months, the investor has spent £300 and acquired 19 shares in total. To calculate the average cost per share, divide £300 by 19, which equals approximately £15.79 per share. This average is lower than the highest price paid and reflects the effect of buying more shares when prices are low and fewer when prices are high.
DCA also simplifies the process of entering the market. By adhering to a set timetable, investors bypass the need for constant market analysis, making it particularly appealing for those who prefer a more hands-off strategy. This systematic approach can be applied not only to traditional investments like shares and funds but also to other assets that traders and investors engage with.
DCA in Trading
DCA isn't just for long-term investors; traders can also employ it to navigate the ups and downs of fast-moving markets. By spreading out their entries or exits, traders may potentially lower the average cost of a position or build on a winning trend, all while managing their exposure to volatile moves.
Lowering the Average Price
For traders facing a position that's moving against them, DCA offers a way to adjust the average entry cost. By allocating additional funds, the average price of the position may be reduced. This approach can create a potential opportunity to exit with better returns if the market reverses. However, it is important to note that this method also increases exposure, and additional entities might compound losses if the trend continues.
Adding to a Winner
Conversely, traders may apply DCA to increase their positions when an asset shows strength. By gradually adding to an effective trade, the overall exposure is built in a controlled manner, potentially capturing further movement without committing all capital at once. This method is particularly popular in markets where momentum builds slowly, allowing traders to gradually take advantage of the sustained trend.
Applications Across Markets
Using DCA in stocks can help manage entries during periods of volatility, especially when market sentiment shifts rapidly. Forex traders often use similar techniques to adjust positions in response to fluctuating currency pairs, while the high volatility seen in crypto* markets makes DCA an appealing strategy for building positions gradually.
When using DCA in trading, a disciplined approach is essential. Whether lowering the average cost in a losing position or building on an effective trade, traders should carefully consider the additional risk that comes with increased exposure.
Advantages of Dollar-Cost Averaging
Dollar-cost averaging offers a range of advantages that make it an attractive strategy for both investors and traders, especially when navigating uncertain markets.
Mitigating Market Volatility
By investing a fixed amount at regular intervals, DCA spreads out exposure over time. This approach can reduce the impact of sudden market swings. Instead of being affected by a one-off high price, the average cost is spread across different market conditions. This may help stabilise entry points and smooth out short-term volatility.
Disciplined Investment Approach
DCA promotes a structured investment routine. With regular contributions, there is less temptation to try timing the market. This disciplined approach might be particularly useful when markets are highly volatile or ahead of news and economic events. It encourages systematic investing, reducing the likelihood of making impulsive decisions driven by market noise.
Accessibility for All Traders
DCA does not require intricate market analysis or deep expertise in market timing. Its straightforward nature makes it appealing to both newcomers and seasoned traders looking for a simpler method to build positions over time. By providing a clear framework, DCA allows traders to focus on long-term goals without the pressure of constant market monitoring.
Limitations of Dollar-Cost Averaging
While dollar-cost averaging offers a structured approach to investing and trading, there are some limitations to consider.
Potential Opportunity Cost
Spreading out investments means funds are gradually deployed over time. In a market that is consistent, waiting to invest might lead to missed returns compared to committing all funds upfront. This method can reduce the impact of volatility but might underperform during extended trends.
Continued Exposure to Market Trends
Investors remain exposed to the market throughout the investment period. If the market experiences a prolonged trend, regular investments will accumulate at better prices, but overall returns may still suffer. This approach does not eliminate market risk and requires a long-term perspective to potentially see a turnaround.
Dependence on Consistency
The effectiveness of dollar-cost averaging relies heavily on maintaining a consistent investment schedule. Any interruption or inconsistency can dilute the intended advantages of the strategy. It also assumes that investors are able to commit regular funds, which may not be feasible in all financial situations.
Comparing DCA to Lump-Sum Investing
Comparing DCA to lump-sum investing offers insights into different approaches to managing market exposure and returns.
Risk Exposure
Lump-sum investing involves placing all available funds into an asset at once. This method can yield higher returns if the market moves in their favour, but it also exposes the investor to immediate risk if the market moves against them. In contrast, risk is spread over time through a dollar-cost average, meaning regular investments reduce the likelihood of entering the market at a high point and potentially lowering the overall average cost.
Market Conditions
The performance of each approach can vary depending on market trends. In steady trends, lump-sum investing may capture more returns since all funds are deployed early. However, in volatile or declining conditions, DCA could mitigate the effects of short-term fluctuations by smoothing out entry prices over time.
Flexibility and Commitment
Lump-sum investing requires confidence and a readiness to commit all funds immediately. DCA, on the other hand, offers a more measured entry into the market. This method is popular among those who prefer a systematic approach and might not have a large sum available at one time.
The Bottom Line
Understanding the dollar-cost averaging definition can help investors and traders potentially manage market volatility and reduce emotional decision-making. While it has its limitations, DCA can be an effective strategy for building positions over time.
FAQ
What Is an Example of Dollar-Cost Averaging?
Imagine investing £100 into a stock every month, regardless of its price. In January, the stock costs £20, so you buy five shares. In February, the price drops to £10, allowing you to buy 10 shares. In March, the price rises to £25, and you buy four shares. Over three months, you’ve invested £300 and purchased 19 shares, averaging out your cost per share to £15.79.
Is There the Best Dollar-Cost Averaging Strategy?
The most effective DCA strategy depends on individual goals. A consistent, long-term approach with regular investments—whether weekly or monthly—may help smooth out market volatility. Focusing on diversified assets could also reduce risk exposure.
What Is the Daily DCA Strategy?
This strategy involves investing a fixed amount every day through DCA, meaning it may help minimise the impact of short-term price fluctuations in volatile markets. However, it requires careful planning due to frequent transactions and potential fees.
Does Dollar-Cost Averaging Work With Stocks?
Yes, DCA is commonly used with stocks. It may help manage the effects of market volatility, allowing investors to build positions over time without worrying about short-term price swings.
What Does DCA Mean in Stocks?
DCA, or dollar-cost averaging, in stocks, means regularly investing a fixed amount, regardless of price, to average out the cost per share over time and manage market volatility. A similar answer is true for “What does DCA mean in crypto*?”, except it would involve a regular fixed investment in a particular cryptocurrency*.
How to Calculate DCA in Crypto* Investing?
There is a simple formula to calculate DCA, meaning in crypto*, an investor would just divide the total amount invested by the total number of units purchased. This provides the average cost per unit over time, regardless of price fluctuations.
*Important: At FXOpen UK, Cryptocurrency trading via CFDs is only available to our Professional clients. They are not available for trading by Retail clients. To find out more information about how this may affect you, please get in touch with our team.
This article represents the opinion of the Companies operating under the FXOpen brand only. It is not to be construed as an offer, solicitation, or recommendation with respect to products and services provided by the Companies operating under the FXOpen brand, nor is it to be considered financial advice.

NVIDIA: Don't turn your back on the A.I. darling yet.NVIDIA has turned neutral on its 1D technical outlook (RSI = 48.902, MACD = -2.040, ADX = 28.815) as it has recovered a portion of the 2 month correction. April's low was exactly on the 1W MA100 just like the Low of the 2024 consolidation phase has been near the 1W MA50. The pattern is recurring and the rallies naturally get weaker each time as we approach the end of the Cycle this year. The 1st rally was +358%, the 2nd +257% so the 3rd one now is expected to be +157%. That gives a $225 target. The next Top will most likely start a new correction (Bear Cycle) for a 3rd Bottom on the 1W MA200.
## If you like our free content follow our profile to get more daily ideas. ##
## Comments and likes are greatly appreciated. ##

META Share Price Rises Cautiously Ahead of Earnings ReportMETA Share Price Rises Cautiously Ahead of Earnings Report
As shown on the Meta Platforms (META) chart, the share price rose by approximately 1% yesterday. This movement was supported by the announcement of the launch of the Meta AI app—an artificial intelligence-based application that will function as a personal assistant on mobile phones (similar to Google Gemini).
In a different market environment, the news might have prompted a more positive reaction. However, traders currently appear to be exercising caution, as Meta Platforms (META) is due to report its quarterly results after the close of the main trading session today. According to media reports, expectations include:
→ Revenue in the range of $41.35–$41.5 billion, which implies a year-on-year increase of roughly 13–14%.
→ Earnings per share (EPS) between $5.22 and $5.29, indicating a 11–12% rise compared to the same period last year.
Key Factors in Meta’s Quarterly Report
The following areas are likely to have a significant impact on META's share price in the wake of the report:
→ Advertising business , Meta’s primary revenue stream (around 96%). There is a possibility that US tariff policies could prompt major Chinese advertisers—such as Temu—to reduce their advertising spend in the United States.
→ Investment in Artificial Intelligence (AI) and Augmented Reality . Market participants may revise their valuation of the stock downwards if there are lingering concerns over the long-term return on these investments.
→ Forward guidance on revenue and earnings for the next quarter and full year 2025. These forecasts will carry particular weight in an environment of elevated uncertainty linked to US trade policy.
Most Wall Street analysts maintain a “Buy” rating on Meta shares. However, some have lowered their price targets in April, noting that the stock has lost roughly a third of its value since its all-time high in February.
Technical Analysis of Meta Platforms (META)
Price movements earlier in 2025 continued to trace a rising trend channel (shown in blue), with a run of 19 consecutive days of gains in February following upbeat news. However, this trend channel appears to have lost relevance at this stage.
The psychological level of $500 now offers strong support, while the $585 level has turned into resistance. It is reasonable to expect that the earnings report could trigger heightened volatility and a test of one of these key price levels.
This article represents the opinion of the Companies operating under the FXOpen brand only. It is not to be construed as an offer, solicitation, or recommendation with respect to products and services provided by the Companies operating under the FXOpen brand, nor is it to be considered financial advice.

S&P 500 Rally Exhausted? Watch This Level for the Next Drop!The S&P 500 Index( SP:SPX ) has finally touched the Resistance zone($5,680-$5,500) as I expected in my previous post .
The S&P 500 Index is moving near the Resistance zone($5,680-$5,500) , the Resistance line, and Yearly Pivot Point .
Also, we can see the Regular Divergence(RD-) between Consecutive Peaks .
In terms of Elliott Wave theory , it seems that the S&P 500 Index is completing the Zigzag Correction(ABC/5-3-5) , and if the uptrend line breaks , we can confirm the end of the Zigzag correction .
When the S&P 500 Index started to rise on April 22 , Bitcoin also started to rise at the same time , so a decline in the S&P 500 Index can cause Bitcoin ( BINANCE:BTCUSDT ) to decline .
I expect the S&P 500 Index to drop to at least $5,313 AFTER breaking the uptrend line .
Note: If the S&P 500 Index touches $5,712, we can expect more pumps.
Please respect each other's ideas and express them politely if you agree or disagree.
S&P 500 Index Analyze (SPX500USD),2-hour time frame.
Be sure to follow the updated ideas.
Do not forget to put a Stop loss for your positions (For every position you want to open).
Please follow your strategy and updates; this is just my Idea, and I will gladly see your ideas in this post.
Please do not forget the ✅' like '✅ button 🙏😊 & Share it with your friends; thanks, and Trade safe.

BBTC BUY NOW BBTC - BOMBAT BURMAH TRADING COMPANY
STRONG FUNDAMENTAL STOCK
See Technical View
Monthly - Higher Low
Day - Trend Reversed
Entry - 1829 Rs
StopLoss - 1586 Rs
Target - 2867 Rs
Expected Return - 56 %
Thank You .. Happy Trading

Quantum's Walmart (WMT) Trading Guide 4/28/25WMT’s weekly outlook balances its defensive resilience against macroeconomic headwinds, with a comprehensive synthesis of technical, market, and strategic factors guiding its trajectory for weekly options contracts. The FAME framework underscores WMT’s long-term bullish potential, driven by robust fundamentals (+5% revenue, $0.58 EPS, 21% e-commerce growth) and adaptability (AI, Walmart+), positioning it as a resilient player in a risk-off regime. However, elevated yields (10-year 4.255%, 20-year 4.738%, 30-year 4.721%) and a stable DXY at 99.58 amplify tariff pressures and margin concerns, capping upside and reinforcing a cautious stance. A tactical long bias is favored for weekly contracts, targeting a bounce from $94.36 to $96.47–$98.50, with a short stance viable below $88.50 if support fails.
Technical implications highlight bullish momentum on daily (RSI ~40, Stochastic ~28) and weekly (RSI ~44, Stochastic ~32) timeframes, with oversold conditions signaling a rebound potential for weekly contracts if $94.36 holds. Monthly neutral momentum (RSI ~50) suggests consolidation, requiring a breakout above $96.47 to confirm bullish strength. This supports a short-term bounce but advises monitoring for sustained moves.
Market influence implications reflect a risk-off environment, with high yields and a stable DXY increasing import costs, particularly amid tariff uncertainty from WMT’s upcoming Trump meeting. The VIX at 24.84 amplifies volatility, favoring WMT’s defensive appeal but heightening risks. WMT’s Q3 FY25 strength and e-commerce growth provide stability, supporting resilience near $94.36.
OFD summary and implications reveal bearish pressure from Vanna (-$0.04), Charm (-$0.02), and DEX (-$0.06), driven by put-heavy flow and hedging demand tied to tariff fears. However, GEX (+$0.08) at the $95 strike pins price, stabilizing volatility and supporting a neutral-to-bullish bounce for weekly contracts if $94.36 holds, aligning with oversold technicals.
Edge insights bolster the case for a bounce, with institutional buying at $94–$95 signaling accumulation, defensive retail sector strength outperforming cyclicals, and low short interest (1.4%) offering squeeze potential above $96.47. These factors enhance confidence in a tactical long bias for weekly contracts, provided support holds.
Strategic outlook implications emphasize consolidation near $95.09, with $94.36 as a critical pivot. A break below risks $88.50, driven by tariff fears and bearish options flow, while a move above $96.47 targets $98.50, fueled by oversold signals and institutional support. The VIX at 24.84 and put-heavy options flow underscore volatility, but WMT’s defensive positioning mitigates downside, favoring a bounce in a risk-off regime.
In summary, WMT’s weekly outlook hinges on defending $94.36, with oversold technicals, GEX pinning, and institutional buying supporting a bounce to $96.47–$98.50 for weekly contracts. Tariff risks, high yields, and DXY stability maintain a risk-off backdrop, capping upside and requiring vigilance for a break below support, which could shift bias to bearish. This balanced approach leverages WMT’s defensive strengths while navigating weekly volatility, aligning with Buffett’s preference for resilient businesses with tactical opportunities.

IBM Share Price Falls Following Earnings ReportIBM Share Price Falls Following Earnings Report
Yesterday, after the close of the main trading session, International Business Machines (IBM) released its Q1 earnings report, exceeding Wall Street analysts’ expectations in several key areas. According to FactSet:
→ Earnings per share came in at $1.60 (forecast = $1.42), although this was below last year’s figure of $1.68.
→ Quarterly revenue reached $14.54 billion (forecast = $14.39 billion), marking a 1% increase year-on-year.
Initially, IBM shares rose on the news, but then dropped by approximately 6% during after-hours trading, according to Google Finance.
This suggests that today’s trading session may see IBM shares open below the $230 mark.
Market participants may have been disappointed by the following:
→ IBM’s mainframe business (large-scale computing systems designed for high-volume data processing) continued its decline, falling by 6% year-on-year.
→ Revenue from software and consulting divisions increased, but only by 3% compared to the same period last year.
→ The revenue forecast for Q2 stands at $6.6 billion – a 3% decline relative to the same quarter in 2024.
Technical Analysis of IBM Share Price
The chart shows signs of seller activity above the psychological level of $250. As indicated by the arrows, the price attempted several rallies above this level with varying momentum, but each time retreated back.
At the same time, price fluctuations formed a downward channel, which was extended to the downside in early April amid news regarding new tariffs in international trade.
Price stabilisation observed between 15–17 April suggests that supply and demand were temporarily balanced ahead of the earnings release. However, the negative market reaction to the report may shift sentiment and act as a catalyst for further price movement towards the lower boundary of the channel, around the key support level of $215.
This article represents the opinion of the Companies operating under the FXOpen brand only. It is not to be construed as an offer, solicitation, or recommendation with respect to products and services provided by the Companies operating under the FXOpen brand, nor is it to be considered financial advice.

What Is the Advance-Decline (A/D) Line, and How Can You Use ItWhat Is the Advance-Decline (A/D) Line, and How Can You Use It in Trading?
The Advance-Decline (A/D) Line is a widely used market breadth indicator that provides insights into the strength of trends by tracking advancing and declining stocks. Popular among traders analysing indices like the NASDAQ, it helps identify broad participation or hidden divergences. This article explores how this indicator works and its role in effective market analysis.
What Is the Advance-Decline Line?
The Advance-Decline (A/D) line, also known as the Advance-Decline Index, is a popular market breadth indicator used to gauge the overall health of a market's movement. Instead of focusing solely on price changes in an index, it analyses how many stocks are participating in the market's rise or fall. This makes it particularly useful for traders looking to understand whether a trend is supported by widespread participation or driven by just a handful of stocks.
The indicator can be set up based on stocks on different exchanges. For example, a NYSE Advance-Decline line provides insights into NYSE-listed stocks. However, it can be applied to any index or exchange, resulting in the Nasdaq Advance-Decline line or a line based on stocks listed in the UK, Australia, Europe, or Japan.
At its core, the A/D line is a cumulative measure of the net advances of stocks on a given day. The calculation is as follows:
1. Count the number of advancing stocks (those that closed higher than their previous close).
2. Count the number of declining stocks (those that closed lower than their previous close).
3. Subtract the number of declining stocks from the advancing stocks to get the net advance.
4. Add this net advance to the previous day’s A/D line value.
Formally, the Advance-Decline line formula is:
Net Advances = Advancing Stocks − Declining Stocks
Current A/D Line Value = Previous A/D Line Value + Net Advances
For example, if 500 stocks advanced and 300 declined on a given day, the net advance would be +200. If yesterday’s A/D Line value was 10,000, today’s value would be 10,200. Over time, these daily values form a line that tracks the cumulative net advances.
The indicator provides insights into sentiment. A rising line indicates more advancing stocks than declining ones, while a falling line suggests the opposite. Traders often use this data to determine whether a price trend in an index reflects broad strength or is being carried by a few heavyweights.
Understanding Market Breadth
Market breadth measures the extent to which individual assets are contributing to a market's overall movement, providing a clearer picture of the strength or weakness behind trends. Rather than relying solely on an index's price performance, breadth gives traders insights into how widespread participation is within a rally or decline. This information is crucial for understanding whether market moves are broad-based or concentrated in a few influential assets.
A market with a strong breadth typically sees most stocks or assets moving in the same direction as the overall trend. For example, during a rally, broad participation—where a large percentage of assets are advancing—signals a robust and healthy trend. Conversely, weak breadth occurs when only a small group of assets drives the movement, potentially indicating fragility in the trend. This is especially important in large indices where a few heavily weighted assets can mask underlying weaknesses.
How Traders Use the A/D Line
The A/D Line is more than just a market breadth indicator—it’s a practical tool traders use to gain insight into the strength and sustainability of trends. By analysing how the indicator behaves in relation to price movements, traders can uncover potential hidden opportunities and spot potential risks. Let’s consider how the Advance-Decline line behaves on a price chart.
Identifying Trend Strength
One of the A/D Line’s key uses is evaluating the strength of a market move by examining overall participation. When both the A/D Line and an index rise together, it suggests widespread buying activity, with most stocks contributing to the rally. Similarly, if both the index and the A/D Line decline, it often reflects broad-based selling, indicating that weakness is widespread across the market rather than concentrated in a few assets.
Spotting Divergences
Divergences between the A/D line and price are closely watched by traders. For instance, if an index continues to rise but the A/D line starts declining, it could signal that the trend is losing momentum. Conversely, when it begins rising ahead of a price recovery, it may suggest underlying strength before it becomes apparent in price action.
Complementing Other Indicators
Traders often pair the A/D line with other tools to refine their analysis. For example, combining it with moving averages or oscillators like RSI can help confirm signals or highlight discrepancies. A rising A/D line alongside RSI rising above 50 might reinforce the possibility of a price rise.
Strengths of the A/D Line
The A/D line is a widely respected tool for understanding market dynamics, offering insights that price-based analysis alone can’t provide. Its ability to measure participation across a broad range makes it especially valuable for traders looking to assess sentiment and trend reliability. Let’s explore some of its key strengths.
Broad Market Perspective
The A/D line captures the performance of all advancing and declining stocks within an index, offering a comprehensive view of how much support a trend has. Instead of focusing solely on a handful of large caps that often dominate indices, the indicator reveals whether the majority are moving in the same direction. This helps traders gauge the true strength of a rally or decline.
Early Warnings of Weakness or Strength
Divergences between the A/D line and the price can act as an early signal of potential changes in momentum. When the A/D Line deviates from the overall trend, it can highlight areas where market participation is inconsistent. This allows traders to assess whether a trend is gaining or losing support across a broad range of assets, offering clues about potential shifts before they fully materialise in price action.
Applicability Across Markets
Another strength is its versatility. The A/D line can be applied to indices, sectors, or even individual markets, making it useful across various trading strategies. Whether monitoring a broad index like the S&P 500 or a specific sector, the indicator can be adapted to provide valuable insights.
Limitations of the A/D Line
While the A/D line is a useful tool for analysing breadth, it isn’t without its limitations. Traders need to understand its drawbacks to use it effectively and avoid potential misinterpretations. Here are some of the key challenges to consider.
Ignores Stock Weighting
One major limitation is that the A/D index gives equal weight to every stock, regardless of size or market capitalisation. In indices like the S&P 500, where a small number of large-cap stocks often drive performance, this can create a disconnect. For example, a large-cap stock’s strong performance might lift an index while the indicator shows weakness due to low-caps underperforming.
Vulnerability to Noise
The index can produce misleading signals in certain conditions, such as during periods of low trading volume or heightened volatility. Market anomalies, such as large fluctuations in a small number of stocks, can skew the indicator and make it less reliable. This can be especially problematic in thinly traded assets or at times of high speculation.
Not a Standalone Indicator
The A/D line is combined with other tools. On its own, it doesn’t account for factors like momentum, valuation, or sentiment, which can provide critical context. Traders relying solely on it may miss out on key details or overemphasise its signals.
Comparing the A/D Line with Other Market Breadth Indicators
The A/D Line is a powerful tool, but it’s not the only market breadth indicator traders use. By understanding how it compares to other indicators, traders can select the one that suits their analysis needs or combine them for a more comprehensive view.
A/D Line vs Advance-Decline Ratio
The A/D Ratio measures the proportion of advancing to declining stocks. While the A/D line provides a cumulative value over time, the ratio offers a snapshot of market breadth for a single trading day. The A/D Ratio is often better for identifying short-term overbought or oversold conditions, whereas the A/D line excels at tracking long-term trends.
A/D Line vs McClellan Oscillator
The McClellan Oscillator uses the same advancing and declining stock data but applies exponential moving averages to calculate its value. This approach makes the McClellan Oscillator more sensitive to recent market changes, allowing it to highlight turning points more quickly than the A/D line. However, the A/D line’s simplicity and cumulative nature make it more straightforward to interpret for broader trend analysis.
A/D Line vs Percentage of Stocks Above Moving Averages
This indicator tracks the percentage of stocks trading above specific moving averages, such as the 50-day or 200-day. While the A/D line focuses on daily advances and declines, the moving average approach highlights whether stocks are maintaining longer-term momentum. The A/D line provides a broader perspective on participation, whereas this indicator zeros in on sustained trends.
The Bottom Line
The Advance-Decline line is a valuable tool for traders seeking deeper insights into market trends. By analysing market breadth, it helps identify potential opportunities and risks beyond price movements alone.
FAQ
What Is the Meaning of Advance-Decline?
Advance-decline refers to the difference between the number of advancing stocks (those that closed higher) and declining stocks (those that closed lower) on a specific trading day. It’s commonly used in market breadth indicators like the NYSE Advance-Decline line to measure the overall strength or weakness of the market.
How to Find Advance-Decline Ratio?
The Advance-Decline ratio compares advancing stocks to declining stocks in an index. It is calculated by dividing the number of advancing stocks by the number of declining stocks.
How to Use an Advance-Decline Line Indicator?
The A/D line indicator tracks the cumulative difference between advancing and declining stocks. Traders analyse its movement alongside price trends to assess market participation. For example, divergence between the A/D line and an index price direction can signal potential changes in momentum.
What Is the Advance-Decline Indicator Strategy?
Traders use the Advance-Decline indicator to analyse market breadth, identify divergences, and confirm trends. For example, a rising A/D line with an index suggests broad participation, while divergence may signal weakening trends.
This article represents the opinion of the Companies operating under the FXOpen brand only. It is not to be construed as an offer, solicitation, or recommendation with respect to products and services provided by the Companies operating under the FXOpen brand, nor is it to be considered financial advice.

Nvidia - The Chart Just Told Us So!Nvidia ( NASDAQ:NVDA ) might just still head a little lower:
Click chart above to see the detailed analysis👆🏻
After Nvidia perfectly retested the previous rising channel resistance just a couple of months ago, it was quite expected that we'll see a retracement. The overall trend however still remains bullish and if Nvidia drops a little more, the overall bullrun continuation rally might just follow.
Levels to watch: $80
Keep your long term vision,
Philip (BasicTrading)

What Is a PD Array in ICT, and How Can You Use It in Trading?What Is a PD Array in ICT, and How Can You Use It in Trading?
The PD array, or Premium and Discount array, is a key concept within the Inner Circle Trader methodology, designed to help traders map market movements and identify high-probability zones. By breaking down price behaviour into premium and discount levels, along with tools like order blocks and fair value gaps, the PD array provides a structured framework for analysis. This article explores its components, applications, and how traders can integrate it into their strategies.
What Is a PD Array?
An ICT PD array, short for Premium and Discount array, is a concept developed by Michael J. Huddleston, the mind behind the Inner Circle Trader (ICT) methodology. At its core, the PD array is a framework used to organise price levels and zones on a chart where significant institutional activity is likely to occur. These zones highlight areas of interest such as potential support or resistance, points where liquidity resides, or regions that might attract price movement.
The PD array divides the market into two primary zones: premium and discount. These zones help traders gauge whether the price is above or below its equilibrium, often calculated using the 50% level of a significant price range. In practical terms, prices in the premium zone are typically considered attractive in a downtrend and unattractive in an uptrend, while prices in the discount zone are more attractive in an uptrend and less attractive in a downtrend.
Beyond premium and discount zones, PD arrays include specific elements like order blocks, which are regions linked to institutional buying or selling, and fair value gaps (FVGs), which are imbalances or gaps in price that the market often seeks to revisit. Together, these elements create a structured roadmap for traders to interpret price behaviour.
Unlike a static indicator, an ICT PD array is dynamic and requires traders to interpret price movements in real time, considering the broader market context. It’s not a quick fix but a methodical approach to understanding how price delivers across different levels, offering a clearer view of where high-probability reactions could occur. The PD array is often combined with other ICT concepts, like market structure shifts or SMT divergence, to sharpen analysis and focus on precise market opportunities.
Premium and Discount Zones of a PD Array
The foundation of a PD array starts with defining the premium and discount zones. This is typically done by identifying a significant price swing—either a low to a high or vice versa—and applying a Fibonacci retracement. The 50% level of this range serves as the equilibrium point, dividing the chart into two zones:
- Premium zone: Price levels above 50%, often considered less attractive in an uptrend and more attractive in a downtrend.
- Discount zone: Price levels below 50%, seen as more attractive in an uptrend and less attractive in a downtrend.
This equilibrium acts as a baseline, helping traders assess whether the price is likely to reverse, consolidate, or continue based on its position relative to the 50% mark.
Tools Within the PD Array
The PD array doesn’t rely on a fixed set of tools. Instead, it offers a collection of components traders can use to refine their analysis. While the choice of tools can vary, they’re often ranked in a loose hierarchy, known as a PD array matrix, based on their importance within the ICT methodology. Let’s break down how this structure works.
Order Blocks
Order blocks are areas where institutional traders placed large buy or sell orders, often leading to significant price moves. On a chart, they appear as the last bullish or bearish candle before a sharp reversal. Order blocks are highly prioritised within the PD array because they indicate zones of potential support or resistance.
Fair Value Gaps (FVGs)
FVGs are gaps between price levels that form when the market moves too quickly to fill orders evenly. These imbalances create "unfinished business" in the market, and price often revisits these areas to restore balance. They are especially useful for spotting potential reversals or continuation points.
Breaker Blocks
Breaker blocks form when order blocks fail. When supply or demand zones are unable to hold and the market structure shifts, breaker blocks emerge, highlighting key levels to monitor.
Mitigation Blocks
Mitigation blocks are related to breaker blocks but form after a market structure shift, where the price makes a lower high (in an uptrend) or a higher low (in a downtrend). They function the same as breaker blocks, but the key difference is in the failure of a new high/low before the trend reverses.
Liquidity Voids
Liquidity voids are areas on the chart where there’s little to no trading activity, often following sharp price movements. These large FVGs are often revisited by price as the market seeks to rebalance liquidity, making them significant for identifying future price movements.
Rejection Blocks
ICT rejection blocks are similar in concept to order blocks but consist of the wicks present on a given timeframe where an order block could be drawn. They are essentially a refined version of an order block where the price may reverse.
Old Lows or Highs
Old lows or highs represent liquidity pools where traders place stop orders. These levels are magnets for the price, as the market often seeks to trigger these stops before reversing. Identifying these points helps traders anticipate where the price might gravitate.
Using ICT PD Arrays for Trading
Let’s consider how to use the PD array of the ICT methodology.
Evaluating Trend Structure
Before anything else, traders typically assess the broader trend by analysing highs and lows. The goal is to identify the current structure and wait for the market to form a new significant high or low that aligns with the existing trend. For instance, in an uptrend, a trader might wait for a new higher high to form, followed by a retracement.
Once the new high or low is established, traders often draw a Fibonacci retracement tool between the previous low and the recent swing high (or vice versa for a downtrend). This creates a clear division of the price range into premium and discount zones, providing the foundation of the PD array.
Retracement into the PD Array
As the price retraces within the range, traders watch for it to reach the premium zone in a downtrend or the discount zone in an uptrend. This positioning is essential—it signals that the price has reached an area where the risk-reward profile may be more favourable.
Finding Specific Setups
Within these zones, traders use the tools of the PD array to refine their approach. For instance, an FVG might act as a key level, particularly if it sits just ahead of an order block. Alternatively, a breaker block might signal a potential reversal if the price aligns with the broader trend structure. By combining these elements, traders can narrow their focus to setups that align with both the PD array and the underlying market conditions.
The Limitations of ICT PD Arrays
While ICT PD arrays offer a structured framework for analysing price behaviour, they’re not without their challenges. Traders relying on this methodology should be aware of its limitations to avoid potential pitfalls. Here are some key considerations:
- Subjectivity in Marking Zones: Identifying premium and discount zones, as well as order blocks or other components, can vary between traders. This subjectivity means that no two analyses are identical, which may lead to inconsistent outcomes.
- Experience Required: Effectively using PD arrays demands a solid understanding of market structure, liquidity concepts, and the ICT methodology. It can feel overwhelming for beginners without adequate practice.
- Higher Timeframe Dependence: While PD arrays are valuable, they’re more popular on higher timeframes. Traders focusing solely on smaller timeframes might encounter more false signals.
- Dynamic Nature: Markets evolve quickly, and PD arrays require traders to adapt in real time. This dynamic quality can be a challenge for those who struggle with decision-making under pressure.
- Overfitting Risk: With so many tools available within the ICT framework, it’s easy to overanalyse or misinterpret signals, leading to analysis paralysis.
The Bottom Line
ICT PD arrays offer traders a structured framework to analyse market movements and identify key price zones, helping them refine their strategies. By combining these arrays with other tools and techniques, traders can gain deeper insights into institutional activity.
FAQ
What Is the ICT PD Array?
The ICT PD array meaning refers to a Premium and Discount array, a trading concept developed within the Inner Circle Trader (ICT) methodology. It organises price levels and zones into premium and discount areas, helping traders analyse where the price is likely to react and reverse and place entry and exit points. The framework includes tools like order blocks, fair value gaps, and liquidity voids to identify potential areas of institutional interest.
What Is a Premium Array in Forex?
A premium array in forex refers to the portion of a price range above its equilibrium level, typically the 50% mark of a significant swing high and low. Traders consider this zone less attractive for buying, as it’s closer to overvaluation, and often watch for potential selling opportunities.
What Is a Discount Array in Forex?
A discount array is the zone below the equilibrium level of a price range. It represents a potentially more favourable area for potential buying opportunities, as prices are considered undervalued relative to the swing high and low.
This article represents the opinion of the Companies operating under the FXOpen brand only. It is not to be construed as an offer, solicitation, or recommendation with respect to products and services provided by the Companies operating under the FXOpen brand, nor is it to be considered financial advice.

Apple - Wait for the bite!The price looks like a lion in a cage, breaking above or below the wedge will lead to significant changes. For now, sit back and relax, Trump will show the path!

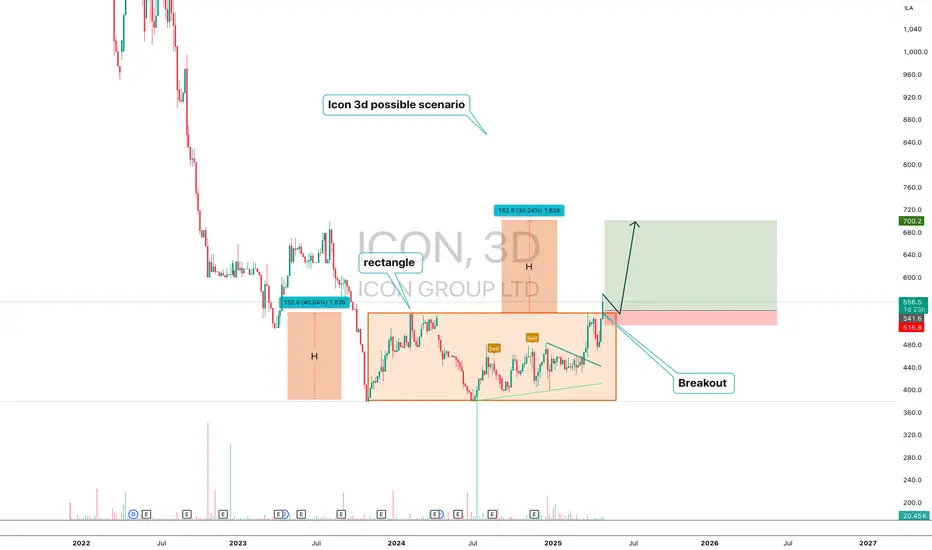
ICON — Breakout from Rectangle with H Projection Targeting $700ICON (3D) — Technical Structure Analysis
ICON has broken out from a prolonged horizontal rectangle pattern ($380–$540). The move activated a measured move structure with two H-sized waves. The first H was completed. The second H projects a move to the $700 area.
Key points:
-Confirmed breakout from range
-First H = 153 pts, completed
-Second H = 162 pts, targeting $700
-Price holding above breakout zone ($515–$541)
ICON has moved out of accumulation and entered trend expansion. As long as the support holds, the scenario remains valid. The technical model targets the $700 area.
What Is the McClellan Oscillator (NYMO), and How to Use ItWhat Is the McClellan Oscillator (NYMO), and How to Use It in Trading?
The McClellan Oscillator is a widely used market breadth indicator that helps traders analyse momentum and market strength. It focuses on the relationship between advancing and declining stocks, offering unique insights beyond price movements. This article explains how the McClellan Oscillator works, its interpretation, and how it compares to other tools.
What Is the McClellan Oscillator?
The McClellan Oscillator is a market breadth indicator that traders use to measure momentum in stock market indices. It’s calculated based on the Advance/Decline Line, which tracks the net number of advancing stocks (those rising in price) minus declining stocks (those falling in price) over a given period.
The NYSE McClellan Oscillator is the most common variant, often called the NYMO indicator. However, it can also be applied to any other stock index, like the Dow Jones, Nasdaq, or FTSE 100.
Here’s how it works: the indicator uses two exponential moving averages (EMAs) of the advance/decline data—a 19-day EMA for short-term trends and a 39-day EMA for long-term trends. The difference between these two EMAs gives you the oscillator’s value. Positive readings mean more stocks are advancing than declining, pointing to bullish momentum. Negative readings suggest the opposite, with bearish sentiment dominating.
What makes the McClellan indicator particularly useful is its ability to highlight shifts in market momentum that might not be obvious from price movements alone. For example, even if a stock index is rising, a declining indicator could signal that fewer stocks are participating in the rally—a potential warning of weakening breadth.
This indicator is versatile and works well across various timeframes, but it’s particularly popular for analysing daily or weekly market trends. While it’s not designed to provide direct buy or sell signals, it helps traders identify when markets are gaining or losing momentum,
Understanding the Advance/Decline Line
The Advance/Decline (A/D) Line is a market breadth indicator that tracks the difference between the number of advancing stocks and declining stocks. It’s calculated cumulatively, adding each day’s net result to the previous total. This gives a running tally that reflects the broader participation of stocks in a market’s movement, rather than just focusing on a handful of large-cap stocks.
When the A/D Line shows consistent strength or weakness, the McClellan Oscillator amplifies this data, making it potentially easier to spot underlying trends in market breadth. In essence, the A/D Line provides the raw data, while the McClellan refines it into actionable insights.
How to Calculate the McClellan Oscillator
The McClellan Oscillator formula effectively smooths out the daily fluctuations in the A/D data, allowing traders to focus on broader shifts in momentum.
Here’s how it’s calculated:
- Calculate the 19-day EMA of the A/D line (short-term trend).
- Calculate the 39-day EMA of the A/D line (long-term trend).
- Subtract the 39-day EMA from the 19-day EMA. The result is the McClellan Oscillator’s value.
Giving the formula:
- McClellan Oscillator = 19-day EMA of A/D - 39-day EMA of A/D
The result is a line that fluctuates around a midpoint. In practice, a trader might apply the McClellan Oscillator to the S&P 500 on a daily or weekly timeframe, providing insights for trading.
Interpretation of the Oscillator’s Values
- Positive values occur when the 19-day EMA is above the 39-day EMA, indicating that advancing stocks dominate and the market has bullish momentum.
- Negative values occur when the 19-day EMA is below the 39-day EMA, reflecting a bearish trend with declining stocks in control.
- A value near zero suggests balance, where advancing and declining stocks are roughly equal.
Signals Generated
The indicator is popular for identifying shifts in momentum and potential trend changes.
Overbought and Oversold Conditions
- Readings at or above +100 typically indicate an overbought market, where the upward momentum may be overextended.
- Readings at or below -100 suggest an oversold market, with the potential for a recovery.
Crossing Zero
When the indicator crosses above or below zero, it can indicate shifts in market sentiment, with traders often monitoring these transitions closely.
Divergences
- A positive divergence occurs when the indicator rises while the index declines, signalling potential bullish momentum building.
- A negative divergence happens when the indicator falls while the index rises, hinting at weakening momentum.
Using the McClellan Oscillator With Other Indicators
The McClellan Oscillator is a valuable tool for analysing market breadth, but its insights become even more powerful when combined with other indicators. Pairing it with complementary tools can help traders confirm signals, refine their analysis, and better understand overall market conditions.
Relative Strength Index (RSI)
The Relative Strength Index (RSI) measures the strength and speed of price movements, identifying overbought or oversold conditions. While the McClellan Oscillator focuses on market breadth, using RSI along with it can provide confirmation. For example, if both indicators show overbought conditions, it strengthens the case for a potential market pullback.
Moving Averages
Simple or exponential moving averages of price data can help confirm trends identified by the McClellan Oscillator. For instance, if it signals bullish momentum and the index moves above its moving average, this alignment may suggest stronger market conditions.
Volume Indicators (e.g., On-Balance Volume)
Volume is a key component of market analysis. Combining the Oscillator with volume-based indicators can clarify whether breadth signals are supported by strong participation, improving the reliability of momentum shifts.
Bollinger Bands
Bollinger Bands measure volatility and provide insight into price ranges. When combined with the McClellan Oscillator, they can help traders assess whether market breadth signals align with overextended price movements, providing additional context.
VIX (Volatility Index)
The VIX measures market sentiment and fear. Cross-referencing it with the McClellan Oscillator can reveal whether market breadth momentum aligns with changes in risk appetite, offering a deeper understanding of sentiment shifts.
Comparing the McClellan Oscillator With Related Indicators
The McClellan Oscillator, McClellan Summation Index, and Advance/Decline Ratio all provide insights into market breadth, but they differ in focus and application.
McClellan Oscillator vs McClellan Summation Index
While the Oscillator measures short-term momentum using the difference between 19-day and 39-day EMAs of the Advance/Decline (A/D) Line, the McClellan Summation Index takes a longer-term perspective. It is a cumulative total of the Oscillator's daily values, creating a broader view of market trends.
Think of the Summation Index as the "big picture" complement to the Oscillator's granular analysis. Traders often use the Summation Index to track longer-term trends and identify major turning points, while the Oscillator is more popular when monitoring immediate momentum shifts and overbought/oversold conditions.
McClellan Oscillator vs Advance/Decline Ratio
The Advance/Decline Ratio is a simpler calculation, dividing the number of advancing stocks by the number of declining stocks. While it provides a snapshot of market breadth, it lacks the depth of analysis offered by the McClellan Oscillator.
The Oscillator refines raw A/D data with exponential moving averages, smoothing out noise and making it potentially easier to identify meaningful trends and divergences. The A/D Ratio, on the other hand, is more reactive and generally better suited for short-term intraday signals.
Advantages and Limitations of the McClellan Oscillator
The McClellan Oscillator is a powerful tool for analysing market breadth, but like any indicator, it has strengths and weaknesses. Understanding both can help traders decide how best to integrate it into their analysis.
Advantages
- Focus on Market Breadth: By analysing the Advance/Decline data, the indicator provides a clearer picture of how many stocks are participating in a trend, not just the performance of index heavyweights.
- Momentum Insights: Its ability to highlight shifts in short-term momentum allows traders to spot potential turning points before they become evident in price action.
- Identification of Divergences: It excels at identifying divergences between market breadth and price, offering early signals of weakening trends or upcoming reversals.
- Overbought/Oversold Signals: Its range helps traders analyse extreme conditions (+100/-100), which can signal potential market corrections or recoveries.
Limitations
- Not a Standalone Tool: The indicator is combined with other indicators or broader analysis, as it doesn’t provide specific entry or exit signals.
- False Signals in Volatile Markets: During periods of high volatility or low trading volume, the oscillator may generate misleading signals, making context crucial.
- Short-Term Focus: While excellent for momentum analysis, it doesn’t provide the long-term perspective offered by tools like the McClellan Summation Index.
The Bottom Line
The McClellan Oscillator is a powerful tool for analysing market breadth, helping traders gain insights into momentum and potential market shifts. While not a standalone solution, it is often combined with other indicators for a well-rounded approach.
FAQ
What Is a NYMO Oscillator?
The NYMO oscillator, short for the New York McClellan Oscillator, is a market breadth indicator based on the Advance/Decline stock data of the New York Stock Exchange (NYSE). The NYMO index calculates the difference between a 19-day and 39-day exponential moving average (EMA) of the Advance/Decline line, providing insights into stock market momentum and sentiment.
What Does the McClellan Oscillator Show?
The McClellan Oscillator shows the balance of advancing and declining stocks in a market. Positive values indicate bullish momentum, while negative values reflect bearish sentiment. It’s often used to identify potential shifts in momentum or divergences between market breadth and price.
What Is the McClellan Oscillator in MACD?
The McClellan Oscillator and MACD are distinct indicators, but both use moving averages. While MACD measures price momentum, the Oscillator focuses on market breadth by analysing the Advance/Decline Line.
What Is the McClellan Summation Indicator?
The McClellan Summation Index is a cumulative version of the McClellan Oscillator. It provides a broader view of market trends, tracking long-term momentum and overall market strength.
What Is the Nasdaq McClellan Oscillator?
The Nasdaq McClellan Oscillator, sometimes called the NAMO, applies the same calculation as the NYMO but uses Advance/Decline data from the Nasdaq exchange. It helps traders analyse momentum and breadth in technology-heavy markets.
This article represents the opinion of the Companies operating under the FXOpen brand only. It is not to be construed as an offer, solicitation, or recommendation with respect to products and services provided by the Companies operating under the FXOpen brand, nor is it to be considered financial advice.

Nifty Probable Path for next 2 monthsNifty May spend some time till July August before beginning another 15% sell off.

S&P 500 Pullback Nearing End? Hammer + Elliott Wave Say Rebound!The S&P 500 Index ( FOREXCOM:SPX500 ) is one of the most important indexes in the financial market these days , with the cryptocurrency market and especially Bitcoin ( BINANCE:BTCUSDT ) having a strong correlation with this index .
After Donald Trump suspended tariffs on 90 countries (except China) , the S&P 500 Index started to rise and seems to have managed to break through the Resistance zone($5,284-$5,094) and is pulling back to this zone .
One of the signs of a reversa l of the S&P 500 Index can be the formation of the Hammer Candlestick Pattern , which announces the end of the pullback .
In terms of Elliott Wave theory , it seems that the S&P 500 Index is completing a corrective wave that could be in the form of a main wave 4 ( it is correcting both in time and price ).
I expect the S&P 500 Index to resume its upward trend in the coming hours, if nothing special is released , and to reach the Resistance zone($5,680-$5,500) and Yearly Pivot Point . If this happens, today's Bitcoin analysis could also be correct .
Note: In the worst case, if the S&P 500 Index touches $5,050, we should expect a further decline in the S&P 500 Index and Bitcoin.
Do you think the S&P 500 Index will return to an upward trend, or is this increase temporary?
Please respect each other's ideas and express them politely if you agree or disagree.
S&P 500 Index Analyze (SPX500USD),1-hour time frame.
Be sure to follow the updated ideas.
Do not forget to put a Stop loss for your positions (For every position you want to open).
Please follow your strategy and updates; this is just my Idea, and I will gladly see your ideas in this post.
Please do not forget the ✅' like '✅ button 🙏😊 & Share it with your friends; thanks, and Trade safe.

Coca-Cola Company (KO) Shares Trade Near All-Time HighCoca-Cola Company (KO) Shares Trade Near All-Time High
Stock market charts indicate that from the start of last week’s trading through to its close:
→ The S&P 500 Index (US SPX 500 mini on FXOpen) declined by approximately 3%;
→ Pepsico (PEP) shares dropped by more than 1%;
→ Coca-Cola Company (KO) shares rose by around 2.4%.
Why Aren’t Coca-Cola Shares Falling?
The relatively strong performance of Coca-Cola (KO) shares compared to the broader market and its main competitor may be attributed to the fact that Coca-Cola operates a concentrate production facility in Atlanta, USA. In contrast, Pepsico’s equivalent production is based in Ireland. This gives Coca-Cola a potential advantage under the tariff policies pursued by the Trump administration.
Incidentally, according to media reports, Diet Coke is the favourite drink of the US President.
Technical Analysis of KO Stock Chart
In 2025, KO stock has been forming an upward channel, though the current price is approaching key resistance levels:
→ the upper boundary of this ascending channel;
→ the $73 level, above which several successive all-time highs have been formed. However, price action suggests that bulls have so far struggled to establish a foothold above this mark.
It is possible that the upcoming quarterly earnings report, scheduled for 29 April, could provide a positive catalyst for KO’s share price.
This article represents the opinion of the Companies operating under the FXOpen brand only. It is not to be construed as an offer, solicitation, or recommendation with respect to products and services provided by the Companies operating under the FXOpen brand, nor is it to be considered financial advice.

T Trading Guide 4/21/25AT&T (T) Trading Analysis for Monday, April 21, 2025
Sentiment Analysis
-Overview: Sentiment on X and StockTwits is neutral, with investors appreciating T’s 4.11% dividend yield but expressing concerns over tariff-driven cost increases. Analyst consensus remains stable, with a “Hold” rating and a $21.50 target (April 20 ), though some Reddit (r/options) users highlight margin pressures from tariffs.
-Implication: Mixed sentiment suggests range-bound trading absent a catalyst, with tariff concerns capping upside potential.
Strategic Outlook
-Assessment: The outlook for Monday is neutral, supported by balanced options activity, oversold technicals with potential for a bounce, and a VIX at ~40 indicating volatility.
-Implication: Anticipate a price range of $26.50 to $27.50, with support at $26.50 likely to hold and resistance at $27.50 posing a challenge for bulls.
Market Influences
-Overview: No new Federal Reserve decisions today; recent guidance on April 17 signals caution on rates, potentially impacting telecom spending. T’s earnings are due April 23, with a consensus EPS of $0.52 (April 20 ). Social media chatter on X and WallStreetBets focuses on dividend stability, though some Reddit users note tariff risks (10% baseline). No M&A news has surfaced.
-Implication: Earnings anticipation and tariff pressures suggest cautious trading, likely keeping T within a tight range on Monday.
Price Context
-Overview: Current price at $27.15. The stock has declined 4% over the past month from $28.30 on March 31 and is up 13% year-over-year from $24.02 in April 2024. Support lies at $26.50, with resistance at $27.50.
-Implication: Recent declines indicate limited upside; a break below $26.50 could signal further downside to $26.00.
Technicals:
Monthly: RSI at 45 (neutral), Stochastic at ~40 (neutral), MFI at ~42 (neutral). Price below 10/20-month SMAs ($28.00/~$29.00, bearish).
Implication: Long-term bearish trend with neutral momentum.
Weekly: RSI at 42 (neutral), Stochastic at ~35 (neutral), MFI at ~38 (neutral). Price below 10/20-day SMAs ($27.50/~$28.00, bearish).
Implication: Bearish trend with neutral momentum, suggesting consolidation for weekly contracts.
Daily: RSI at 40 (neutral), Stochastic at ~30 (neutral), MFI at ~35 (neutral). Price below 10/20-day SMAs ($27.20/~$27.50, bearish).
Implication: Daily trend bearish, but oversold conditions may support a bounce.
4-Hour: RSI at 43 (neutral), Stochastic at ~38 (neutral), MFI at ~40 (neutral). Price below 10/20-period SMAs ($27.10/~$27.20, bearish).
Implication: Medium-term bias bearish, aligning with weekly caution.
Hourly: RSI at 46 (neutral), Stochastic at ~42 (neutral), MFI at ~44 (neutral). Price below 10/20-hour SMAs ($27.05/~$27.10, bearish).
Implication: Intraday bias bearish, suggesting potential selling pressure.
10-Minute: RSI at 48 (neutral), Stochastic at ~45 (neutral), MFI at ~46 (neutral). Price below 10/20-period SMAs ($27.00/~$27.05, bearish).
Implication: Short-term bias bearish, supporting a cautious weekly stance.
Options Positioning
Overview: Weekly options show balanced volume ($27.00 calls: 800 contracts, 50% at ask; $26.50 puts: 900 contracts, 55% at bid), with a put-call ratio of 1.1 (neutral) and IV skew flat ($27.00 calls/puts: 35%). Monthly options have a put-call ratio of 1.0, IV flat ($27.00: 32%). 3-Month options show a put-call ratio of 1.2, IV flat ($26.50: 30%). VIX at ~40 (down 5%, above 30-day average of ~35).
Option Flow Dynamics (OFD) Analysis:
Vanna:
-Impact: Minimal, ±$0.02 intraday.
-Insight: Balanced call/put volume and flat IV skew at 35% result in negligible delta adjustments by dealers, even with a VIX of 40.
-Stance: Neutral for weekly contracts; bullish if IV exceeds 38%.
Charm:
-Impact: Pins price ±$0.02, minimal volatility.
-Insight: High open interest at $27.00 (calls: 2,000 contracts, puts: 2,200 contracts) leads dealers to maintain delta neutrality, pinning the price near expiry.
-Stance: Neutral for weekly contracts; bearish if price breaks above $27.50.
GEX (Gamma Exposure):
-Impact: Pins price ±$0.05, minimal volatility.
-Insight: Balanced gamma from equal call/put open interest at $27.00 keeps price stable, though a VIX of 40 could amplify breakout volatility.
-Stance: Neutral at $27.15 for weekly contracts; bearish above $27.50.
DEX (Delta Exposure):
-Impact: No directional bias.
-Insight: A put-call ratio of 1.1 indicates balanced delta exposure, with dealers’ hedging activities netting zero directional impact.
-Stance: Neutral for weekly contracts, even on high volume.
OFD Summary: Weekly flows indicate a neutral bias, with price likely to remain within $26.50-$27.50, driven by balanced Vanna, Charm, GEX, and DEX dynamics. A VIX of 40 suggests potential volatility; earnings on April 23 could push IV above 38%, adding $0.05-$0.10 upside (Vanna). Monthly and 3-month expiries (put-call ratios 1.0 and 1.2) confirm range-bound confluence.
-Implication: Neutral bias for weekly contracts; high VIX suggests volatility within the $26.50-$27.50 range for Monday.
ICT/SMT Analysis
-Overview: Weekly: Neutral, support at $26.50, resistance at $27.50, SMT divergence versus VZ shows relative strength. Daily: Neutral, FVG $27.50-$28.00, OB $26.00. 4-Hour: Neutral, MSS below $27.15, liquidity below $26.50. 1-Hour: Neutral, MSS below $27.15, liquidity below $26.50. 10-Minute: OTE sell zone $27.20-$27.30 (Fib 70.5%), target $26.50.
-Implication: Neutral across timeframes; a breakdown below $26.50 could target $26.00, but weekly contracts are likely to see consolidation.
Edge Insights
-Institutional Flows: Recent block trades (April 18 ) show balanced buying and selling at $27.00, suggesting institutions are hedging rather than taking a directional stance.
-Sector Stability: Telecom sector is down only 5% YTD (Morningstar ), providing relative stability compared to other sectors, though tariff costs remain a headwind for T.
-Earnings Catalyst: With earnings due April 23, pre-earnings positioning may increase volatility, potentially favoring a breakout above $27.50 if sentiment shifts positively.
-Implication: Sector stability supports a neutral weekly stance, but monitor for pre-earnings IV spikes that could shift dynamics.
Trade Recommendation Analysis:
-Neutral: 50% likelihood (balanced options flows, GEX pinning at $27.15, high VIX choppiness).
-Bearish: 30% likelihood (MSS below $27.15, tariff pressures).
-Bullish: 20% likelihood (oversold indicators, potential bounce above $27.50).
-Action: Recommend a neutral stance with a bearish tilt; if bearish, buy $27.00 puts (weekly expiry) at ~$0.20, targeting $0.40, with a stop at $0.10 if T breaks $27.50. Risk $40 (2% of a $2,000 account).
Conclusion for Monday: T is poised for range-bound trading within $26.50-$27.50, driven by neutral options flows and tariff concerns. Focus on a potential breakdown below $26.50 for weekly bearish trades, targeting $26.00. High VIX and impending earnings add risk—execute with tight stops to manage volatility.

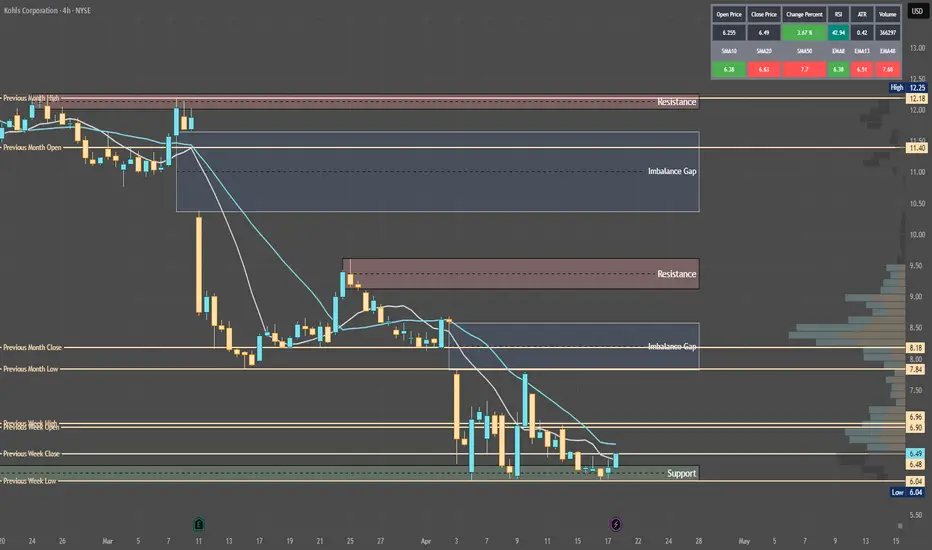
KSS Trading Guide 4/21/25Kohl's Corporation (KSS) Trading Analysis for Monday, April 21, 2025
Sentiment Analysis
----Overview: Sentiment on platforms like X and StockTwits leans bearish, driven by tariff concerns and Kohl’s weakening fundamentals, with projected sales declines of 5-7% in 2025. JP Morgan’s Underweight rating and $7 price target as of April 14 underscore margin pressures, though a ~12% dividend yield provides some appeal for income-focused investors.
----Implication: The prevailing negative sentiment, coupled with macroeconomic headwinds, is likely to exert downward pressure on KSS, overshadowing the dividend’s stabilizing effect.
Strategic Outlook
----Assessment: The outlook for Monday is bearish, fueled by significant put activity in weekly options, persistently oversold technical indicators without reversal signals, and a VIX at ~40, reflecting heightened market volatility.
----Implication: Anticipate a price range of $6.20 to $6.50, with a risk of breaching support at $6.20, potentially driving the stock toward $5.80 if bearish momentum persists.
Market Influences
----Overview: No new Federal Reserve decisions today; however, recent guidance on April 17 signals a cautious approach to rates, which could dampen retail spending. Kohl’s next earnings are scheduled for May 21, per TradingView data. Fitch Ratings downgraded KSS from BB to BB- on April 7, citing financial strain. Social media discussions on X, WallStreetBets, and StockTwits remain bearish, focusing on the impact of 10% baseline tariffs on margins. Additionally, the departure of Chief Technology Officer Siobhán Mc Feeney on April 1 introduces further uncertainty.
----Implication: The absence of positive catalysts, combined with tariff pressures and leadership changes, solidifies a bearish outlook for Monday.
Price Context
----Overview: Current price at $6.48. The stock has declined 21% over the past month from $8.20 on March 31 and is down 73% year-over-year from $23.94 in April 2024. Support lies at $6.20 (recent low on April 17), with resistance at $6.89 (April 14 open).
----Implication: Recent declines, driven by tariffs and executive turnover, suggest continued downward pressure, with a break below $6.20 likely to accelerate losses.
Technical Indicators
Monthly: RSI at 22 (oversold), Stochastic at ~12 (oversold), MFI at ~18 (oversold). Price below 10/20-month SMAs ($8.50/~$9.50, bearish).
Implication: Long-term bearish trend with extreme oversold conditions, yet no reversal signal is evident.
Weekly: RSI at 27 (oversold), Stochastic at ~17 (oversold), MFI at ~20 (oversold). Price below 10/20-day SMAs ($6.70/~$6.90, bearish).
Implication: Bearish trend confirms downside bias for weekly contracts.
Daily: RSI at 30 (nearing oversold), Stochastic at ~15 (oversold), MFI at ~22 (oversold). Price below 10/20-day SMAs ($6.40/~$6.50, bearish).
Implication: Daily trend supports weekly bearish bias.
4-Hour: RSI at 35 (nearing oversold), Stochastic at ~18 (oversold), MFI at ~28 (nearing oversold). Price below 10/20-period SMAs ($6.30/~$6.40, bearish).
Implication: Medium-term bias aligns with weekly outlook.
Hourly: RSI at 32 (nearing oversold), Stochastic at ~15 (oversold), MFI at ~25 (oversold). Price below 10/20-hour SMAs ($6.35/~$6.40, bearish).
Implication: Intraday bias supports weekly trade direction.
10-Minute: RSI at 38 (neutral), Stochastic at ~20 (oversold), MFI at ~30 (nearing oversold). Price below 10/20-period SMAs ($6.45/~$6.47, bearish).
Implication: Short-term bias reinforces weekly contract setup.
Options Positioning
Overview: Weekly options show high put volume at $6.50 (1,500 contracts, 70% at bid), with a put-call ratio of 2.5 (bearish) and IV skew favoring puts ($6.50: 50%, rising). Monthly options have a put-call ratio of 2.0, with put IV rising ($6.00: 48%). 3-Month options show a put-call ratio of 2.3, with put IV rising ($5.50: 45%). VIX at ~40 (down 5%, above 30-day average of ~35).
Option Flow Dynamics (OFD) Analysis:
Vanna:
Impact: -$0.10 intraday.
Insight: Rising put IV at 50% compels dealers to sell shares to hedge delta as IV increases, exerting downward pressure. A VIX of 40 heightens this effect.
Stance: Bearish for weekly contracts; neutral if IV falls below 48%.
Charm:
Impact: Pins price ±$0.05, adds $0.03 volatility.
Insight: High put open interest at $6.50 prompts dealers to sell shares to maintain delta neutrality near expiry, pinning the price with minor volatility.
Stance: Bearish for weekly contracts; neutral if price holds $6.50.
GEX (Gamma Exposure):
Impact: Pins price ±$0.10, adds $0.05 volatility.
Insight: Negative gamma from elevated put open interest drives dealers to sell shares on price declines, pinning at $6.50 while adding volatility on breakouts.
Stance: Bearish below $6.50 for weekly contracts; neutral at $6.50.
DEX (Delta Exposure):
Impact: $0.20-$0.30/day downward pressure.
Insight: High put open interest creates a delta imbalance, compelling dealers to sell shares on price drops, adding consistent downward pressure.
Stance: Bearish for weekly contracts, particularly on high volume.
OFD Summary: Weekly flows signal a bearish bias, with $0.30-$0.50 downward pressure driven by Vanna and DEX selling. Pivot at $6.50; weekly range $6.20-$6.50 (pinning). A VIX of 40 amplifies downside risk, and a break below $6.20 could trigger $0.15 volatility (GEX). Monthly and 3-month expiries, with put-call ratios of 2.0 and 2.3, provide bearish confluence.
Implication: Bearish bias for weekly contracts; elevated VIX suggests downside volatility, with a $6.20-$6.50 range for Monday.
ICT/SMT Analysis
Overview: Weekly: Bearish, support at $6.20, resistance at $6.89, SMT divergence versus WMT confirms weakness. Daily: Bearish, FVG $6.50-$6.89, OB $5.80. 4-Hour: Bearish, MSS below $6.48, liquidity below $6.20. 1-Hour: Bearish, MSS below $6.48, liquidity below $6.20. 10-Minute: OTE sell zone $6.50-$6.60 (Fib 70.5%), target $6.20.
Implication: Bearish across all timeframes; a breakdown below $6.20 is likely, aligning with the weekly contract setup.
Edge Insights
Dark Pool Activity: Large sell orders at $6.50 in recent dark pool prints (April 18) indicate institutional bearishness, potentially increasing selling pressure if retail traders follow suit on Monday.
Sector Dynamics: The consumer discretionary sector is down 17.8% year-to-date (Morningstar); Kohl’s heavy reliance on imported goods amid tariffs makes it more vulnerable than peers like Walmart, which benefits from stronger domestic sourcing.
Short Interest Pressure: Short interest at ~45% of float (MarketBeat) raises the risk of a short squeeze if the price breaks above $6.89, though current momentum favors shorts targeting $6.20.
Implication: Institutional selling and sector weakness reinforce the bearish bias for weekly puts; remain vigilant for a potential squeeze if the price approaches $6.89.
Trade Recommendation
Analysis:
Bearish: 55% likelihood (negative MSS, OFD flows, tariff pressures).
Neutral: 30% likelihood (GEX pinning at $6.50, high VIX choppiness).
Bullish: 15% likelihood (oversold indicators, potential bounce above $6.89).
Action: Recommend a bearish weekly trade below $6.20, targeting $5.80. Purchase $6.50 puts (weekly expiry) at ~$0.25, aiming for $0.50, with a stop at $0.15 if KSS breaks $6.60. Risk $50 (2.5% of a $2,000 account).
Conclusion for Monday: Kohl’s faces a bearish trajectory driven by tariff pressures, negative options flows, and leadership uncertainty. The recommended strategy focuses on a breakdown below $6.20 for weekly bearish trades, targeting $5.80. Elevated VIX and institutional selling add risk—execute with tight stops to manage volatility.
INTEL BUY 2030Claro, aquí tienes el texto completamente limpio, sin negritas ni símbolos especiales:
---
Preliminary Projection: Intel's Potential Workforce Transformation (2025–2030)
As Intel continues its restructuring and integrates more AI-driven systems into its operations, significant changes are expected in its workforce distribution. The following outlines an estimate of the potential job displacement or transformation due to artificial intelligence by 2030.
Area: Manufacturing
- Percentage of total employees: 35% (approximately 40,000)
- Percentage potentially replaceable by AI: 70%
- Estimated replaceable jobs: 28,000
Area: Administration
- Percentage of total employees: 20% (approximately 23,000)
- Percentage potentially replaceable by AI: 55%
- Estimated replaceable jobs: 12,500
Area: Engineering
- Percentage of total employees: 30% (approximately 34,000)
- Percentage potentially replaceable by AI: 20%
- Estimated replaceable jobs: 6,800
Area: Sales and Marketing
- Percentage of total employees: 15% (approximately 17,000)
- Percentage potentially replaceable by AI: 40%
- Estimated replaceable jobs: 6,800
Total estimated jobs that could be automated or transformed by AI: approximately 54,000, representing around 47 percent of Intel’s current workforce.
---
Key Intel Facilities Focused on AI-Driven Automation
Ohio, USA – Ohio One Campus
Investment: Over 28 billion dollars
Purpose: To become the world’s largest chip manufacturing hub for AI by 2027
Key technologies: Advanced automation, digital twins, and AI systems to optimize production and operational efficiency
Source: Reuters
Hillsboro, Oregon, USA – D1X Factory
Function: Research and development center for next-generation manufacturing technologies
Key technologies: AI-powered predictive maintenance, computer vision, and real-time analytics to improve efficiency and quality
Source: Intel Newsroom
These facilities reflect Intel’s strategic transition toward leading in both semiconductor innovation and intelligent manufacturing. The company’s integration of artificial intelligence across its industrial operations is expected to drive productivity, reduce costs, and reshape its employment structure.
---
¿Quieres que lo convierta ahora en PDF, en PowerPoint o en algún diseño tipo folleto?
