📉✌XAUUSD 2H Long Position✌📈BINANCE:BTCUSDT
COINBASE:BTCUSD
💥Pitchfork Setup💥
If the price stays between the yellow boxes, a long position has a good chance of winning. (Enter in several steps)
Don't forget to risk-free your positions.
Optimal stop-loss is on the chart.
Please share ideas and leave a comment,
Let me know what's your idea.
CrazyS✌
Stophunt

Weekly Level Stop Hunt Fatal 4 WayThe SPX and DXY both seem to be hunting the stops at the high/low of last week and the week before. The targets for all 4 assets would appear to be at the opposite end of the weekly ranges if we can reverse here.

LTCUSD: The Gartley Appears Once MoreWe have a Bullish Gartley on LTC that has appeared on the Minute Charts and if it goes like last time then this will be the end of the Bullish Consolidation and we will shoot significantly higher very very soon.

EURUSD SHORT ( SELLERS TAKING ACTION )EURUSD is at peak level towards a strong bearish movement as DOLLAR INDEX is moving on the upside

USDCHF 30 MIN PROJECTIONUSDCHF Has Taken out the Buy Side Liquidity And Make Choch Make This. So there is A High Probability of USDCHF to go to The Down side.

Thoughts I think price will go to 0.96080
With that in mind we see price just came off that weekly fair value gap and broke structure to the downside
Guessing a fair value gap will form on the daily to facilitate shorts
On the 4H I'm expecting a pullback into premium before I consider shorts
But for day trades you can try to buy this as the pullback may seem as a trend on lower timeframes
Not going to talk about targets
hope this was helpful

BTC Trendline Break-Hook-&-Go On The 1 HourWe have a Breakout of a Trendline on the Hourly and i am looking for price to Square-Up from here.

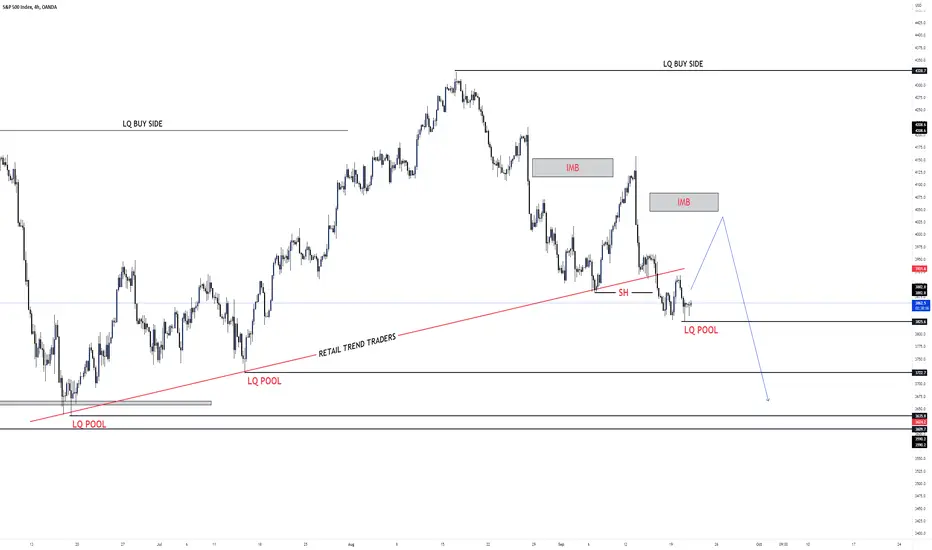
S&PUS500 SHORT TERM BUY TO SELL BIAS DRILLExpacting price to fill the IMB short term BUY and move for the low Resistance LQ pools on the down side or Expect BIG sell without refilling the IMB
AUDUSD, ICT Stop Hunt, Equal Highs/LowsJournal Entry 1, a won trade R:R at around 2. First I started with weekly bias, haven't studied that yet so I used 9/18 EMA MA cloud and then a weekly/daily cross & bias confirmation. The weekly bias is short. I notice equal highs at M15 timeframe and a run up and start looking for the stop hunt at M3 . As soon as there is a break in market structure down the algo changes program to sell. This particular change in program only appears at liquidity pool in this case buyside liquidity (Buy Breakout traders trapped and Short traders with buy stops above resistance trapped too and used as liquidity). Another sign of algo buying here is the FVG (smart money buying), which shows its hand clearly and at that moment it's the stop hunt. FVG coupled with BMS at liquidity pool is a sure sign of stop hunt. Target determined by liquidity matrix (Fibonacci with only 50% level drew from highest high to the lowest low of the session). At that point price is at discount and the target is going to be at premium side of the matrix. Price bounced of several liquidity pools and liquidity pools + FVG and settled at FVG. I grabbed the first liquidity pool + FVG target at premium side. A fine trade if you ask me.

3800% growth for the #FET...Hello guys...
as you can see on chart, #fetusdt formed a sloping double top and target of this pattern is as high as height of head that mean price should touch $0.0315
on the other hand, on $0.03 area is on QML and lq bar that make this area super strength for starting bullish trend until $1.15.
it is excellent position
entry:0.0315
target: 1.15
always do your own research.
If you have any questions, you can write it in comments below, and I will answer them.
And please don't forget to support this idea with your like and comment.

📉🐻Bears are waiting for an entry🐻📈BINANCE:BTCUSDT
COINBASE:BTCUSD
Hi traders, first look at my previous analysis and positions on ETHUSDT & BTCUSDT and AUDUSD & USDCAD.
This current price growth in Bitcoin could be the pullback to the pattern-breaking range.
A sell position in the red area can have a high chance of winning.
Just don't forget to risk-free your positions when they reached the risk-free level.
TP1 in green ==> for long position.(My previous analysis)
TP1-2-3 in red ==> for short position.
The optimum stop-loss for each position is on the chart.
Please share ideas and leave a comment,
let me know what you think.
CrazyS✌

EURAUD 30 MIN PROJECTIONEURAUD Firstly Created Equal Highs Then it Grabbed the Liquidity And Above Those Equal Highs there is an ORDER Block Which is Seeing A Strong Supply Zone From Where we would see A DownFall.

XLMUSDT Short-term upward movementHello guys
This currency has stop-hunt that level and confirmed a possibility of a short upward movement to the bearish trend line, but as you can see in the weekly timeframe image, it needs to downward to the price range of 5.7-8.5 cents, and that area has potential to start the growth of this currency.
In the future, this analysis will be updated.
follow me please and like this post.
thanks for your attention!

ADAUSDT - Stop Hunt with Wyckoff Method📉📈Hi Traders, Investors and Speculators
Ev here. Been trading crypto since 2017 and later got into stocks. I have 3 board exams on financial markets and studied economics from a top tier university for a year.
A quick look at Cardano / ADAUSD / ADAUSDT . I believe that we are currently in the market cycle of accumulation , according to the Wyckoff Method market phases. The four phases of the market cycle are accumulation, markup, distribution, and markdown.
During the accumulation phase, a new cycle begins that generates a trading range. The pattern often creates a strong resistance zone / failure point / spring . This is the precursor to another bull cycle, but it can last an extended period of time. The final moments of this phase will attract algorithm trading driven stop hunting , often observed near downtrend lows, where price drops just underneath key support and then triggers a sell-off. This is followed by a recovery wave that lifts the price back above support.
So - What Is Stop Hunt ?
Stop hunting is a strategy that attempts to force traders out of their positions by driving the price of an asset to a level where many people have chosen to set stop-loss orders. The triggering of many stop losses at once typically creates high volatility and this is often very obvious during the accumulation phase of the Wyckoff Method.
If we take all of the above into consideration, the price of Cardano can still drop and fall within a range multiple times until a clear bottom is established and the next markup phase / bull cycle starts. In the video above, I take a look at possible bounce zones and a target for the SOS ( sign of strength, a price advance on increasing spread and relatively higher volume ). I have also highlighted the next phase of the accumulation cycle, the BU (back-up). At this point, short-term profit-taking occurs and a test for additional supply around the area of resistance. A back-up is a common structural element preceding a more substantial price mark-up (SOS) .
Here, I did an analysis on Bitcoin / BTCUSD / BTCUSDT using the Wyckoff Method:
Related news Highlights in Crypto :
📢Elon Musk claims crypto is not contributing to an environmentally sustainable future, also says that Tesla has not sold any of its Dogecoin holdings and he will be open to increase Bitcoin holdings again after recently selling 75% of Tesla's btc holdings
📢 Jed Mccaleb closes his infamous “tacostand” XRPUSDT account
📢UK Finance Minister announces that a bill for stablecoins will be introduced this week
📢Crypto exchange Bitstamp will charge inactive users a monthly fee of $10.20
📢XRP flips BUSD and becomes worlds 6th largest crypto by market cap
📢US Senator Cynthia Lummis says crypto regulation bill will only be considered in 2023
_________________
👀Follow us here on TradingView for daily updates and trade ideas on crypto , stocks and commodities 📉
Hit like & Follow 🔔
We thank you for your support !
CryptoCheck

USDCAD: Weak Demand 🚨When price gets delivered to a demand zone in a compression format, It usually means a liquidity grab is coming.
Price could either fall through the demand zone aggressively OR gives buyers an initial lure before dying off as illustrated.
Either way, this is a great pair to watch today!
Let me know what you think in the comment section 💬

Gbaud two scenarios.... Choose one.If the bullish BREAKOUT occurs for an average 1:3.29 R I will long....if the bearish BREAKOUT occurs I will post my setup for that.
Like and Subscribe.

XAUUSD: Buyers Are In Trouble ☠️The breakout of the trendline was very clearly a trap.
Buyers are now panicking holding on to their last hope that price will reverse back to the upside.
This is highly unlikely to happen.
We are likely to see a strong sweep of the equal lows to liquidate remaining buyers before we see any signs of a reversal.
I want to buy in for a long-term swing with the members around 1600.
Let me know what you think in the comment section.

btcusdt is bearish so far!hello guys
I think btcusdt is bearish until breakout that gray level then it will be bullish but for now is so bearish and you can get short position and hold until tp 2 that i mention it! price confirmed #stophunt level.
thank you for you attention please like and follow.
good luck!

S&P500 AND NAS100 SHORT TERM SELL (SMS)The weekly bias was on a bullish condition as of last week but still expect short term trends on s&p500/us100 so as price rebounds back to bullish bias after stop hunts have beein driven out, On LTF i would expect short sells by Monday order flow and a great rebound to the upside for the all week unless news events take effect on the market
Note: Last Friday News release had a bigger impact on the market as we wait for the price to neutralize and gain momentum to the upside or below after short sells on stop hunt and reverses to the upside

xauusd! wait for confirmation!hello guys!
gold is neutral now and did not ready for upward or downward movement please wait for confirmation and be with me and follow me! I will update this analyze When a buy or sell signal is issued.
thank you for your attention!
do not forgot like this analyze!
good luck

S&PUS500 BULLISH SENARIOS&PUS500 mother of all stock indices
Despite the monthly bearish down drop analysis us500 shows a critical bullish move on its intraday market motive as a short-term bullish move after liquidity pool taken out on weekly time frame and rebound of price on a daily’s trend after sells liquidity stops
Note: when price closes below YL we have to expect a down move of price to sell side liquidity area.

GBPCHF: Support Approaching ⚠️We swept the lowest point EVER on this pair and now price is returning to the support created shortly after this sweep.
Will price hold the support or break slightly beneath it to stop hunt before buying again?
I think the new low will hold and not be broken but time will tell!
I have illustrated what I would like to see on this pair over the coming weeks.
Let me know what you think in the comments 💬

BTCUSDT: One Last Sell Before Buys ⏏️I have been calling all BTC moves as you can see from my related ideas below.
We are waiting for a buy BUT first, we must complete the final liquidity grab on SMC buyers from the order block.
I will be selling into my buy zone with members.
Let's hear the hate in the comments 💬
