MATIC/USDT - Targets and StoplossHello everyone, let's take a look at the 1D MATIC to USDT chart as you can see the price is moving above the local uptrend line.
Let's start by setting goals for the near future that we can consider:
T1 - $ 1.0378
T2 - $ 1,2003
T3 - $ 1.4368
and
T4 - $ 1.7495
Now let's move on to the stop loss in case of further market declines:
SL1 - $ 0.8365
SL2 - $ 0.7357
SL3 - $ 0.6584
and
SL4 - $ 0.5766
Looking at the CHOP indicator, we can see that in the 1D range most of the energy has been used, and the MACD indicator indicates a local upward trend.
Stoploss

be BULLISH on JUBILANT INGREVIA hey guys ,
JUBLIENT INGREVIA stock is showing bullish signs ,
This stock was moving in a downtrend for a very long time ,
but now, through the analysis, i think that this stock is starting to move in a UPTREND
the stock was moving in a downtrend , BUT IN A FIXED AREA ,
and now this stock has crossed it's resistance,
and has shown a great bullish candle .
there are 2 reasons to buy this stock ;
1. A GREAT BULLISH CANDLE HAS BEEN SEEN ABOVE THE RESISTANCE
2. 20 DAY EMA has CROSSED ❌ the 50 DAY EMA
therefore, you can bet on this stock and can try to earn high returns.
i have marked the RR RATIO , TARGET AND SL for y'all .
BUT PLS CONSIDER THE GLOBAL SITUATION FIRST,
1. INFLATION
2. WAR
3. RISING BANK RATES
AFTER CONSIDERING THESE SITUATIONS YOU CAN BUY THIS STOCK
JUBULANT INGREVIA
😀😀

BNB is climbing the local uptrend lineHello everyone, let's take a look at the 1D BNB to USDT chart as you can see the price is moving above the local uptrend line.
Let's start by setting goals for the near future that we can consider:
T1 - $ 260
T2 - $ 278
T3 - $ 304
and
T4 - $ 337
Now let's move on to the stop loss in case of further market declines:
SL1 - $ 238
SL2 - $ 228
SL3 - $ 219
SL4 - $ 210
and
SL5 - $ 198
Looking at the CHOP indicator, we can see that some energy was consumed in the 1D range and the MACD indicator shows the local uptrend.

ETH / USDT 1DChart - Targets And StopLossHello everyone, let's take a look at the 1D ETH to USDT chart as you can see the price is moving above the local downtrend line.
Let's start by setting goals for the near future that we can consider:
T1 - $ 1,405
T2 - $ 1,527
T3 - $ 1704
and
T4 - $ 1,928
Now let's move on to the stop loss in case of further market declines:
SL1 - $ 1297
SL2 - $ 1,220
SL3 - $ 1154
SL4 - $ 1090
and
SL5 - $ 999
Looking at the CHOP indicator, we can see that in the 1D interval some energy was used, and the MACD indicator shows a local upward trend.

HDFC BANK has retested, and showing BULLISH signs hey guys ,
just found a good stock to talk about ,
HDFC BANK was moving in a great downtrend .
This stock was following a pattern called
DESCENDING TRIANGLE 📐 PATTERN
previously also ,
this stock has tried to cross his resistance
and to break hi pattern,
but it FAILED
and it resulted to BULL TRAP for TRADERS
but now this stock has again broke his resistance and pattern ,
and now I think that
this stock will be successful in BREAKING HIS PATTERN ,
because there is no place left for this stock to continue his pattern ,
therefore , from my opinion you can bet on this stock and earn high returns ,
i have marked the RR RATIO , TARGET AND SL
y'all can trade according to this RR RATIO ( IF U WANT TO )
otherwise, you can adjust it accordingly. BUT PLS CONSIDER THE GLOBAL MARKET SITUATIONS
1. INFLATION
2. WAR
3. RISING BANK RATES ( IMPORTANT FOR THIS STOCK )
😀😀
HDFC BANK

📌 Types of Orders in trade :
An order is an offer sent using your Exchange or broker’s trading platform to open or close a transaction if the instructions specified by you are satisfied.
Basically, the term “order” refers to how you will enter or exit a trade.
Orders Types:
There are some basic order types that all Exchanges or brokers provide and some others that sound weird.
Orders fall into two buckets:
Market order: an order instantly executed against a price that your Exchange or broker has provided.
Pending order: an order to be executed at a later time at the price you specify.
Limit Order:
A limit order is an order placed to either buy below the market or sell above the market at a certain price.
This is an order to buy or sell once the market reaches the “limit price”.
You place a “Buy Limit” order to buy at or below a specified price.
You place a “Sell Limit” order to sell at a specified price or better.
Once the market reaches the “limit price” the order is triggered and executed at the “limit price” (or better).
It is clear where the order should be filled ,But it does not necessarily mean that it will be filled and it depends on the sufficient volume in the specified price or price range( trigger - order )
Market Order:
A market order is an order to buy or sell at the best available price.
It is not clear where the order will be filled ,It depends on where the price order meets a right volume in apposite order on the other side !
Stop Loss Order:
An order to close out if the market price reaches a specified price, which may represent a loss or profit.
A stop loss order is a type of order linked to a trade for the purpose of preventing additional losses if the price goes against you.
If you are in a long position, it is a sell STOP order.
If you are in a short position, it is a buy STOP order.
REMEMBER THIS TYPE OF ORDER.
A stop loss order remains in effect until the position is liquidated or you cancel the stop loss order.
Trailing Stop:
A stop loss order which is always attached to an open position and which automatically moves once profit becomes equal to or higher than a level you specify.
A trailing stop is a type of stop loss order attached to a trade that moves as the price fluctuates.
Trailing stops helps to lock in profits or limit losses as a trade moves favorably. They also allow traders to place a pre-set order at a specific percentage away from the market price when the market swings.
Limit Orders versus Stop Orders:
New traders often confuse limit orders with stop orders because both specify a price.
Both types of orders allow traders to tell their exchanges or brokers at what price they’re willing to trade in the future.
The difference lies in the purpose of the specified price.
A stop order activates an order when the market price reaches or passes a specified stop price.
One-Cancels-the-Other (OCO):
An OCO order is a combination of two entry and/or stop loss orders.
Two orders are placed above and below the current price. When one of the orders is executed the other order is canceled.
An OCO order allows you to place two orders at the same time. But only one of the two will be executed.
It is usually used when there is uncertainty for next movement of market and the price is between the two key levels of higher resistance and lower support, and you are waiting for the price reaction so on.
for example, you want to buy bitcoin that already trading about $20500 and place a OCO order that if the price reaches the lower support of $20k , you place a buy-limit and your stop-buy limit will be canceled immediately , or otherwise if it crosses the higher resistance of $21k and breaks out it , your stop-buy is active, and your sell-limit order will be canceled at the same time .
vice versa , suppose you have already bought bitcoin at 20k for instance , you place an OCO order, so if it reaches the higher price about 22k as your TP ,you sell it and your cancel stop-limit order will be canceled , or otherwise if it goes down and loses the lower support, your stop-loss will be activated and sell -limit order will be canceled .
other concepts:
Post-Only Orders
Available as an additional option to Limit or Conditional Limit Orders, Post-Only Orders serve to strictly ensure that your Limit Orders will be placed into the order book and therefore pay a lower trading fees then it is ultimately executed. By selecting this option, the system will automatically cancel the limit order, if it detects that it will be executed immediately upon the order placement.
Good till cancelled (GTC): The order will remain valid until it is fully executed or manually cancelled by the trader. GTC is suitable for traders who are willing to wait for all contracts to be completed at a specified price and can flexibly cancel unconcluded contracts at any time.
Fill or Kill (FOK): The order must be immediately executed at the order price or better, otherwise, it will be completely cancelled and partially filled contracts will not be allowed. This execution strategy is more commonly used by scalping traders or day traders looking for short-term market opportunities.
Immediate or Cancel (IOC): The order must be filled immediately at the order limit price or better. If the order cannot be filled immediately, the unfilled contracts will be cancelled. IOC is usually used to avoid large orders being executed at a price that deviates from the ideal price. With this set, the contracts that fail to trade at the specified price will be cancelled.
sources: help.bybit -babypips.com. -academy.binance
This article is for informational purposes only. It should not be considered Financial or Legal Advice. Not all information will be accurate.

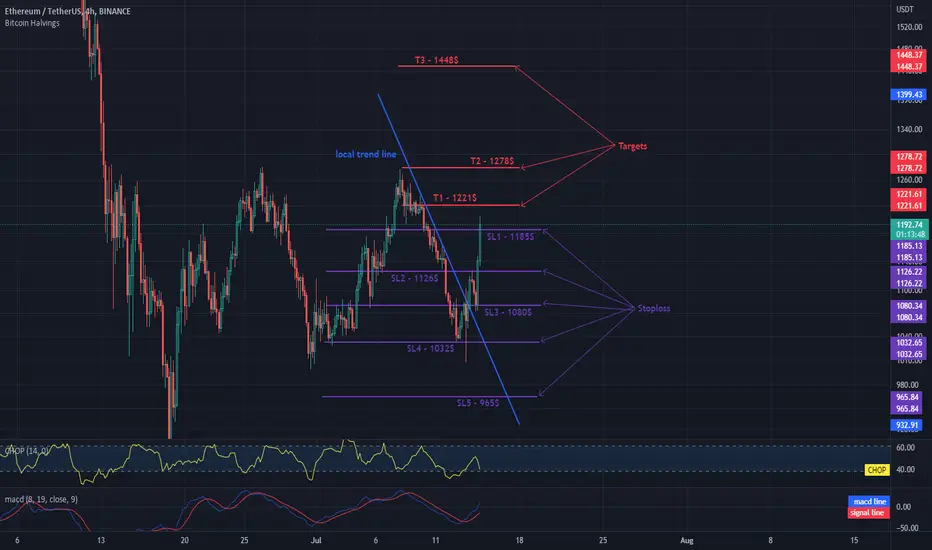
ETH 4HChart - Targets And StopLossHello everyone, let's take a look at the 4H ETH to USDT chart as you can see the price has moved above the local downtrend line.
Let's start by setting goals for the near future that we can consider:
T1 - $ 1,221
T2 - $ 1,278
and
T3 - $ 1,448
Now let's move on to the stop loss in case of further market declines:
SL1 - $ 1185
SL2 - $ 1126
SL3 - $ 1080
SL4 - $ 1032
and
SL5 - $ 965
Looking at the CHOP indicator, we can see that in the 4H range most of the energy has been surpassed and the MACD indicator shows that we are in a local uptrend.
PETRONET has retested , and showing BULLISH movement hey guys ,
PETRONET stock has shown signs of bullish movement
this stock was moving in a fixed downtrend ,
and first also ,
this stock has crossed it's resistance ,
but was not able to stand there for a long time ,
and it lead to BULL TRAP for traders ,
and after that ,
this stock has again crossed it's resistance,
and now retested.
There are several reasons to buy this stock ;
1. A LONG GREEN CANDLE IS MADE
2. THIS STOCK HAS RETESTED AND TAKEN SUPPORT ON IT'S RESISTANCE
3. MORNING STAR HAS BEEN MADE BY THIS STOCK
due to these reasons ,
i suggest you to buy this stock and earn high returns ,
I have marked the TARGET and STOP LOSS for y'all,
the RISKREWARD RATIO is 1:3
BUT PLS CONSIDER THE GLOBAL MARKET SITUATIONS;
1. INFLATION
2. WAR
3. RISING BANK RATES
4. INCREASED EXPORT DUTY ON CRUDE OIL
AFTER CONSIDERING THESE SITUATIONS
YOU CAN BUY THIS STOCK
PETRONET
😀😀

#gameplan P3N Low-Risk Setup:Risk management is very crucial when you trade. Here is one of my mostly applied strategies for risk management. It's useful for people who trade in a very volatile market or fade.
This method aims to limit the loss to zero by taking profit when reaching 1R. It's with less profit than expectation, but lower the risk.
1. Open the position and set how much $ you're going to risk for this gameplan. Then set the partial TP at the 1R and xR levels. (xR is your target.)
2. When price reaches 1R, it TP 1/2 position to keep the small profit.
3. If the trend is against our expectation and have a down move to -1R, at which our stop loss is, we close the position with 1/2 of the original with the same amount of loss as the profit. So this will keep our trade safe.
However, if it goes up to 5R, which is out target, we can still keep 1/2 of our position to take the profit.
Tips: You can use Fibonacci tools to predict how many xR in your gameplan.

ETH close to breaking the downtrend lineHello everyone, let's take a look at the 1D ETH to USDT chart as you can see that the price is right on the border of the downtrend line.
Let's start by setting goals for the near future that we can consider:
T1 - $ 1127
T2 - $ 1185
and
T3 - $ 1,277
Now let's move on to the stop loss in case of further market declines:
SL1 - $ 1,081
SL2 - $ 1033
and
SL3 - $ 968
Looking at the CHOP indicator, we can see that we have a lot of energy in the 1D range, and the MACD indicator shows that we are in a local downward trend

DR REDDY LABS , has crossed it's ASCENDING TRIANGLE pattern hey guys ,
DR REDDY LAB , stock was moving in a downtrend from a long time,
but now , this stock was moving in a fixed pattern called ASCENDING TRIANGLE PATTERN
at present , this stock has crossed it's RESISTANCE
and taken SUPPORT
as you can see that ,
on previous day , this stock has made a long GREEN CANDLE
and today , this stock has made a candle called DOJI
which has taken SUPPORT on its RESISTANCE
THERFORE , in my opinion you can buy this stock and get high returns ,
I HAVE MARKET THE TARGET AND SL
TO MAKE IT EASY FOR Y'ALL
BUT PLS CONSIDER THE GLOBAL MARKET SITUATIONS
1, INFLATION
2. WAR
3. RISING BANK RATES
4. RISING DUTIES OF CRUDE OIL EXPORT
AFTER CONSIDERING THIS SITUATION
YOU CAN BET ON THIS STOCK
DR REDDY LABS
😀😀

XRP / USDT SHORT 4HHello everyone, let's take a look at the 4H XRP to USDT chart as you can see the price is moving below the local downtrend line.
Let's start by setting goals for the near future that we can consider:
T1 - $ 0.3199
T2 - $ 0.3275
T3 - $ 0.3335
T4 - $ 0.3393
and
T5 - $ 0.3481
Now let's move on to the stop loss in case of further market declines:
SL1 - $ 0.3079
SL2 - $ 0.3039
SL3 - $ 0.2976
and
SL4 - $ 0.2912
Looking at the CHOP indicator, we can see that in the 4H range the energy is slowly rising, while the MACD indicator shows a local downward trend, however the blue line is approaching the red line, if it crosses it from the bottom, it may confirm the upward trend change.

DOGE in the local downtrend. Lots of energy on 1D.Hello everyone, let's take a look at the 1D DOGE to USDT chart as you can see the price has dropped below the local uptrend line.
Let's start by setting goals for the near future that we can consider:
T1 = $ 0.06843
T2 = $ 0.07035
T3 = $ 0.07241
T4 = $ 0.07513
and
T5 = $ 0.07849
Now let's move on to the stop loss in case of further market declines:
SL1 = $ 0.06040
SL2 = $ 0.05544
and
SL3 = $ 0.04919
Looking at the CHOP indicator, we can see that in the 1D range we have a lot of energy and the MACD indicator shows that we have entered a local downward trend.

SOL / USDT - 1daychart, trend change?Hello everyone, let's take a look at the 1D SOL to USDT chart as you can see the price is based on the local uptrend line.
Let's start by setting goals for the near future that we can consider:
T1 - $ 35.74
T2 - $ 36.51
T3 - $ 37.15
T4 - $ 37.78
and
T5 - $ 38.63
Now let's move on to the stop loss in case of further market declines:
SL1 - $ 34.23
SL2 - $ 32.71
and
SL3 - $ 30.83
Looking at the CHOP indicator, we can see that we have a lot of energy in the 1-day interval, while the MACD indicator shows that the blue line is approaching the red line if it crosses it from the top, it may confirm that the trend has changed into a downward trend.

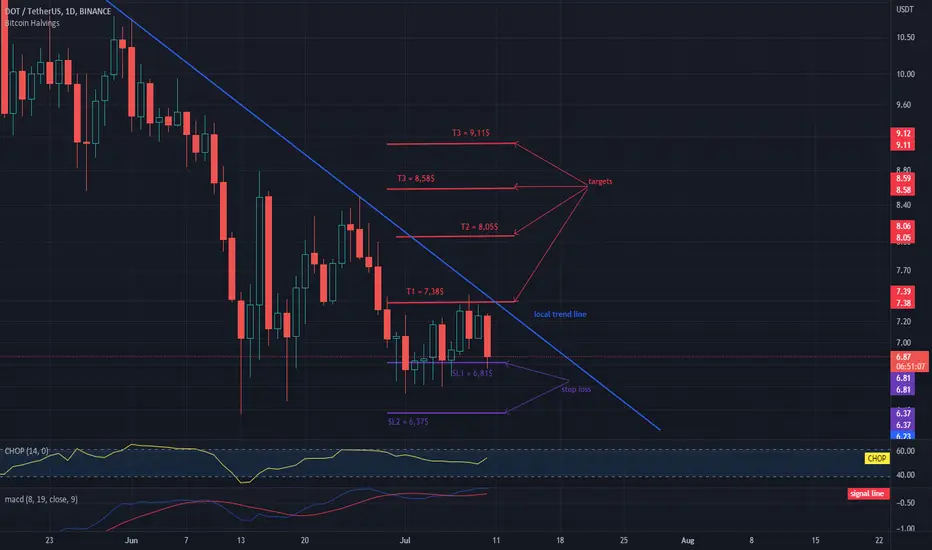
DOT / USDT 1DAY CHARTHello everyone, let's take a look at the 1D DOT to USDT chart as you can see the price is moving below the local downtrend line.
Let's start by setting goals for the near future that we can consider:
T1 = $ 7.38
T2 = $ 8.05
T3 = $ 8.58
and
T3 = $ 9.11
Now let's move on to the stop loss in case of further market declines:
SL1 = $ 6.81
and
SL2 = $ 6.37
Looking at the CHOP indicator, we can see that in the 1D range we are gaining more and more energy, and the MACD indicator shows a local upward trend.
BNB / USDT 1D INTERVAL, STOPLOSS AND TARGETSHello everyone, let's take a look at the 1day BNB to USDT chart as you can see the price is moving above the local uptrend line.
Let's start by setting goals for the near future that we can consider:
T1 - $ 242 which price is currently struggling with,
T2 - $ 260,
T3 - $ 278,
T4 - $ 304,
and
T5 - $ 337.
Now let's move on to the stop loss in case of further market declines:
SL1 - $ 232,
SL2 - $ 223,
SL3 - $ 215,
SL4 - $ 208,
SL5 - $ 196,
and
SL6 - $ 183.
Looking at the CHOP indicator, we can see that we still have a lot of energy in the 1-day range, and the MACD indicator shows that we are in the local uptrend. Please remember that this is not an investment advice.

ETH IN A LOCAL DOWNTREND Hello everyone, let's take a look at the ETH to USDT chart over the 4 hour timeframe. As you can see, price is moving above the local uptrend line.
Let's start with the designation of the support line and as you can see the first support in the near future is $ 1211, if the support breaks down, the next support is $ 1170 and $ 1137.
Now let's move from the resistance line as you can see the first resistance is $ 1225, if you can break it the next resistance will be $ 1235, $ 1245, $ 1259 and $ 1277.
Looking at the CHOP indicator, we can see that in the 4-hour interval we are recovering energy, while the MACD indicator shows a local downward trend.

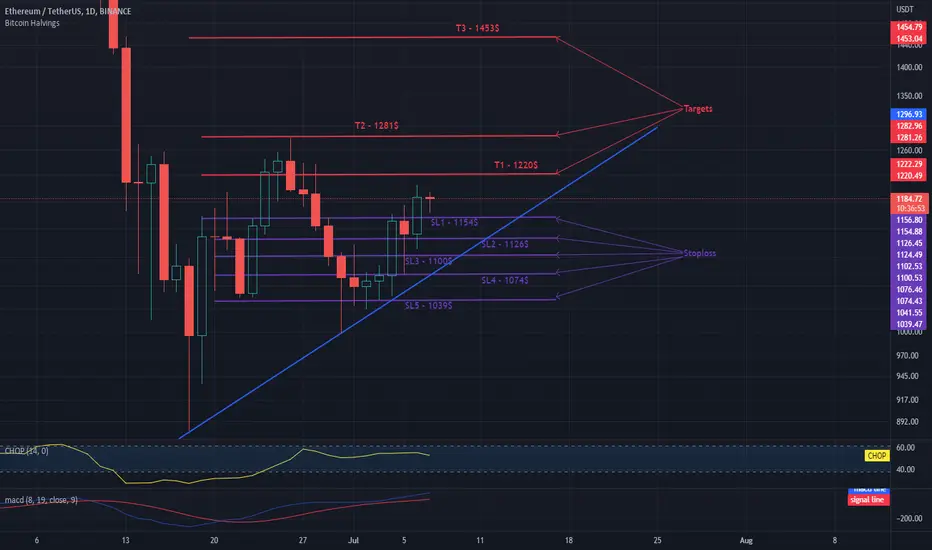
ETH 1DChart - Targets And StopLossHello everyone, let's take a look at the 1D ETH to USDT chart as you can see the price is moving below the local downtrend line.
Let's start by setting goals for the near future that we can consider:
T1 - $ 1,220
T2 - $ 1,281
and
T3 - $ 1,453
Now let's move on to the stop loss in case of further market declines:
SL1 - $ 1154
SL2 - $ 1126
SL3 - $ 1,100
SL4 - $ 1074
and
SL5 - $ 1039
Looking at the CHOP indicator, we can see that we have a lot of energy in the 1D interval and the MACD indicator shows a local upward trend.
MATIC / USDT 1D chartHello everyone, let's take a look at the 1D MATIC to USDT chart as you can see the price is moving above the local uptrend line.
Let's start by setting goals for the near future that we can consider:
T1 - $ 0.5245
T2 - $ 0.5490
T3 - $ 0.5853
and
T4 - $ 0.6616
Now let's move on to the stop loss in case of further market declines:
SL1 - $ 0.5103
SL2 - $ 0.4923
SL3 - $ 0.4773
SL4 - $ 0.4634
and
SL5 - $ 0.4436
Looking at the CHOP indicator, we can see that in the 1D range we have a lot of energy, and the MACD indicator indicates the beginning of a local uptrend.

XRP - USDT on 1H interval shortHello everyone, let's take a look at the 1H XRP to USDT chart as you can see the price is moving below the local downtrend line.
Let's start by setting goals for the near future that we can consider:
T1 - $ 0.3171
T2 - $ 0.3199
T3 - $ 0.3220
T4 - $ 0.3243
and
T5 - $ 0.3275
Now let's move on to the stop loss in case of further market declines:
SL1 - $ 0.3142
SL2 - $ 0.3097
and
SL3 - $ 0.3052
Looking at the CHOP indicator, we can see that in the 1H range, energy has been used, and the MACD indicator shows that the blue line is approaching the intersection of the red one from below, which would confirm a local uptrend.

ADA/USDT 1D INTERVALHello everyone, let's take a look at the 1D ADA to USDT chart as you can see the price is moving below the local downtrend line.
Let's start by setting goals for the near future that we can consider:
T1 - $ 0.4563
T2 - $ 0.4698
T3 - $ 0.4807
and
T4 - $ 0.4909
Now let's move on to the stop loss in case of further market declines:
SL1 - $ 0.4437
and
SL2 - $ 0.4213
Looking at the CHOP indicator, we can see that in the 1D range we have a lot of energy and the MACD indicator shows that we can enter an upward trend locally.

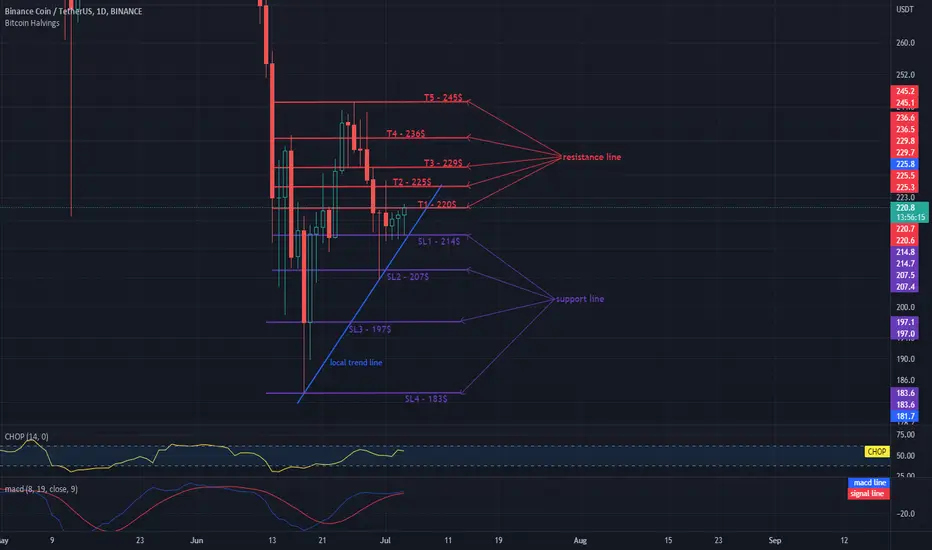
BNB / USDT 1DAYCHART TARGETS AND STOPLOSSHello everyone, let's take a look at the 1D BNB to USDT chart as you can see the price is moving above the local trendline.
Let's start by setting goals for the near future that we can consider:
T1 - $ 220
T2 - $ 225
T3 - $ 229
T4 - $ 236
and
T5 - $ 245
Now let's move on to the stop loss in case of further market declines:
SL1 - $ 214
SL2 - $ 207
SL3 - $ 197
and
SL4 - $ 183
Looking at the CHOP indicator, we can see that we have a lot of energy in the 1D range, while the MACD indicator shows a local upward trend.
DOGE/USDT TARGETS AND STOPLOSSHello everyone, let's take a look at the 4H DOGE to USDT chart as you can see the price is moving below the local uptrend line.
Let's start by setting goals for the near future that we can consider:
T1 = $ 0.06843
T2 = $ 0.07035
T3 = $ 0.07241
T4 = $ 0.07513
and
T5 = $ 0.07849
Now let's move on to the stop loss in case of further market declines:
SL1 = $ 0.06391
SL2 = $ 0.06040
SL3 = $ 0.05544
and
SL4 = $ 0.04919
Looking at the CHOP indicator, we can see that in the 4H range we have a lot of energy for the next move, while the MACD indicator shows a local upward trend.
