$OCEAN/USDT 3D (#Bybit) Broadening channel on resistanceOcean Protocol has been up-trending and is now facing 100EMA, RSI looks overbought, a bearish rejection would make sense.
⚡️⚡️ #OCEAN/USDT ⚡️⚡️
Exchanges: ByBit USDT
Signal Type: Regular (Short)
Leverage: Isolated (1.5X)
Amount: 7.1%
Current Price:
0.2461
Entry Zone:
0.2475 - 0.2821
Take-Profit Targets:
1) 0.2057
2) 0.1613
3) 0.1168
Stop Targets:
1) 0.3142
Published By: @Zblaba
Risk/Reward= 1:1.2 | 1:2.1 | 1:3.0
Expected Profit= +33.48% | +58.63% | +83.84%
Possible Loss= -27.98%
Fib. Retracement= 0.382 | 0.618 | 1
Margin Leverage= 1.5x
Estimated Gain-time= 3 months
Tags: #OCEANUSDT #AI #BigData #Scaling #Storage #Web3 #DeFi
Website: oceanprotocol.com
Storage

Update on US Henry Hub Natural Gas Prices – December 2022A cold weather snap forecast across much of the United States is driving demand for natural gas as a heating fuel higher. Prices of front month Henry Hub Natural Gas Futures have risen over the past week as a result. The front of the curve has moved more than the rest of the curve. The curve is now close to where it was two weeks ago.
Natural gas in storage is within seasonally normal range. Since June 2022, when Freeport LNG Terminal had to shut down after a fire, natural gas storage in the US has been ramped up as the gas produced in the US can no longer be exported at the same volume as prior to the shut-down. Freeport LNG accounts for close to 20% of US export capacity. Its re-opening has been delayed many times and the latest guidance from Freeport is a partial opening in mid-December 2022 and full production in March 2023 . However, in an email statement to Reuters they have pushed the reopening to end-of-year , and we remain sceptical that there will be any flow of LNG from the terminal this side of the of the New Year.
Ample storage could drive US natural gas prices lower when the cold weather snap passes.
Europe has been able to fill its natural gas storage capacity to close to 90% coming into the start of the winter period (October 2022) and is now drawing on that capacity at a slower than expected rate due to thrifting and an initially milder-than-expected weather pattern. However, colder weather has arrived, which could drive higher demand. Natural gas flows to Europe from Russia have slowed to a trickle and hence the region is reliant on Liquified Natural Gas from elsewhere. Unfortunately, with Freeport LNG offline, the US will not participate fully in meeting this demand over the coming weeks, but US Henry Hub may get a boost when Freeport LNG opens.
The European Union is currently trying to implement a price cap on imports. There is no final deal to speak of, but the European Commission’s proposal, is for a market correction mechanism that would kick in when the price of month-ahead contracts on the Dutch Title Transfer Facility exceeded €275 ($290) per megawatt hour and the gap between world prices was greater than €58 . Any success in approving this price cap, could limit upside for US Henry Hub used as feedstock for LNG exports to Europe. However, with the price gap between US and European natural gas prices being so wide (almost 6 times ), we believe the upside could nevertheless very large.
Source:
1 FREE PORTING NEW ROUTER
2 Reuters
3 Bloomberg 13/12/2022
4 WisdomTree calculation on 13/12/2022 using Dutch TTF Gas 1st Line Financial Futures (USD/MMBTU) as published by ICE Endex who convert megawatt hour to Metric Million British Thermal Unit (MMBTU) and USD using the WM/Refinitiv Closing EURUSD Spot Rates as published by Refinitiv at 4 pm UK time and Henry Hub Front month futures.

Will AI help us in building better batteries?We have written a series of blogs on how artificial intelligence (AI) is advancing other megatrends:
AI Continues to Build the Foundation for a Remarkable Future in Biology
Can AI Replace People? The Truck-Driving Case Study
The World Needs More Metals. Maybe AI can Find Them.
By exploring these connections between themes, we can view AI less as a black box of algorithmic complexity and more as something that is focused on solving concrete problems in the world.
A brief primer on electrochemical batteries1
What we know today as ‘lithium-ion’ batteries fall into the class of ‘electrochemical batteries’. For the battery to generate power the chemical process has to generate electrons, and for the battery to be ‘re-charged’ it has to store electrons.
The structure of the battery involves the anode (negative side), electrolyte and cathode (positive side). The current that the battery can generate relates to the number of electrons flowing across from negative to positive, and the voltage relates to the force with which the electrons are traveling.
Using the battery, that is, using your smartphone or driving your electric car, means that the electrons are flowing from the anode, through the electrolyte and to the cathode. Charging your devices means that you are forcing the process to occur in reverse, where the electrons are leaving the cathode, going back across the electrolyte and ending up in the anode.
Why do we have to know all of that?
Some of you might be like me and think—my last chemistry class was more than 20 years ago. The reason we set that foundation, however, is that it now allows us to think in terms of the following:
The different parts of the battery can be fashioned out of different elements.
Changing the mix of metals in the cathode, for example, may impact the energy density, speed of charging, heat dispersion or other battery characteristics.
Researchers can experiment with all sorts of different anodes, cathodes and electrolytes as they seek to optimise the characteristics of a given battery to its use case.
Now we can better understand the ways in which an artificial intelligence process can be utilised to seek to improve different characteristics of the batteries that we use.
Who wants electric vehicles to charge faster?
One of the many obstacles to the wider usage of electric vehicles is the time it takes to charge a battery vs. filling a tank with petrol. Since filling the tank is much faster, they opt for the internal combustion engine over the battery electric vehicle.
There is huge marketability for automobile manufacturers and battery-makers for every unit of time they can shave off of charging times.
Researchers at Carnegie Mellon used a robotic system to run dozens of experiments designed to generate different electrolytes that could enable lithium-ion batteries to charge faster. The system is known as Clio, and it was able to both mix different solutions together as well as measure performance against critical battery benchmarks. These results were then fed into a machine-learning system, known as Dragonfly2.
Dragonfly is where the process starts to get exciting—the system is designed to propose possible combinations of chemicals to be used in the electrolytes that could potentially work even better. Using this process during this particular time period led to six different electrolyte solutions that outperformed a standard one when they were placed into typical battery test cells. The best option showed a 13% improvement relative to the top-performing battery baseline3.
In reality, electrolyte ingredients can be mixed and matched billions of different ways, but the benefit of using the system of Clio and Dragonfly working together is that one can get through a wider array of possibilities faster than humans alone. Dragonfly also isn’t equipped with information about chemistry or batteries, so it doesn’t bring the ‘bias of previous knowledge or experience’ to the process.
Using AI to help the progress of solid-state batteries
While the aforementioned path involves improving liquid electrolytes, it is not the only critical area of battery research today.
If the flammable, liquid electrolyte is replaced by a stable solid, it’s possible that there would be improvements in battery safety, lifetime and energy density. However, finding the appropriate materials to facilitate building solid-state batteries that fit all specifications and that can be produced at scale is not a simple matter.
Researchers at Stanford have noted a particular process where they compile data on 40 materials with both good and bad measured room temperature lithium conductivity values. This particular characteristic is thought to be the most restrictive of all the different constraints on candidate materials. The 40 examples are ‘shown’ to a logistic regression classifier, which can ‘learn’ to predict whether the material performed well or not based on the atomistic structure. After the training phase, the model can then evaluate more than 12,000 lithium-containing solids and find around 1,000 of them that have a better than 50% chance of exhibiting fast lithium conduction4.
Progressing solid state batteries along the development path is therefore another clear use-case for artificial intelligence.
Conclusion: energy storage is one of the most important considerations for the coming decades
Having better energy storage solutions will help global society in myriad different ways. The classic case—there are intermittent power generation sources like solar and wind that can use batteries to equilibrate the flows of energy across time. However, I think we’d all love smartphones that don’t need a charge for a week or electric vehicle batteries with long range that can charge in similar times to what it previously took at a gas station.
Sources
1 Source:Volts - A primer on lithium ion batteries
2 Source: Temple, James. “How robots and AI are helping develop better batteries.” MIT Technology Review. 27 September 2022.
3 Source: Temple, 27 September 2022.
4 Source: Reedgroup Stanford

Too fast, too furious for Natural Gas?After a sharp drop in August, Natural Gas futures is now sitting close to the long-term uptrend support which has marked key reversal points since June 2020. Our question is whether prices have fallen too fast and too soon?
We question “too furious” when we look at the RSI which currently points to oversold levels. Hitting a low close to 24, the last time RSI reached such an oversold level, in February 2017, prices rallied close to 35% over the next 2 months. We also note the formation of RSI divergence now, like the one we observed during the 2017 period. If history is any guide, from a technical perspective we can expect some upside for Natural Gas in the coming 2 months.
We question “too fast” as we are at the dawn of the seasonality trade. With demand for Natural gas used for heating generally rising as winter months are approaching, we can reflect on the seasonality behavior of Natural Gas prices over the past winters. A simple strategy of buying in the middle of October and waiting for the winter months gives a 70% win-rate when we look back at the past 10 years. Could we expect the same this winter?
On top of these, we think there are a few structural factors that might boost natural gas demand in the US over a longer-term horizon.
1) The recent announcement by the Biden administration that ruled out a ban or curbs on natural gas exports this winter, and Europe’s struggle with the energy crisis spell good news for Natural Gas’s demand.
2) Current Natural gas storage levels are also below the 5-year average as reported by the US EIA .
3) A move away from coal as agreed in the COP26 means alternative energy sources are bound to replace coal. With many coal-powered plants being refurbished to work with natural gas, we see structural demand rising as more of these plants come online.
Natural gas’s current technical levels point oversold to us, with the seasonality trade potentially on the cards and an overall supportive macro backdrop, we lean bullish on Natural gas. As Natural Gas is considered a highly volatile contract, we can use the Average True Range (ATR) to set our stops. In this case, we follow the rule of thumb to multiply the ART by 2, which sets our stop at roughly 4.550.
Entry at 5.200, stop at 4.550. Target at 6.400.
The charts above were generated using CME’s Real-Time data available on TradingView. Inspirante Trading Solutions is subscribed to both TradingView Premium and CME Real-time Market Data which allows us to identify trading set-ups in real-time and express our market opinions. If you have futures in your trading portfolio, you can check out on CME Group data plans available that suit your trading needs www.tradingview.com
Disclaimer:
The contents in this Idea are intended for information purpose only and do not constitute investment recommendation or advice. Nor are they used to promote any specific products or services. They serve as an integral part of a case study to demonstrate fundamental concepts in risk management under given market scenarios.

FIL - Potential Bullish Reversal!Hello TradingView Family / Fellow Traders. This is Richard, as known as theSignalyst.
on DAILY: Left Chart
FIL rejected a strong support and demand zone, so we will be looking for buy setups.
on H4: Right Chart
on DAILY: FIL formed a valid double bottom pattern but it is not ready to go yet.
Trigger => for the bulls to take over, we need a momentum candle close above the gray neckline.
Meanwhile, until the buy is activated, FIL would be overall bearish can still trade lower inside the demand zone.
Always follow your trading plan regarding entry, risk management, and trade management.
Good luck!
All Strategies Are Good; If Managed Properly!
~Rich

if she crosses the top yellow line exit your short u will loose iseemanypeoplesaythiscoinisdead.itisintheprocessofturningthecorner.youwillseethismakefrontpagenewssoon.

Filecoin huge bull flag 🚀🚀We could see a break out as soon as tomorrow morning. Let the storage wars begin #FILUSD #FILECOIN #STORAGEWARS

FIL - Storage Coins Leading The Day!Hello TradingView Family / Fellow Traders. This is Richard, as known as theSignalyst.
For those who know me well, know that I have been a big fan of Storage coins like FIL, STORJ, AR and many more...
After the big increase in FIL this week, Storage coins are getting the attention of many investors.
Coins related to Metaverse, Defi and many categories had their time. Will storage coins be the next movers?
Let's get back to our price action analysis ;)
on H4: Right Chart
the bulls took over after rejecting the 5.0 round number and breaking above the gray range.
now what?
on DAILY: Left Chart
FIL is trading inside our red channel, so yes we are still bearish from a long-term perspective.
For the bulls to take over from a longterm perspective, we need a break above the last major low and 20.0 round number.
but first we want a break above the upper red trendline to invalidate it and then be able to test the 20.0
Meanwhile, the bears can still kick in to form a new major swing high around the upper trendline.
in this case, the new swing high will be considered our trigger swing, and the bulls need to break above it for them to take over from a long-term perspective.
Always follow your trading plan regarding entry, risk management, and trade management.
Good luck!
All Strategies Are Good; If Managed Properly!
~Rich

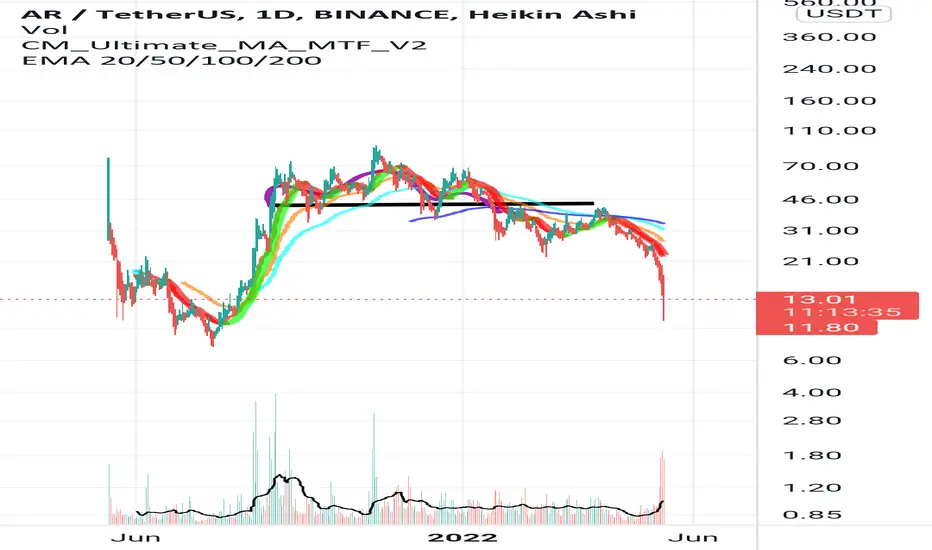
Nearly thereArweave has a little bit more to go to reach the bottom - somewhere near 8 dollars. Would be a good time now to start buying a little bit here and there.
$SC SiaCoin a strong case for the bullsSiaCoin the dentralized storage platform has had a 500% increase in storage used on its network since 2021 constantly growing and repeatedly setting ATH's in usage, the network had 0.5 PetaBytes stored by its users and at writing today has 2.5 Petabytes stored on the network. Behind the scenes of the token itself, the project is consistently growing in its utility and users, the sia network and the coin are paired like an elastic band and its only a matter of time as the sia network pulls further and further ahead that the coin will shoot back to the project and catch up to the gains the network is making.
The calm before the storm.....
In this analysis i've touched on some rough wave theory on the weekly marked by points 1 through 5 and points w,x & y. Ive then also brought in the fibs as it seems to have been respected at the .236 and .5 indicating the possibility of the more significant fibs being tested.
View siastats.info to view the growth of the network.

BTT is consolidating in the 2nd wavecrab harmonic pattern:
X=$0.011
A=$0.0001
AB=0.61 XA
BC=0.88 AB
0.78 XA=$0.0042
0.88 XA=$0.0066
1.6 BC=$0.009
1.13 XA=$0.02
2 BC=$0.023
1.27 XA=$0.04
2.24 BC=$0.043
1.41 XA=$0.075
2.6 BC=$0.112
1.6 XA=$0.197
3.6 BC=$1.4

A Exponential pump on the way !!NOT A FINANCIAL ADVICE !!
EDUCATIONAL PURPOSE ONLY !!
short term- 40 USD
midterm- 65USD
longterm- 400-600USD

Aleph.im Decentralized Database- i am always sneaking around for new "Gems" and that project could be one of them.
- it's a "Filecoin" concurent but multichain, not yet famous. Dyor more about this project : aleph.im
- 500M supplies and 0.4$. Price is still very cheap imho.
- What Is Aleph.im (ALEPH)?
Aleph.im is an open-source crosschain network featuring decentralized database including file storage, computing, and a decentralized identity (DID) framework. Aleph.im’s core mission is to help decentralized apps and protocols strip off the centralized parts of their stack, achieving a fully decentralized architecture. You can think of aleph.im as a decentralized AWS or firebase. Aleph.im is focused on supercharging the DeFi ecosystem.
-----------------------------------------------------------------------------------------------------------------------------
Trading Plan
-----------------------------------------------------------------------------------------------------------------------------
Option 1 : Buy now if you wanna invest for long term because, i am not even sure that this coin will retrace.
Option 2 : Keep juice for a retrace and buy around 0.25$.
Option 3 : If dip more full buy at 0.15$.
Take Profits : Before 1.2$
-----------------------------------------------------------------------------------------------------------------------------
invest wisely and stay safe.
Happy Tr4Ding !

Filecoin needs an ABC harmonic pattern in the 2nd wavecrab harmonic pattern:
X=$189
A=$1.63
AB=0.68 XA
BC=0.88 AB
0.78 XA=$68.5
0.88 XA=$110
1.6 BC=$152
1.13 XA=$351
2 BC=$407.81
1.27 XA=$690
2.24 BC=$757
1.41 XA=$1329
2.6 BC=$2009
1.6 XA=$3572
3.6 BC=$26524

$SOUL/USDT 12h (KuCoin) Bull pennant near breakoutPhantasma is up-trending above 100EMA support and has formed a bullish continuation pattern, let's join on next dip!
Risk/Reward= 1:2 | 1:3.82 | 1:7.6
Expected Profit= +44.18% | +84.57% | +168.30%
Possible Loss= -22.14%
Fib. Retracement= 0.786 | 1.117 | 1.618
Margin Leverage= 1x
Estimated Gain-time= 1.5 months
Website: phantasma.io
Contracts:
#ERC20 0x79c75e2e8720b39e258f41c37cc4f309e0b0ff80
#BEP20 0xc3adbf524513863102df6784e1ab5652165c7912
#Neo ed07cffad18f1308db51920d99a2af60ac66a7b3
⚡️⚡️ #SOUL/USDT ⚡️⚡️
Exchanges: KuCoin
Signal Type: Regular
Current Price:
2.5122
Entry Zone:
2.4976 - 2.1934
Take-Profit Targets:
1) 3.3818
2) 4.3292
3) 6.2929
Stop Targets:
1) 1.8261

$BTT/USDT 3D (Binance Spot) Big bull pennant breakout and retestBitTorrent is holding above 100EMA support and is finally showing some bullish pattern on macro view.
That Tron / BSC token is focused on Filesharing and Storage, more info on www.bittorrent.com
Risk/Reward= 1:3 | 1:7.42 | 1:13.9
Expected Profit= +93.61% | +231.93% | +434.28%
Possible Loss= -31.24%
Fib. Retracement= 0.618 | 0.883 | 1.117
Margin Leverage= 1x
Estimated Gain-time= 6 months
TRON10: 1002000
BEP20: 0x8595f9da7b868b1822194faed312235e43007b49
⚡️⚡️ #BTT/USDT ⚡️⚡️
Exchanges: Bittrex, KuCoin, Huobi.pro, Binance
Signal Type: Regular (Long)
Entry Zone:
0.003573 - 0.002873
Take-Profit Targets:
1) 0.006240
2) 0.010698
3) 0.017220
Stop Targets:
1) 0.002216

$ESTC: Netherlands Data ManagementStrong momentum setup here with ESTC, going to be watching potential break outs next week

Filecoin Breaking out - Storage set to recoverShort term price target - $90
Short term outlook - Bullish
Long term outlook - Bullish
Storage coins are finding support and strengthening. This is am amazing part of the blockchain world and will be the future of file storage.
This format might not look exactly like what we see today, but Roam wasn't built in a day!
I am bullish on blockchain file storage over the next month and longer term. I will keep on HODLING. However, this could be a nice entry point for someone looking to get exposure in to this space.


don't lose this crab at $45crab harmonic pattern:
AB=0.61 XA
BC=0.88 AB=$45
tp1=1.6 BC=$220
tp2=2.6 BC=$583
tp3=1.6 XA=$720
tp4=3.6 BC=$1543

BTT if can't breakout the downtrend and median lineif we consider the downtrend and median line of the pitchfork BTT seems bearish. BTT needs breakout the downtrend and median line to be bullish.


Arweave flag breakout!Arweave is a fundamentally great project and since its main source of income is from Solana, It is lagging behind SOL.
Looking at its chart in BTC, It's finally getting out of the flag. Possible target are shown via the arrow.
