Storj


STORJBTC SignalSTORJBTC has had a strong breakout from a solid bottom. We set targets to hit as it consolidates its recent upward move.
Buy: 6500 - 6600
Target 1: 0.00007177
Target 2: 0.00007606
Target 3: 0.00008631
Target 4: 0.00009296
Stoploss: 0.00006096


$STORJ, Potential symmetrical triangle on the edge of breakout..
UCTS Buy signal active
Both RSI & MACD flat for now
Volume looks low but as seeing in the chart, spikes are common ...
Target in the chart & ascending trendline as SL.
#STORJ


Watching out for STORJ breakoutDescending triangles have bigger chance to break to the down side. I think this one might go the other way. I wouldn't enter before the breakout though.

Storj/btc is good now to make another pumpStorj/btc target is
7339~7771
Stop loss Break the triangle down
Telegram channel :https://t.me/break_impossible


A trading opportunity to buy in STORJETHTechnical analysis:
. STORJ/ETHEREUM is in a range bound and the beginning of uptrend is expected.
. The price is above the 21-Day WEMA which acts as a dynamic support.
. The RSI is at 51.
. While the RSI downtrend and the price downtrend in the daily chart are not broken, bearish wave in price would continue.
Trading suggestion:
. There is a possibility of temporary retracement to suggested support zone (0.00102 to 0.00088). if so, traders can set orders based on Price Action and expect to reach short-term targets.
Beginning of entry zone (0.00102)
Ending of entry zone (0.00088)
Entry signal:
Signal to enter the market occurs when the price comes to " Buy zone " then forms one of the reversal patterns, whether " Bullish Engulfing ", " Hammer " or " Valley " in other words,
NO entry signal when the price comes to the zone BUT after any of the reversal patterns is formed in the zone.
To learn more about " Entry signal " and the special version of our " Price Action " strategy FOLLOW our lessons:
Take Profits:
TP1= @ 0.0011480
TP2= @ 0.0013180
TP3= @ 0.0014280
TP4= @ 0.0015690
TP5= @ 0.0017660
TP6= @ 0.0019940
TP7= @ 0.0023410
TP8= @ 0.002685
TP9= @ 0.003801
TP10= Free

Looking for a new GEM 4 ( shit coin in crypto ) Bought my own bag ( that I sold in November) . Hold as long as it stays above the support-line.
WHAT I LEARNT 2 YEARS OF TRADING IN THIS CRYPTO MARKET!
1 ) Weekly open –close above MA 20 ( bullish trend)
Weekly open –close below MA 50 ( Bearish trend )
Super Bullish : The candle is above MA 20 ( Daily )
Bullish : MA 50 Above MA 100 ( Daily )
Bearish : MA 50 below MA 100 ( Daily )
2) If it breaks the daily trend line with a strong candle, it is the easiest buy / sell signal.
3 ) If your main job is trade ( making the money to survive - cover the cost of living ) , dont focus 1 minute , 5 minutes, 15 minutes, 45 minutes charts! Never!
Only check 4 hour / 1 day / 1 week in crypto!!!
When the break came almost all of the crypto coins had been hurt or fractured. It was now a question of estimating how sick the cryptos were and how long their sickness would last. I reasoned that if a crypto has fallen from 10 to 1, it will almost certainly not climb up to the same high again for a long, long time. It was like an athlete with a badly injured leg who would need a long period of recuperation before he could run and jump again as before.
Target? The charts speaks itself!

StorJ Chart Analysis - Bullish Signals For Beginners (Learning)I am sharing the following trade idea with the purpose of reading some simple signals.
If you are starting with charts, these are some of the main signals I look for to spot an upcoming wave.
Let's see what we have in the chart above:
Strong breakout (EMA10 & EMA50). Price moved with momentum and good volume above these lines.
Now is easy to see the volume. This is the volume bar. The higher the volume, the stronger the signal.
Bullish crossover. When the MACD crosses the signal line on the MACD indicator.
Bullish RSI. When the RSI is above 50.
As you can see, these are pretty simple, and you can get used to them pretty easily if you practice.
I hope this content taught you something and at the same time you were entertained while reading. If that is the take, take your time to hit LIKE.
Your continued support is ALWAYS, appreciated.
Namaste.

Daily Bullish Signal $STORJ #STORJ (18 Jan)BLUE ARROW indicates the EXPECTED Time and Targets
Level Stoploss point up to maximize profit and reduce risk
I'm working all the time, even in Bearish Market

STORJ GREAT PROFITBuy Price: Green area
Profit: in short-therm i expect 10-15%, in long-therm i expect 40-50%!
Invest Suggestion: 20 Percent
Profit Expectations: - 10 - 50 Percent
Looking at the chart of Storj , we could see that is close the it historical low!!
We Have the 13 HMA crossing the 34 HMA and the 50 HMA, indicating that we have a growth tendency!!
MACD lines crossed too and ANN strategy indicating a buy order!
Sell when you get some profit, according the way you trade.
Keep following us and please like this idea.
Any doubts? Send in the comments or in our telegram or Inbox here.
Thanks for visiting.

looking for a STORJ relief rally?Just like several other of the altcoins with similar chart patterns, STORJ has closed red the last 5 consecutive daily candles and is down roughly 20% over that period. It finds itself back in the prior support range and like its odds of potentially showing a relief rally back towards prior support range in 4750-4850 to start; working its way up towards prior wick highs from oct in low 60s; although not looking to go that far and my 'optimistic' 4th target is at 6000
ideal entry: < 4000
s/l : 3595 (-10%)
T1: 4750 (+19%)
T2: 5050 (+26%)
T3: 5500 (+38%)
T4: 6000 (+50%)

STORJ Signal #STORJ #STORJBTC
Storj is the storage layer for the Internet. Decentralized cloud storage is a new paradigm that removes intermediaries, enabling you to control your personal data.
Buy: 4765- 4860
Target:
5008
5488
5880
6501
Mid term:
7156
7930
8566
9182
SL: 4352
Risk/Reward: 10% / 99%
Invest: 3%
From Watchlist:
STORJ Signal | Price Prediction#STORJ #STORJBTC
Storj is the storage layer for the Internet. Decentralized cloud storage is a new paradigm that removes intermediaries, enabling you to control your personal data.
Buy: 4620- 4880
Target:
5008
5488
5880
6501
Mid term:
7156
7930
8566
9182
SL: 4152
Risk/Reward: 10% / 99%
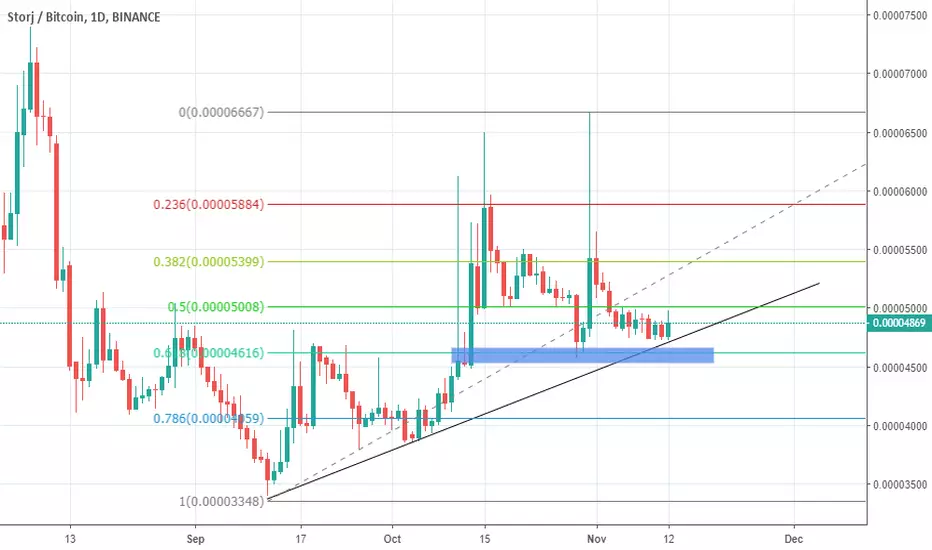
Daily Bullish Signal $STORJ #STORJ STORJ/BTC (11 November)BLUE ARROW indicates the EXPECTED Time and Targets
Contact me if you need help


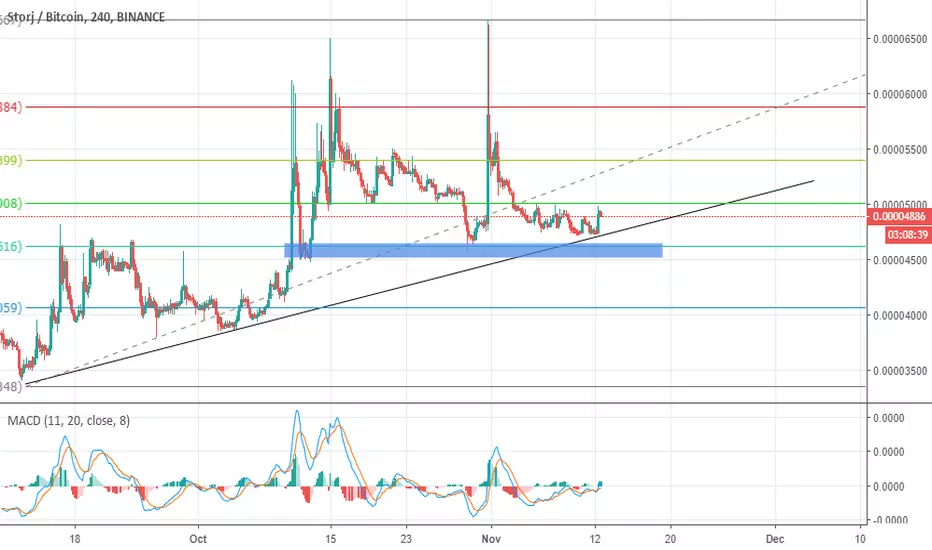
STORJ, H4, BuyMany of you when you see the chart coin up, then ask if it is uptrend or not. I would like to use the chart of medium-term STORJ as an example:
You can see on the chart that I paint STORJ is entering the support Buy pretty well, the buy zone in the bottom half of the blue box (area 36 - 39), the SL area under the purple line. After this buying cycle, the bull market will rebound to 5858, correcting the 4311 zone and ending at 73xx. Target price reached 117% of profit. The target price may be higher, we will update when the cycle 1 is accurate.
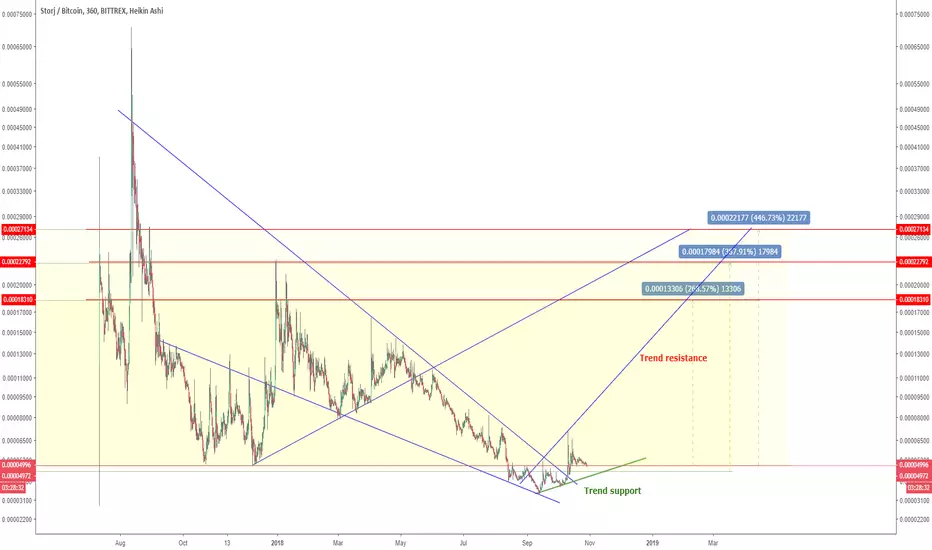
However, you can see that STORJ is still in the long-term downtrend. The rally in October is likely to be just a quick rally, and STORJ will continue to fall further to 95% below the 1000 sts. We are temporarily measuring the 308 zone. This will be the end point for the bear market and start a new rally.
That means that the market has not been uptrend, the market is correcting the increase in the medium term, the coin tends to return from 50-200% of the bottom created and then continue to decline. So you should be very alert, protect the account, raise the SL and keep the original transaction. Wish you successful trading!
