#STORJ/USDT#STORJ
It is moving in a bearish channel on a 1-hour frame, and the price committed to the green support area at the level of 0.7300.
We have a higher stability moving average of 100
We have bullish momentum on the RSI
Entry price is 0.7538
The first target is 0.7665
The second target is 0.7852
The third goal is 0.8090
STORJUSD

Is STORJ getting ready for a pump? +55% profit from the trade.Hello everyone! I suggest considering buying the coin #STORJ.
Currently, the asset is in a global resistance and support zone to which the price is reacting very well.
In the local range, the breakout from this zone is at $0.7749. As seen on the chart recently, after breaking out of this range and consolidating above this level, a strong pump of the asset occurred.
It can be assumed that the situation will repeat itself.
Target - $1.20, +55% profit from the trade.
This is not financial advice, everything you do, you do at your own risk!

STORJ LOOKS BULLISHAccording to iCH and iBOS and the expansion of the Demand area, it seems that Storj can move towards the targets.
In terms of time, a good amount of time has passed since the drop.
For risk management, please don't forget stop loss and capital management
When we reach the first target, save some profit and then change the stop to entry
Comment if you have any questions
Thank You

STORJ - 1267% profit in 2024, buy nowSTORJ looks incredible. We can see that the price broke out of the falling wedge - bullish reversal pattern on the weekly chart. Always look at the volume indicator to confirm the validity of the breakout. If we take a look at the volume indicator, we can see that the bullish volume is overwhelming, which is very positive! What's more important is the Elliott wave analysis. My analysis suggests that we started this uptrend with a strong impulse wave of 12345. That's the dream of every Elliott Wave trader. What we want to do is buy the correction of this impulse wave. Wave (2) should be complete, so it's good to buy this coin now. Let me know what you think about my analysis, and please hit boost and follow for more ideas. Trading is not hard if you have a good coach! Thank you, and I wish you successful trades.
What Is Storj?
Storj, pronounced as “storage,” is an open-source cloud storage platform. Basically, it uses a decentralized network of nodes to host user data. The platform also secures hosted data using advanced encryption.
In a white paper published in December,2014, Storj was first introduced to the world as a concept. It was to be a decentralized peer-to-peer encrypted cloud storage platform.
Two years later, an updated white paper was published. Here, a decentralized network — connecting users who need cloud storage space with those who have hard drive space to sell — was described. The platform was launched in late 2018.
People with hard drive space and good internet connectivity can participate in the network. They become a unit in the network, called a node. Space providers are rewarded by Storj tokens.
What Makes Storj Unique?
As a decentralized cloud storage network, Storj is unique in more ways than one. For one, unlike traditional cloud storage solutions that store data in huge data centers, Storj runs on a network of thousands of independent computers.
Anyone with a few extra terabytes of space can become a node on the platform by installing Tardigrade. All that is required is a strong and consistent internet connection.
The efficiency of the network means that hosts pay far less for the storage of their data than when employing traditional cloud storage services.

STORJ is giving another chance to ride the 2nd wave UP!STORJ surprised every one with a sudden pump to 0.60 with volume surging 2455%. That parabolic move -- as usual warranted a much needed correction to 78.6 FIB LEVEL at 0.35 price range.
It is now bouncing off this 78.6 fib level with precision -- with price being attractive again.
This newly created higher-low price range is a good base level for a new ascend.
Currently sitting at a major order block support, this level is a good area to seed for the 2nd wave up. I'm anticipating initial accumulation at the current price range.
Expect some significant price bounce from here on.
Spotted at 0.350
RR ratio on this one is too attractive factoring the weight of the correction.
TAYOR.
Safeguard capital always.

STORJ lond idea hello Traders, here is the full analysis for this pair, let me know in the comment section below if you have any questions, the entry will be taken only if all rules of the strategies will be satisfied. I suggest you keep this pair on your watchlist and see if the rules of your strategy are satisfied. Please also refer to the Important Risk Notice linked below.

STORJ will have another bullish jumpThe structure is still bullish, we only had one bearish CH which indicated that we might reach the important OBs below. The price movement has slowed down and the presence of buyers can be felt a little
storj is approaching a strong support area. We are looking for buy/long positions in the green area.
We marked the targets on the picture
.The stop should be placed somewhere under the green box.
For risk management, please don't forget stop loss and capital management
When we reach the first target, save some profit and then change the stop to entry
Comment if you have any questions
Thank You

Will Santa Deliver Storj Gainz for Christmas?On my wish list for Santa is a little extra cash here for Storj before it takes off! Look at this pattern I've spotted.
Bull Flag. Touch on RSI trendline. Explode! 2.5x Gainz to the top.
Bull Flag. Touch on RSI trendline. Explode! 2.7x Gainz to the top.
Bull Flag. Touch on RSI trendline ...Explode? 3x Gainz this time?
If the pattern repeats, we're looking at 3x gainz to the top at $2.17 which is also a level of resistance I have had drawn on the chart btw.
This would be a longer-term swing trade (like weeks/months). And to hold to the final target would be rather risky without tightening stops that could easily take you out before then. So, if you are not into that, ignore this opportunity.
As soon as I free up some cash from any of my other trades, I'm in.
Best,
Stewdamus

STORJ will grow nearly 1500%It seems that the last correction wave is left from the big D wave. The D wave was a diametric one, and only the g wave remained from this wave. After completing this wave, we can expect storj to enter the big E wave. I specified the support area and targets.
For risk management, please don't forget stop loss and capital management
When we reach the first target, save some profit and then change the stop to entry
Comment if you have any questions
Thank You

STORJ Flat Correction Has EndedIn my point of view STORJ has played a flat correction from the begining and now it has ended. It can reach 10$ area and above in the coming bull market easily

STORJ/USDT Short with Bitxer: Crafting Success in Bearish Waters🔥 Bitxer's Free Trading Signal 🔥
Symbol: STORJ/USDT
Position: Short
💰 Wallet Allocation: (30-40%)
🎯 Targets:
1. 0.6732
2. 0.6441
3. 0.5672
4. 0.4917
🛡️ Stoploss: 0.7832
📈 Disclaimer: I am not a financial advisor. This analysis is for informational purposes only. Enjoy these free signals and trade responsibly.
Happy trading and good luck, Bitxer! 🚀📊🤞

STORJ/USDT upward momentum? 👀 🚀 STORJ Today analysis💎 Paradisers, brace yourselves as STORJUSDT showcases intriguing dynamics, operating within a demand zone and hinting at the potential to challenge overhead resistance levels.
💎 A recent observation reveals its successful breakout from a descending channel, setting its course upwards. The initial expectation is for the asset to approach the supply zone at 0.4991. Should it surpass this level, the odds significantly favor a push towards the resistance at 0.6053.
💎 On the flip side, if the asset struggles to maintain its current momentum, there's a likelihood of a bullish resurgence from the .3848 level. However, a breach below this marker might steer the trajectory downwards.

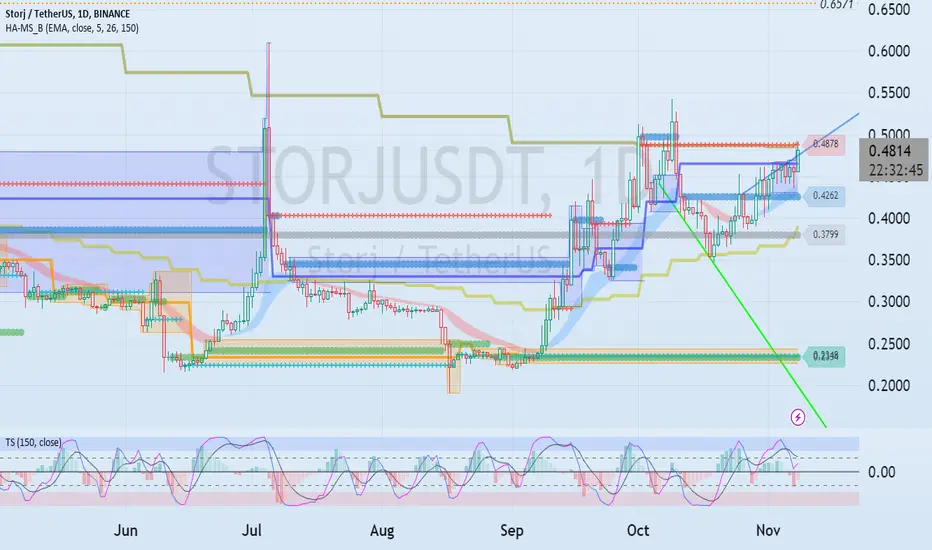
The key is whether it can rise above 0.4878 and receive supportHello traders!
If you "Follow" us, you can always get new information quickly.
Please also click “Boost”.
Have a good day.
-------------------------------------
(STRJUSDT chart)
If it receives support in the 0.4292-0.4878 range and rises, it is expected that a full-fledged upward trend will begin.
(1W chart)
However, a rapid upward trend is expected to begin when the box range of 0.6939-3.1133 is shortened and a new box range is formed.
Therefore, it is expected that the price will rise above 0.4878 and shake up and down, creating a new HA-High indicator.
(1D chart)
If it rises above 0.4878 and becomes supported, the first support and resistance area is expected to be around 0.6571-0.7225.
--------------------------------------------------
- The big picture
The full-fledged upward trend is expected to begin when the price rises above 29K.
This is the section expected to be touched in the next bull market, 81K-95K.
-------------------------------------------------- -------------------------------------------
** All explanations are for reference only and do not guarantee profit or loss in investment.
** Trading volume is displayed as a candle body based on 10EMA.
How to display (in order from darkest to darkest)
More than 3 times the trading volume of 10EMA > 2.5 times > 2.0 times > 1.25 times > Trading volume below 10EMA
** Even if you know other people’s know-how, it takes a considerable amount of time to make it your own.
** This chart was created using my know-how.
---------------------------------
STORJUSDTBINANCE:STORJUSDT Long idea
⛔"Daily crypto market analyses I provide are personal opinions & not financial advice. Trading carries risks, so do your own research & seek advisor's help.#DYOR"
Don't forget to like and comment

STORJ long setupHi, dear traders. how are you ? Today we have a viewpoint to BUY/LONG the STORJ symbol.
For risk management, please don't forget stop loss and capital management
When we reach the first target, save some profit and then change the stop to entry
Comment if you have any questions
Thank You
STORJ 1H Analysis with Influences from 1D Fibonacci LevelsIn the STORJ 1-hour chart, a clear bearish trend is evident. While the provided technical indicators from the 1H chart mainly signal bearish momentum, the 1D Fibonacci levels could play a pivotal role in potential bounce-backs or resistance areas.
Analysis:
Fibonacci Levels (from 1D):
The current price of STORJ in the 1H chart is approaching the 0.5 level at 0.3669. This could act as a significant support, and if the price respects this level, we could expect some buying pressure here.
Should the price continue its downward momentum, the next major support would be at the 0.618 level (0.3253).
On the upside, the 0.382 level at 0.4084 might act as resistance if the price were to rebound.
Stochastic Oscillator: Given its oversold position, this suggests a potential pullback or temporary reversal might be imminent, which aligns well with the approaching Fibonacci support at 0.3669.
Bollinger Bands and MACD: Both indicators continue to indicate bearishness in the short term.
Most Probable Scenario:
The STORJ price is likely to continue its bearish trend in the short term. However, the 1D Fibonacci level at 0.3669 could act as a strong support. If the price respects this level, we might see a bounce-back or consolidation around it. If it breaks through, the next target would be the 0.618 level at 0.3253. Conversely, if a rebound happens, the 0.382 level at 0.4084 will act as a key resistance.
Conclusion:
While the STORJ 1H chart indicates a bearish momentum, the 1D Fibonacci levels can provide key areas of interest for potential reversals or consolidation. It's essential for traders to monitor these levels closely for any signs of price reversal or continued momentum.

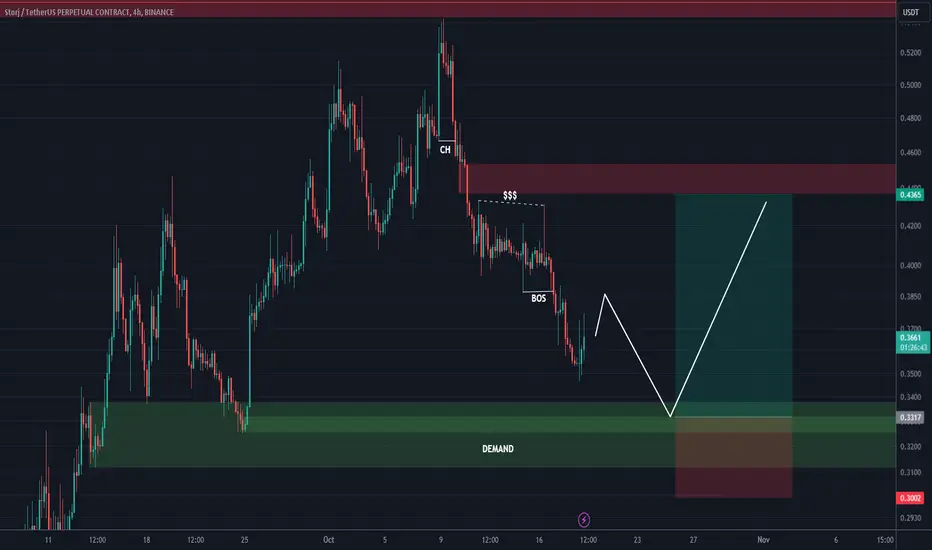
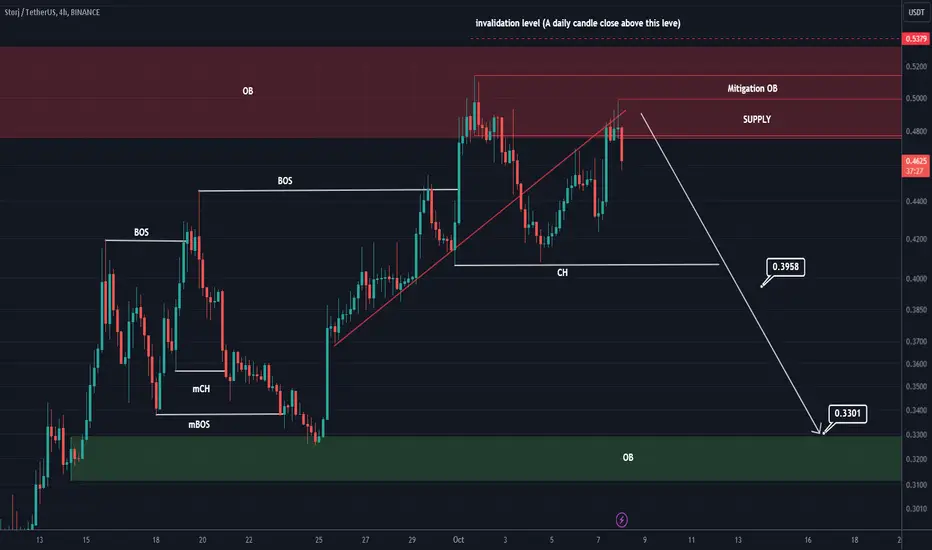
STORJ is close to dropStorj has been stuck in a resistance zone for a long time.
Now a trend line has been broken and the price hit it in the resistance zone and some new resistance zones that you can see on the chart with the names of mitigation OB and supply.
In my opinion, storj can move towards two announced targets from here.
I specified the invalidation level, closing 1 Daily candles above this level will violate the analysis
For risk management, please don't forget stop loss and capital management
When we reach the first target, save some profit and then change the stop to entry
Comment if you have any questions
Thank You
STORJUSD Golden Cross formed but 1 year Resistance looms.STORJUSD is on a Channel Up approaching Resistance Zone (1).
There is high symmetry on the crypto's legs as this rise is coming off a Support Zone (2) hold.
The Golden Cross (1d) that has just been formed is technically bullish but needs a crossing over Resistance Zone (1).
Trading Plan:
1. Buy if, after a (1d) candle closes above Resistance Zone (1), the price pulls back near the MA50 (1d).
2. Sell if, after the price hits Resistance Zone (1) and fails to break higher, closes a (1d) candle under the MA50 (1d).
Targets:
1. 0.7700 (Resistance 2).
2. 0.3000 (Support 1)
Tips:
1. The RSI (1d) is on the same Channel Down as Jan-Feb 2023, which was when the price was in an identical Channel Up as now. Favors shorting.
Please like, follow and comment!!


STORJUSDTBINANCE:STORJUSDT long 15% potential
⛔"Daily crypto market analyses I provide are personal opinions & not financial advice. Trading carries risks, so do your own research & seek advisor's help.#DYOR"
Don't forget to like and comment

Will STORJ remain bullish?STORJ has been bullish for several days.
It has hit an important node, which is the origin of the downward movement.
It has a high chance of downward rejection.
I am looking for SELL/SHORT positions in the lower red box.
A daily candle close above 0.4444 will violate this analysis
For risk management, please don't forget stop loss and capital management
When we reach the first target, save some profit and then change the stop to entry
Comment if you have any questions
Thank You

The key is whether it can be supported above 0.3799Hello?
Hello traders!
If you "Follow" us, you can always get new information quickly.
Please also click “Boost”.
Have a good day.
-------------------------------------
(STORJUSDT chart)
(1M charts)
The key is whether the price can be maintained by rising above 0.4292.
(1W chart)
The key is whether it can receive support around 0.3457 and rise.
When rising
1st: 0.4420
2nd: 0.8409
We need to check whether we can receive support around the first and second rounds above and continue the upward trend.
(1D chart)
The 0.3799 point is an important volume profile section.
Therefore, the key is whether the price can be maintained by rising above 0.3799.
To do this, we need to make sure that the price can be maintained above the HA-High indicator.
Currently, the HA-High indicator is formed at 0.3301 and is showing signs of forming at 0.3382.
Accordingly, it is necessary to maintain the price around 0.3301-0.3382 or higher and then check if it rises above 0.3799.
Since there are no strong support or resistance points above 0.3799, caution is required as rapid movements can occur in an instant.
If you respond by selling in short installments, you are expected to get good results.
-------------------------------------------------- -------------------------------------------
** All explanations are for reference only and do not guarantee profit or loss in investment.
** Trading volume is displayed as a candle body based on 10EMA.
How to display (in order from darkest to darkest)
More than 3 times the trading volume of 10EMA > 2.5 times > 2.0 times > 1.25 times > Trading volume below 10EMA
** Even if you know other people’s know-how, it takes a considerable amount of time to make it your own.
** This chart was created using my know-how.
---------------------------------

Storj price pumping. What next ?Over the past two weeks, the price of STORJUSDT has increased by +180%.
Why they decided to pump this particular coin is a mystery to us, it's just an old, unremarkable project.
But if you know something more, please write about it in the comments.
But there is one regularity: a year ago, in mid-June, there was a similar STORJ pump, followed by a long price drop with a new low.
We believe that this year's STORJ price will not update its low more. However, the chance to participate in the pumping and make money on it has already been missed, as the price has been pushed too high without a thorough good correction.
The probability that STORJUSDT may face a protracted and exhausting correction with a final target of $0.275-0.32 is quite high, this is -40%.
And then everyone decides for themselves what to do with the information we have shared)
_____________________
Did you like our analysis? Leave a comment, like, and follow to get more
