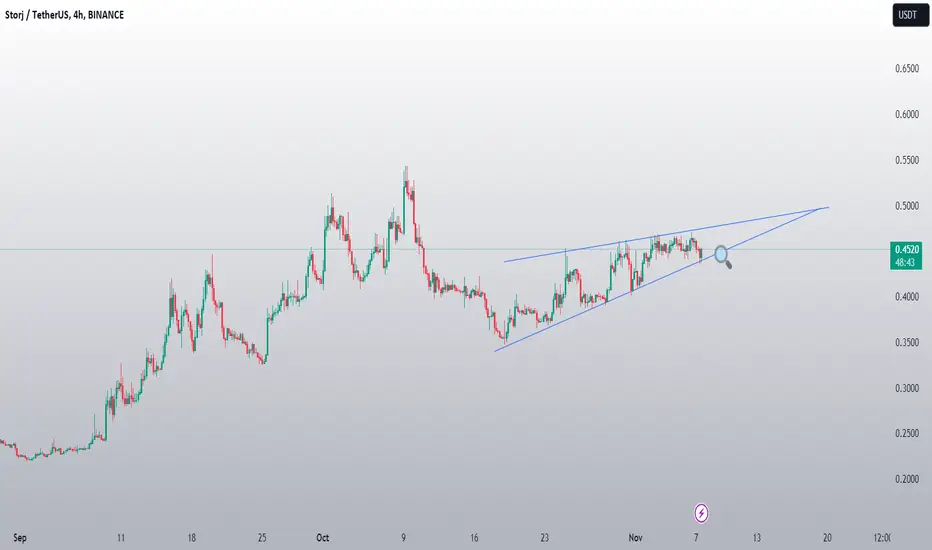
#STORJIn the continuation of the STORJ currency analysis, according to the pullback to the broken trigger, you can enter a buy position with a risk to reward of 1 to 4.
STORJUSDT

STORJ / USDTStorj has successfully broken out, signaling a potential move towards the $0.90 area. The current price presents a favorable entry point. The stop loss should be set if the daily candle closes within the trendline.

STORJUSDT.4HBased on the given market data, the STORJ/USDT pair is currently in a bullish trend, as indicated by the RSI (Relative Strength Index) values for 4h, 1d, and 7d which are above 50. This suggests that the currency is being heavily bought in the market.
The MACD (Moving Average Convergence Divergence) values for 4h, 1d, and 7d are positive, indicating upward momentum. The Bollinger Bands for 4h, 1d, and 7d are above the current price, suggesting that the price is in the lower range, which could indicate a potential upward movement in the future.
The price is currently above the support levels on all timeframes (4h, 1d, and 7d) and below the resistance levels, which means it has room to grow before encountering resistance.
However, it's important to consider that the RSI on the 7d is slightly high at 76.39, indicating that the currency might be overbought in the market and could face a price correction soon.
In conclusion, the STORJ/USDT pair seems to be bullish in the short term with a potential for a price correction due to the high RSI on the 7d timeframe. It's always important to consider other factors and market news before making any investment decisions.

STORJ Flat Correction Has EndedIn my point of view STORJ has played a flat correction from the begining and now it has ended. It can reach 10$ area and above in the coming bull market easily

STORJ-USDT NEW INCREASE LEVELThank you for reading this update. Please remember that this is not advice
Depending on our study we see that STORJ has a good chance of volume increase.
This update depends on the day trading, the price action can increase in the coming time, and the market will show which targets this coin can increase.
* This updates depending on day trade, and it's possible that we can see an increase, and after that a return since it's crypto.
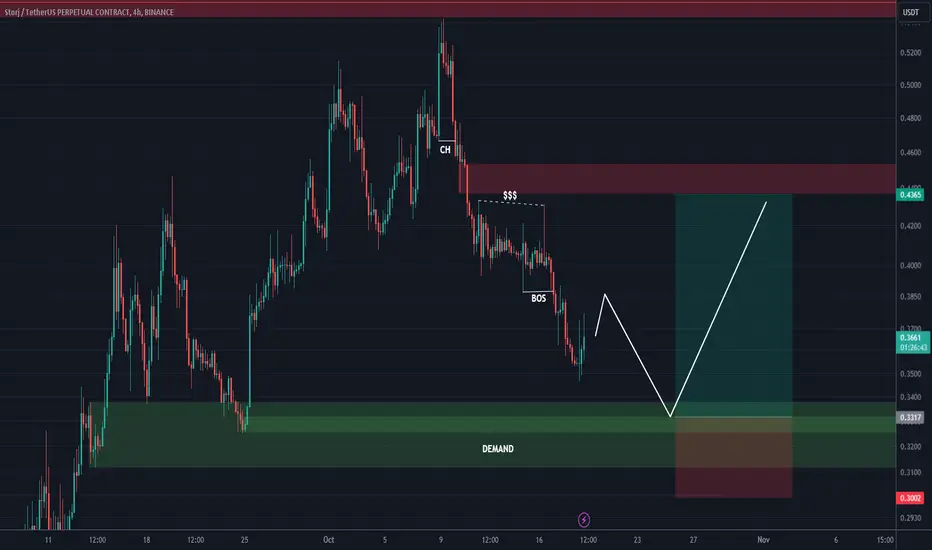
#STORJ Wait For ReactionIt seems to have completed the cycle.
It can have two movements to continue correction.
If confirmed, the sell position can be entered up to the green area and the specified profit limit.

3-TOP FOR REVERSEThe best area that can be considered for selling is after the formation of three consecutive ceilings, after which you can proceed to sell from the ceiling.

STORJ/USDT Short with Bitxer: Crafting Success in Bearish Waters🔥 Bitxer's Free Trading Signal 🔥
Symbol: STORJ/USDT
Position: Short
💰 Wallet Allocation: (30-40%)
🎯 Targets:
1. 0.6732
2. 0.6441
3. 0.5672
4. 0.4917
🛡️ Stoploss: 0.7832
📈 Disclaimer: I am not a financial advisor. This analysis is for informational purposes only. Enjoy these free signals and trade responsibly.
Happy trading and good luck, Bitxer! 🚀📊🤞

STORJ/USDT upward momentum? 👀 🚀 STORJ Today analysis💎 Paradisers, brace yourselves as STORJUSDT showcases intriguing dynamics, operating within a demand zone and hinting at the potential to challenge overhead resistance levels.
💎 A recent observation reveals its successful breakout from a descending channel, setting its course upwards. The initial expectation is for the asset to approach the supply zone at 0.4991. Should it surpass this level, the odds significantly favor a push towards the resistance at 0.6053.
💎 On the flip side, if the asset struggles to maintain its current momentum, there's a likelihood of a bullish resurgence from the .3848 level. However, a breach below this marker might steer the trajectory downwards.

#STORJ/USDT 12h (ByBit) Small rising wedge near breakdownStorj is about to print an evening star, could lead to a leg down to 200MA support.
⚡️⚡️ #STORJ/USDT ⚡️⚡️
Exchanges: ByBit USDT
Signal Type: Regular (Short)
Leverage: Isolated (3.8X)
Amount: 5.0%
Current Price:
0.4425
Entry Targets:
1) 0.4455
Take-Profit Targets:
1) 0.3515
Stop Targets:
1) 0.4925
Published By: @Zblaba
$STORJ BYBIT:STORJUSDT.P #Storage storj.io
Risk/Reward= 1:2.0
Expected Profit= +80.2%
Possible Loss= -40.1%
Estimated Gaintime= 1-2 weeks

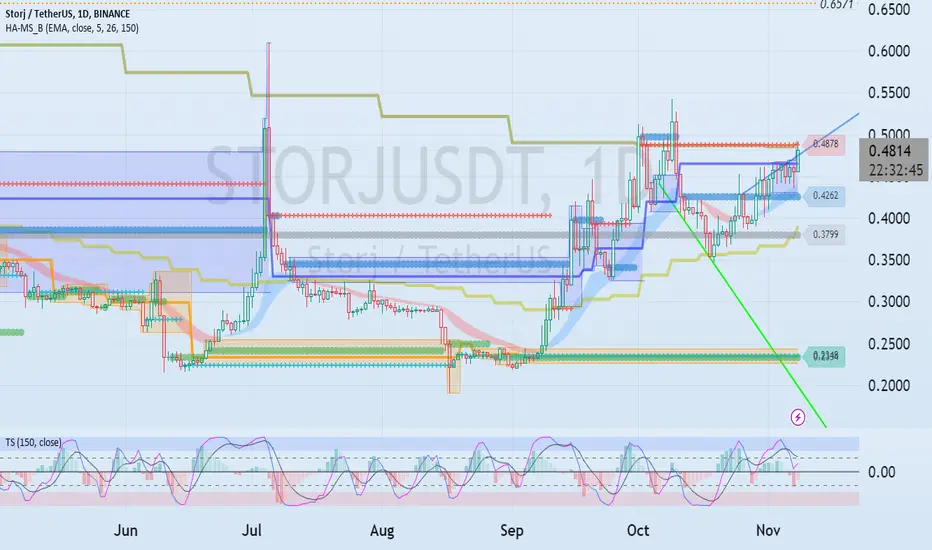
The key is whether it can rise above 0.4878 and receive supportHello traders!
If you "Follow" us, you can always get new information quickly.
Please also click “Boost”.
Have a good day.
-------------------------------------
(STRJUSDT chart)
If it receives support in the 0.4292-0.4878 range and rises, it is expected that a full-fledged upward trend will begin.
(1W chart)
However, a rapid upward trend is expected to begin when the box range of 0.6939-3.1133 is shortened and a new box range is formed.
Therefore, it is expected that the price will rise above 0.4878 and shake up and down, creating a new HA-High indicator.
(1D chart)
If it rises above 0.4878 and becomes supported, the first support and resistance area is expected to be around 0.6571-0.7225.
--------------------------------------------------
- The big picture
The full-fledged upward trend is expected to begin when the price rises above 29K.
This is the section expected to be touched in the next bull market, 81K-95K.
-------------------------------------------------- -------------------------------------------
** All explanations are for reference only and do not guarantee profit or loss in investment.
** Trading volume is displayed as a candle body based on 10EMA.
How to display (in order from darkest to darkest)
More than 3 times the trading volume of 10EMA > 2.5 times > 2.0 times > 1.25 times > Trading volume below 10EMA
** Even if you know other people’s know-how, it takes a considerable amount of time to make it your own.
** This chart was created using my know-how.
---------------------------------
STORJ sell setupyou can setup short position on STORJ/USDT
OPEN: 0.375
Target: 0.36
LEV: 10X to 25X
Capital: 25% off all capital
OK?

STORJUSDTBINANCE:STORJUSDT Long idea
⛔"Daily crypto market analyses I provide are personal opinions & not financial advice. Trading carries risks, so do your own research & seek advisor's help.#DYOR"
Don't forget to like and comment

STORJ long setupHi, dear traders. how are you ? Today we have a viewpoint to BUY/LONG the STORJ symbol.
For risk management, please don't forget stop loss and capital management
When we reach the first target, save some profit and then change the stop to entry
Comment if you have any questions
Thank You
STORJ 1H Analysis with Influences from 1D Fibonacci LevelsIn the STORJ 1-hour chart, a clear bearish trend is evident. While the provided technical indicators from the 1H chart mainly signal bearish momentum, the 1D Fibonacci levels could play a pivotal role in potential bounce-backs or resistance areas.
Analysis:
Fibonacci Levels (from 1D):
The current price of STORJ in the 1H chart is approaching the 0.5 level at 0.3669. This could act as a significant support, and if the price respects this level, we could expect some buying pressure here.
Should the price continue its downward momentum, the next major support would be at the 0.618 level (0.3253).
On the upside, the 0.382 level at 0.4084 might act as resistance if the price were to rebound.
Stochastic Oscillator: Given its oversold position, this suggests a potential pullback or temporary reversal might be imminent, which aligns well with the approaching Fibonacci support at 0.3669.
Bollinger Bands and MACD: Both indicators continue to indicate bearishness in the short term.
Most Probable Scenario:
The STORJ price is likely to continue its bearish trend in the short term. However, the 1D Fibonacci level at 0.3669 could act as a strong support. If the price respects this level, we might see a bounce-back or consolidation around it. If it breaks through, the next target would be the 0.618 level at 0.3253. Conversely, if a rebound happens, the 0.382 level at 0.4084 will act as a key resistance.
Conclusion:
While the STORJ 1H chart indicates a bearish momentum, the 1D Fibonacci levels can provide key areas of interest for potential reversals or consolidation. It's essential for traders to monitor these levels closely for any signs of price reversal or continued momentum.

STORJ Double top neckline broken STORJ UPDATE: In my last update about STORJ rising wedge…. STORJ broke it down and headed for the support… As we can see that STORJ broke the 4hrs TF neckline support of the double top that was created and consolidating below it which is preparing for now downside movement to mitigate the strong support at 0.344
Good to take a short entry at CMP tor the follow Targets below 👇
0.3886
0.3689
0.3440
Manage your risk and don’t be greedy
Follow for more market update or chat me up

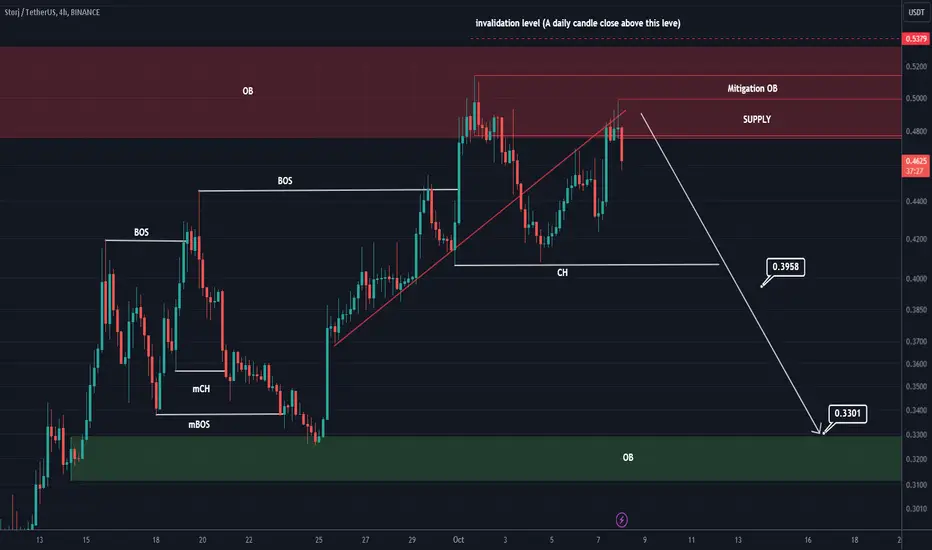
STORJ is close to dropStorj has been stuck in a resistance zone for a long time.
Now a trend line has been broken and the price hit it in the resistance zone and some new resistance zones that you can see on the chart with the names of mitigation OB and supply.
In my opinion, storj can move towards two announced targets from here.
I specified the invalidation level, closing 1 Daily candles above this level will violate the analysis
For risk management, please don't forget stop loss and capital management
When we reach the first target, save some profit and then change the stop to entry
Comment if you have any questions
Thank You
Analyzing STORJ: Spotting Prominent Levels and Planning BreakoutIn this analysis, we will delve into the price action of the cryptocurrency Storj (STORJ) utilizing 1-hour and 5-minute time frame charts.
On the 1-hour chart, we've identified several notable levels, with a specific focus on the level 0.4077. This level was chosen due to its significance, having been tested twice, making it a key point for analysis. We plan to enter a position upon a downside breakout of the 0.4070 level as it approaches. It's essential to note that the approach to this level should be gradual, and it's preferable to observe trading activity in this area before making a trading decision.
A similar approach is applied on the 5-minute chart, where the mentioned levels are also visible. Analyzing on a shorter time frame provides additional clarity for more precise trade planning.

STORJ/USDT Ready for Potential Correction? STORJ Analysis Today💎Paradisers, focus on STORJUSDT! It's currently moving within an ascending channel, hinting at a possible correction due to the overhead supply zone.
💎In recent times, Storj has been consistently following this ascending trajectory. However, a correction seems imminent. It's worth noting that STORJ will firmly anchor to a significant support level at 0.4282.
💎Below this, there's a clear demand zone accompanied by a Bullish OB. If STORJ dips below the support, it's likely to approach the demand zone highlighted on the chart.
💎Sharpen your trading strategies for STORJ with ParadiseFamilyVIP. Delve into our expert analyses on Storj and other potential tokens, streamlining your crypto journey.

STORJUSDT STORJ LONG OPPORTUNITY OCT 08Signal: Yellow -> Lime
Context: Green * n
Structure Break out
Assumption: BTCUSDT holds 27100
Risk-Reward: 2
DISCLAIMER
This is only a personal opinion and does NOT serve as investing NOR trading advice.
Please make your own decisions and be responsible for your own investing and trading Activities

STORJ/USDT Crucial Zone, Break the strong resistance or Down ??💎 STORJ has certainly caught our attention. Despite its repeated attempts to breach the formidable resistance zone, STORJ has often faced setbacks, plunging sharply. However, the current chart formation appears promising, with a bullish trend evident on the hourly timeframe. This suggests that STORJ might soon overcome this persistent resistance.
💎 Yet, if STORJ faces another rejection upon encountering the robust resistance, it might retreat to its local support to gather momentum for another upward push. It's crucial for STORJ to rebound swiftly from this support.
💎 Prolonged sideways movement at this level might sap its momentum, risking a dip below the support. Should this occur, STORJ could gravitate towards the demand zone between $0.315 and $0.336, a region with substantial strength to support the asset.
💎 However, if even this demand zone fails to hold back the sellers, STORJ might plummet to a more robust support level or even further.


STORJ is testing a major resistance...This futures pair is currently testing a strong resistance at around $0.41. If the level is able to hold like the previous times, we could see a drop to testt the last lows of the structure...
