Looking for feedback on possible Elliot waveI'm publishing this for constructive criticism. I realize the quick run up in price may be considered an anomaly but it may also be the 3rd wave of an Elliot wave. Not sure how deep a retrace to expect of the current wave 4 we would be in, but 600 sats. seems to be holding. Potential breakout of this wedge in around 8 hours. Looking to be educated so please be forthcoming with the feedback.
STORMBTC

STORM - Reminds me of ADA's first chart
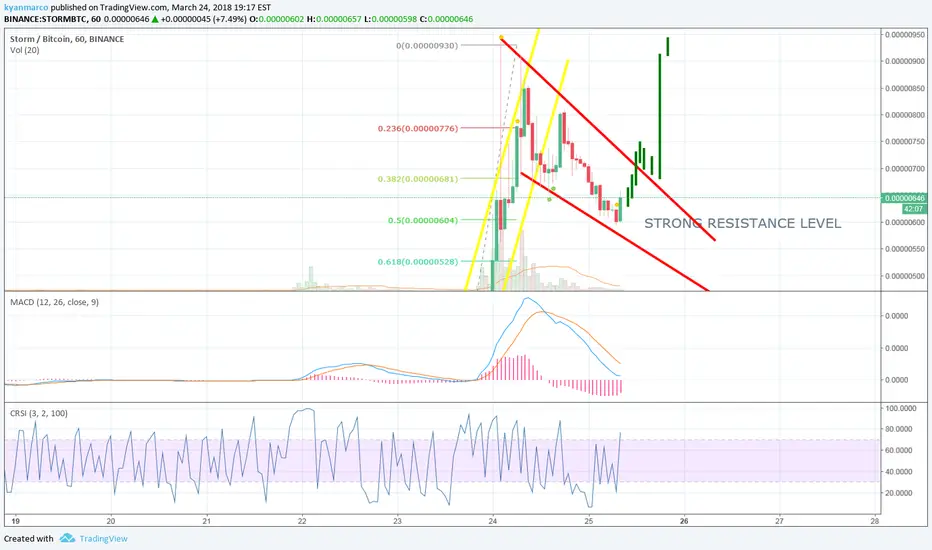
Similar chart to ADA, with be sweeping lines, getting a 2.618 extention on wave 3 is quite impressive. I would imagine a 1:1 on previous level is possible. If this were an impulse wave than a 1.618 would be more realistic. I put a little in at the .5 retracement (.00000596) looking to sell 75% at .00000750


$storm update$storm update: good call. 300% up since entry. Crazy profit. I think it should end the 5th wave so we are going towards 900/1000 sats in the next days. It could recover a bit but I'll hold. $storm is mooning

STORMBTCStorm had a big pump yesterday I couldn't notify this trade because we are not trading by jumping into the top of the price. I could recommend to buy the pullback where by you can look at the chart and if it test that red line it will be a buy and enjoy the profits. But if it will go lower the red line which is a moving average I may be a little bearish into this trade. Obvious it should bounce from the bounce line and go high again.

A perfect STORMAll indicators are greenlit. This is the perfect STORM. Uptrend now official!
- MACD approaching zero, a very good sign. Will be excellent when MACD goes above zero.
- MAs 20, 50 and 100 are broken. Price is currently trading above these Moving Averages.
- My favorite public indicator is showing bulls strength.
This is basing on 2H chart.

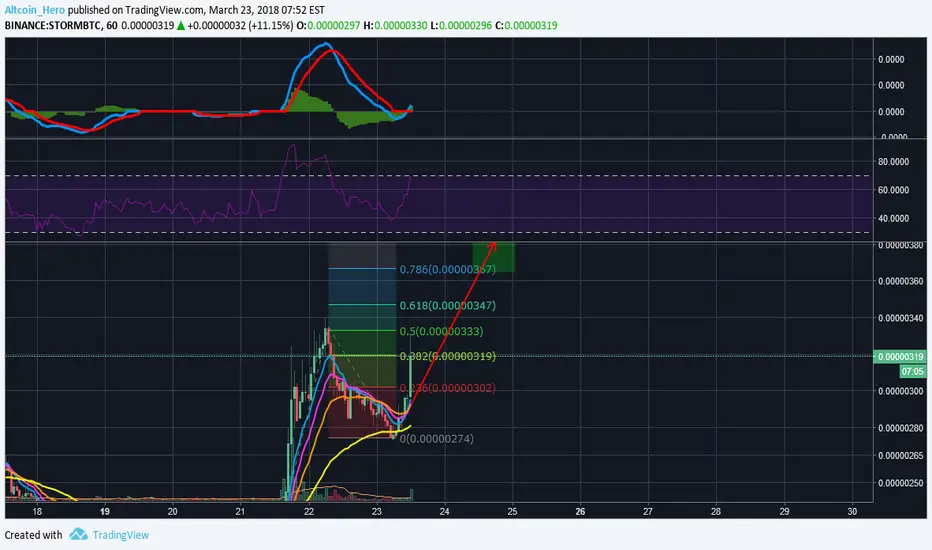
Storm seems to be going for wave 3 upwards. Target around 400.Based on elliot wave theory and fibonacci we can see that the first wave was done around 335 satoshis. The second wave retraced back towards around 275 satoshis. According to the elliot wave theory wave 3 is the longest and will be at least 1:1 with wave one. Using fibonacci extensions around 275 satoshis this will bring us up to around 400 satoshis.
What do you think? Please leave any comments below and show others what you think.
Silence Before The Storm Bearish Shark Pattern
D leg around 280 sats - 295 sats
All indicators positive


Lets Hope The Sun Shines!Here we have a new coin new chart new opportunity. Storm is the coin, charts looks good and slowly developing into what we want to see to make us some cash!
We have a bullish divergence but we are not ready to enter this coin yes due to the below, but we will prepare ourselves now.....
Ok so the chart tells us that we look to break high but we face resistance and it may be a day or 2 until we see the move.
When we cross the 50EMA we will have aggressive traders buying even based off the 1H chart, but we will be conservative. We need the volume MA to come down a little lower and have volume return into this coin before we even think about breaking.
We do not buy or enter this trade until we see a candle close over the blue line at this point we can enter. This is a trade we need to monitor before we can place a stop loss as the stop loss will be 1% below the blue line but we can't set this until the first 4H candle closes over the blue line. So you monitor this trade on the 4H charts after entering.
We expect a good day or 2 before we see an entry but its best I post this now so you can watch this trade develop.
Being a new coin we are always caution on entry and please be patient.
Cash Is King! We Love it, we need it so come join us and earn it!
