Backtesting Settings For the Logical Trading Indicator V.1Since creating the Logical Trading Indicator, my trading game has changed in a big and positive way. But I have been curious as to how I can make an automated strategy with it and how much it makes. The Logical Trading Indicator has many different signals and alerts that you can use to create your own trading strategies that work best for your trading plan.
Over the weekend, I have been tinkering around with the base strategy of buy when I get a buy signal and sell when i get a sell signal. I have played around with both a long and short strategy mainly focusing on the BTCUSD pairing. I am really doing this to help me find the best settings possible for each time frame and letting the strategy do the backtesting for me. This really helps me to figure out how it does over the past year or so. So far, at least for BTC, a LONG only strategy has yielded the best results. Mainly because I couldn't get it to fire shorts the way I wanted it to. This is where machines still need some human guidance, as well as your trades, haha.
Dialing It In
What I am doing is going into different timeframes and finding the best settings for the ATR multiple and length in combination with basis length and the long period moving average. I have been recording the results primarily on the 5 minute as well as the 1 HR and 4 HR time frames because those are the main time frames I focus on.
I have played around with different variations of functions, but TradingView can't seem to get things to fire on the strategy the same way I can get the main indicator to fire. But based on this, I set the strategy to a simple LONG only strategy where it buys when you get a BUY signal and then closes when you get a SELL signal, with the addition of a stop loss function that let's me set a stop loss percentage to provide some additional risk management to help with the drawdown percentage.
In this backtest, the strategy was not taking the 'Take Profit' signals into account, or when I tried to include them in the logic, they weren't firing properly, so I kept it simple with just the BUY and SELL signals with a stop loss. If you used the built in take profit signals, you can do even better than these results.
On the 5 minute time frame, the most profitable settings ended up being:
ATR Multiple: 3
ATR Length: 1
Basis Length: 15 EMA
Long Period Moving Average: 50 SMA
These settings yielded over 100% profit for the backtesting period, which is about a year.
For the 1 HR time frame, the winning settings were:
ATR Multiple: 3
ATR Length: 6
Basis Length: 20 EMA
Long Period Moving Average: 100 SMA
These settings yielded over 200% profit for the backtesting period with almost 60% win rate! Again, you could maximize this even more by utilizing the take profit signals and using short trades when the trend is right and if you are trading on a futures exchange. I have been doing more spot trading on DEXs lately, so I have been trading long only lately.
The Importance of Backtesting
I cannot stress this enough, you have to back test your strategies to make sure they are going to be profitable. This can be done manually by going back in time on the charts and finding all of your signals and seeing if it was profitable, or you can create your own strategy like this using TradingView's Pinescript and let the program do the backtesting for you.
However you do your backtesting, just make sure it gets done! You don't want to just think an indicator or a strategy works, you want to KNOW it works! If not, you could be throwing your money down the drain.
This is Only A Test- But Great For Info Gathering
I am only using this strategy for my own backtesting purposes, not publishing it. I simply used one part of the strategy that is built into the Logical Trading Indicator, and it honestly doesn't properly utilize multiple options for exits as far as the automated strategy goes. I know that if I use these settings, but also use my built in take profit signals, I can do much better than these results are showing.
What is great about this is you can see the performance and find trades that you wouldn't have taken in the first place, or entries and exits that could have been done better by trading manually. For example, after looking at the list of trades, I saw several trades I would have either gotten out of for better profit using the take profit signals, or trades I wouldn't have taken in the first place due to consolidation or accounting for the larger trend.
When trying to program some of the other functions from the main indicator, TradingView would freak out on me a bit and not want to provide any results, or results that just didn't make any sense. But that is all a part of the process. It helps you figure out that the machines don't always have it right, and that having just a bit of 'human' in your trades can make your performance even better than the strategy suggests!
Living That Trader Life
This is the life of a good trader, at least in my opinion. Based on my trading plan, I do not trade on the weekends, even though the crypto markets are open, it isn't always the best time to trade. I like to take this time to go over my trading journal to see where I can improve, perfect my strategies, and hone in on the things I need to work on to get better.
What this development work does for me is show me that automated trading is great, but with the combination of a great indicator that can produce trading alerts, and my own trader's intuition, I can give the markets a serious beating and come out with some amazing gains, as long as I stick to the plan, as well as trade manually with the signals! This helps me keep the emotions out of the game and let's me use the data with the correct settings to make the best decisions possible in my trades for the biggest gains! So get out there and do some backtesting on your favorite strategies to see if you really are trading logically!
Strategy!

MANU Manchester United Options Ahead of EarningsIf you haven`t bought MANU before hitting the previous price target:
Then analyzing the options chain and the chart patterns of MANU Manchester United prior to the earnings report this week,
I would consider purchasing the 14usd strike price Puts with
an expiration date of 2024-6-21,
for a premium of approximately $1.03.
If these options prove to be profitable prior to the earnings release, I would sell at least half of them.

HOW-TO use the Fundamental Strength Indicator? (full guide)Below is the complete instruction on how to use the Fundamental Strength Indicator .
Part 1: The Fundamental Strength of the Company
To understand what it is for, let's imagine that you manage a long-distance running team, and you need to recruit a team of excellent athletes. However, you don’t even know the names of these athletes or their contract amounts. You only have information about their health and athletic performance: hemoglobin and iron content in the blood, maximal oxygen consumption, steps-per-minute rate, speed, age, etc. Each player has their own large table with different parameters. And you have, let’s say, a thousand tables like that.
If you spend 3 minutes studying one table, it will take you 50 hours to analyze all the tables, which is just over 2 days of continuous work. And how long would it take to compare each athlete with the rest? Approximately 2 years of continuous work.
This is obviously no good, that is why you take a computer, enter all the data from the tables and start thinking about how you can reduce the time to compare one athlete with another. As a result of your brainstorming, you come to the following conclusions:
— Each parameter has its range of values, which can give you an idea of whether an athlete is suitable or not suitable for a marathon.
— The parameter may have its dynamics: it may increase from month to month, stay the same, or decrease.
— Each parameter can be assigned a score.
For example, the step-per-minute rate can be:
— 175 and above (+1 point)
— 165–174 (0 points)
— 164 and below (-1 point)
And you do that with each parameter.
What are these points for? To convert indicators that use different units into one measurement system. Thanks to this method, you can now compare apples to oranges.
Then, you sum up all the points per month and get one single number — let's call it athletic strength. You like your thought process, and you apply this algorithm to every athlete’s table.
Now, instead of dozens of parameters per month, you have one number (athletic strength) for each athlete. It looks like your task has been dramatically simplified. Next, to study the dynamics of athletic strength from month to month, you “ask” your computer to create a plot for each of the athletes.
This chart shows that Athlete #1's athletic strength has fluctuated chaotically in the first three quarters of 2022, possibly due to the lack of regular training. But then you observe a positive trend, where athletic strength has grown from month to month. It seems like the athlete has taken up training.
Then, to compare one athlete with another, you “ask” your computer to add the average value of athletic strength over the past six months (average pre-competition training period) to the existing plot. Now, you can use the most average recent value as a weighted score of athletic strength and compare athletes with each other based on this value.
Thanks to this solution, you accelerate the analysis process by a magnitude: one athlete – one number. It appears that you can then simply sort the table by the highest athletic strength weighted score and consider the best athletes. However, not wanting to sort the table every time the data is updated or when you get new athletes, you make a better decision.
The logic behind the points system implies that there is a maximum and a minimum possible number of points that one athlete can get. This allows you to create ranges of scores for athletes with excellent, mediocre, and poor training.
For example, let’s say the maximum is 15 and the minimum is -15. Athletes with a score of 8 to 15 will be considered as strong, 1 to 7 – mediocre, and 0 to -15 – weak.
That’s it! Now, thanks to this gradation, you can simply check which range the weighted athletic strength falls within, and decide whether each athlete will be admitted to the team.
I believe that now your primary selection will take no more than one working day (including a lunch break).
Now let's mentally replace athletes with public companies. Instead of data on health and athletic performance, we will have data from the companies’ financial statements and financial ratios.
Applying a similar algorithm, we will get the fundamental strength of the company instead of athletic strength.
I think it's time to show the Fundamental Strength Indicator . Let's launch! What do we see?
— First, it is a Histogram with bars of three colors: green, orange, and red. The width of the histogram depends on the depth of data from the company statements. The more historical data, the wider the histogram over time.
The green color of the bars means that the company has been showing excellent financial results by the sum of the factors in that period. According to my terminology, the company has a “strong foundation” during this period. Green corresponds to values between 8 and 15 (where 15 is the maximum possible positive value on the sum of the factors).
The orange color of the bars means that according to the sum of factors during this period the company demonstrated mediocre financial results, i.e., it has a “mediocre foundation” . Orange color corresponds to values from 1 to 7.
The red color of the bars means that according to the sum of factors in this period of time, the company demonstrated weak financial results, i.e., it has a “weak foundation” . The red color corresponds to values from -15 to 0 (where -15 is the maximum possible negative value on the sum of factors).
— Second, this is the Blue Line , which is the moving average of the Histogram bars over the last year (*). Averaging over the year is necessary to obtain a weighted estimate that is not subject to medium-term fluctuations. It is by the last value of the blue line that the actual Fundamental Strength of the company is determined.
(*) The last year means the last 252 trading days, including the current trading day.
— Third, these are operating, investing, and financing Cash Flows expressed in Diluted net income. These flows look like thick green, orange, and red lines, respectively.
— Fourth, this is the Table on the left, which shows the latest actual value of the Fundamental Strength and Cash Flows.
Indicator settings:
In the indicator settings, I can disable the visibility of the Histogram, Blue Line, Cash Flows (each separately), and Table. It helps to study each of the parameters separately. It is also possible to change the color, transparency, and thickness of lines.
The movie Moneyball was released in 2011, where Brad Pitt plays the role of Billy Bean, the sports manager of the Oakland Athletics baseball team. With a small budget, he managed to assemble a high-scoring team based on the analysis of player performance. As a result, this approach was applied by other teams in the league, and Billy Bean received massive recognition from the professional community.
Part 2: Benchmark Business Model
One day, when I had already grasped the concept of the Fundamental Strength of a company, I was returning home from vacation. I was in a taxi and the driver was listening to an audiobook. As the drive took longer than an hour, I had nothing to do but listen to the story. I liked the content. It was a fictional novel with a plot centered around the main character named Alex Rogo. He is a manager of one of the three enterprises of the UniCo corporation.
Even though Alex spends all his time and energy on work, things are not going very well for the company: over the past six months, the company has only had losses. This leaves Alex's executives no choice but to give him an ultimatum: if he can’t radically improve the situation in three months, the enterprise will be shut down, and he will be left without a job. At the same time, Alex's wife is tired of her husband’s absence in her personal life, so she decides to leave him. Anyway, the story's beginning turned out to be very dramatic, and I wondered how Alex would cope with all this.
Luckily, in this stressful time, he meets his former physics teacher Jonah, who now consults companies regarding efficient production. Alex tells his old acquaintance about what’s going on and how he managed to increase labor productivity at the enterprise after purchasing new robots. However, the losses continue to hang over his head like the sword of Damocles.
After listening to Alex's story, Jonah wisely suggests that the problem with his enterprise lies in the management is concerned about anything but the main goal of their business, which is creating money or profit. Jonah explains to Alex that all management ideas related to expanding the sales market, using new technologies, or improving product quality can lead the company to a disaster if fundamental things are not considered. In his opinion, management should only focus on three indicators:
— Throughput , which is the rate at which a company makes money through sales.
— Inventory , which is all the money invested by the company in assets: premises, equipment, patents, raw materials, etc.: that is, in something that can then be sold.
— Operational expenses , which are all the money a company spends turning investments into cash, or something that can’t be sold, such as the salary of employees, the cost of rent, payment for delivery services, etc.
Thus, the management’s job is to make improvements that will ultimately lead to an increase in Throughput and a decrease in Inventory and Operational expenses.
For example, Alex’s purchase of robots to increase the number of products produced has led to an increase in production. However, suppose you look at it through the prism proposed by Jonah. In that case, we actually have the following picture: Inventory has increased, Operational expenses have not decreased (no one has been fired), and the robots can’t contribute to sales growth in any way (the Throughput is not increasing). As a result, this was not an improvement, but a deterioration.
The accumulation of such bad decisions eventually leads to the unprofitability of the company. Conversely, continuous improvements that will increase the Throughput and reduce Inventory and Operational expenses will inevitably lead to achieving the main goal – making money.
After I got home, I tried to find this book on the Internet. It turned out that it was written by physicist and philosopher Eliyahu M. Goldratt back in 1984. The novel is called The Goal .
That’s when I realized that if the company's management adheres to the approach described by Goldratt, then after a while, we will most likely see a fundamentally strong company. And the Fundamental Strength Indicator clearly shows how much the management has succeeded along this path.
For example, according to Goldratt, an increase in Throughput should lead to an increase in Earnings per share (EPS) and Total revenue . The reduction in Inventory may be linked with a decrease in Inventory to revenue ratio . Optimization of Operational expenses will definitely reduce the Operating expense ratio . All these parameters are considered when calculating the Fundamental Strength of the company.
So, let's move on to the methodology for calculating the Fundamental Strength Indicator.
The main idea that inspired me to create this indicator is: "Even if you buy just 1 share of a company, treat it like buying the whole business" . Guided by this approach, you can imagine what kind of business an investor is interested in owning and simultaneously determine the input parameters for calculating the indicator.
For me, a benchmark business is:
— A business that operates efficiently without diminishing the return on shareholders' investment. To assess the efficiency and profitability of a business, I use the following financial ratios(*): Diluted EPS and Return on Equity (ROE). The first two parameters for calculating the indicator are there.
— A business that scales sales and optimizes its costs. From this perspective, the following financial ratios are suitable: Gross margin, Operating expense ratio, and Total revenue. Plus three other metrics.
— A business that turns goods/services into cash quickly and does not fall behind on payments to suppliers. The following financial ratios will fit here: Days payable, Days sales outstanding, and Inventory to revenue ratio. These are three more metrics.
— A business that does not resort to significant accounts payable and shows financial strength. Here I use the following financial ratios: Current ratio, Interest coverage, and Debt to revenue ratio. These are the last three parameters.
(*) If you are keen to learn more about these financial ratios, I suggest reading my two articles on TradingView:
Financial ratios: digesting them together
What can financial ratios tell us?
Next, each of the parameters is assigned a certain number of points based on its last value or the position of that value relative to the annual maximum and minimum.
For example, if the Current ratio:
— greater than or equal to 2 (+1 point);
— less than or equal to 1 (-1 point);
— more than 1 but less than 2 (0 points).
Or for example, if Diluted EPS:
— near or above the annual high (+2 points);
— near the annual minimum and below (-2 points);
— between the annual maximum and minimum (0 points).
And so on with each of the parameters. As a result, the maximum number of points a company can score is 15 points. The minimum number of points a company can score is -15 points. These levels are marked with horizontal dotted lines: the green line is for the maximum value, and the red line is for the minimum.
I track the number of points for each day of a company's life on a three-color Histogram. The resulting average value for the last year is on the Blue Line. For me, it is the last value of the Blue Line that determines: this is the actual Fundamental Strength of the company.
As an additional filter, for example, when comparing two companies where all other conditions are equal: I use the dynamics of Cash Flows expressed in Diluted net income. These are the thick green, orange, and red lines over the Histogram.
Examples:
Below, I will evaluate various companies using the Fundamental Strength Indicator.
Tesla, Inc.
The indicator shows that since 2020, Tesla Inc. has been steadily increasing its Fundamental Strength (from 3.27 in Q1 2020 to 12.79 in Q1 2023). This is noticeable both by the color change of the Histogram from orange to green and by the rising Blue Line. If you look in detail at what has been happening with the financials during this time, it's clear what meaningful work the company has done. Revenues have almost quadrupled. Earnings per share have increased 134 times. At the same time, Total debt to revenue fell almost 10 times.
Keurig Dr Pepper Inc.
The company, formed in 2018 by the merger of Keurig Green Mountain and Dr Pepper Snapple Group, has failed to deliver outstanding financial results, causing its Fundamental Strength to fall from 4.63 in Q1 2018 to -0.53 in Q1 2023. During this period, the decline in diluted earnings per share was accompanied by higher debt and deteriorating liquidity.
Costco Wholesale Corporation
Wholesaler Costco has been surprisingly stable in its financial performance and with steady growth in both earnings and revenue. This is the reason the Histogram bars are exceptionally green throughout the calculation of the indicator. The Fundamental Strength has not changed in three years and is high at 11 points.
Part 3: Company Cash Flow Dynamics
The other day I came across an interesting article about the work of the Swiss company Glencore International AG in the 1990s. This company specializes in trading raw materials, and at that time it was actively trading with the countries that had left the USSR. None of those countries had foreign currency, and trust in local currencies had not yet appeared, so it was necessary to exchange commodities for commodities like in the Middle Ages. For example, to sell copper in Kazakhstan, a Swiss company bought raw sugar in Brazil, then took it to Ukraine for refining, then the refined sugar was exchanged for Siberian oil in Russia, then the oil was exchanged for copper ore in Mongolia, which was then sent to a plant in Kazakhstan to create copper suitable for sale on the world market. As we can see, money was used here only at the moment of purchase of raw sugar and sale of copper, the rest of the chain of transactions was an exchange of goods for goods. It turns out the following scheme:
Money - Raw sugar - Refined sugar - Oil - Copper ore - Copper - Money'
Of course, all of this made sense when Money' (with a stroke) equaled big money. Otherwise, the cost of preparing and executing such a complex transaction simply wouldn't have paid off.
This example once again convinced me how significant a role money plays in any company's operations. Can you imagine the chaos that a business can become without money and having to make up similar supply chains? Money simplifies and accelerates all processes in a company, so competent management of these flows is the basis of an effective business.
If you compare a company to a living organism, Cash Flow(*) is its circulatory system. It is thanks to this system that the company is supplied with everything it needs to produce goods or services.
(*) If you are keen to learn more about Cash Flows, I suggest reading my two articles on TradingView:
Cash flow statement or Three great rivers
Cash flow vibrations
Considering that cash flows play a fundamental role in the activity of any company, it is reasonable to assume that their analysis will give us the necessary information to decide.
For this reason, an additional parameter was added to the Fundamental Strength Indicator : the dynamics of Cash Flows expressed in Diluted net income(*).
(*) Since the value of income can be negative, the Diluted net income module is taken, that is, without the "minus" sign.
Why do I use income as a unit of measure of Cash Flows? Because it is a good way to make the scale of indicator values the same for companies from different countries, with different currencies. It also allows you to use a single value scale for both Cash Flows and Fundamental Strength.
So, let's take a look at how the dynamics of Cash Flows look like in the Fundamental Strength Indicator. These are three lines of different colors, which are located over the Histogram. Each of the flows corresponds to a specific color:
— Operating cash flow: green line;
— Investing cash flow: orange line;
— Financing cash flow: red line.
In this way, I can track the dynamics of the company's Cash Flow over time.
To interpret the dynamics of Cash Flows, I pay attention to the following patterns:
— How the cash flows are positioned in relation to each other;
— In which zone each of the cash flows is located: in the positive or negative;
— What is the trend of each of the cash flows;
— How volatile each of the cash flows is.
As an example, let's look at several companies to interpret the dynamics of their Cash Flows.
John B. Sanfilippo & Son, Inc.
This is the most ideal situation for me: operating cash flow (green line) is above the other cash flows, investment cash flow (orange line) is near zero and practically unchanged, and financial cash flow (red line) is consistently below zero. This picture shows that the company lives off its operating cash flow, does not increase its debt, does not spend a substantial amount of money on expensive purchases, and retains (does not sell off) assets.
Parker Hannifin Corporation
With stable operating cash flow (green line), the company implements investment programs by raising additional funding. This is noticeable due to an increase in financial cash flow (red line) and a simultaneous decrease in investment cash flow (orange line) with a significant deepening into negative areas. Apparently, there is not enough operating cash flow to realize the planned investments. One has to wonder how sustainable a company can be if it invests in its development using borrowed funds.
Schlumberger N. V.
The chaotic intertwining of cash flows outside the Fundamental Strength range (-15 to 15) is indicative of the company's rich life, but to me, it is an indicator of high riskiness of its actions. And as we can see, Fundamental Strength has only begun to strengthen in the last year, when the external appearance of cash flow has normalized.
Thus, when the Fundamental Strength of two companies is equally good, I use an additional filter in the form of Cash Flow dynamics. This helps me to clarify my interest in this or that company.
What is the value of the Fundamental Strength Indicator:
— allows for a quantitative assessment of a company's financial performance in points (from -15 to 15 points);
— allows you to visually track how the company's financial performance has changed (positively/negatively) over time;
— allows to visually trace the movement of main cash flows over time;
— accelerates the process of selecting companies for your shortlist (if you are focused on financial results when selecting companies);
— allows you to protect yourself from investing in companies with weak and mediocre fundamentals.
Mandatory requirements for using the indicator:
— works only on a daily timeframe;
— only applies to shares of public companies;
— company financial statements for the last 4 quarters and more are required;
— it is necessary to have the data from the Balance sheet, Income statement, and Cash flow statement, required for the calculation.
If at least one component required for calculating the Fundamental Strength is missing, the message "no data to calculate the Fundamental Strength correctly" is displayed. In the same case, but for the operating cash flow, the message "no data to calculate the Operating Cash Flow correctly" is shown, and similarly for other flows.
Risk disclaimer:
When working with the Fundamental Strength Indicator and the additional filter in the form of Cash Flows, you should understand that the publication of the Balance sheet, Income statement, and Cash flow statement takes place sometime after the end of the financial quarter. This means that new relevant data for the calculation will only appear after the publication of the new statements. In this regard, there may be a significant change in the values of the Indicator after the publication of new statements. The magnitude of this change will depend both on the content of the new statements and on the number of days between the end of the financial quarter and the publication date of the statements. Until the date of publication of the new statements, the latest relevant data will be used for calculations.
I would like to draw your attention to the fact that the calculation of Fundamental Strength and Cash Flows requires the availability of data for all parameters of the valuation model . It uses data that is exclusively available on TradingView (there is no reconciliation with other sources). If at least one parameter is missing, I switch to another company's analysis to continue using the indicator.
Thus, the Fundamental Strength Indicator and an additional filter in the form of Cash Flows make it possible to evaluate the financial results of the company based on the available data and the methodology I created. A simple visualization in the form of a three-color Histogram, a Blue line, and three thick Cash Flow lines significantly reduces the time for selecting fundamentally strong companies that fit the criteria of the selected model. However, this Indicator and/or its description and/or examples cannot be used as the sole reason for buying or selling stocks or for any other action or inaction related to stocks.

Diversification: What It Is, Why It Matters & How to Do ItDiversification is a market strategy that enables you to spread your money across a variety of assets and investments in pursuit of uncorrelated returns, hedging, and risk control.
Table of Contents
What is portfolio diversification?
Brief history of the modern portfolio theory
Why is diversification important?
An example of diversification at work
How to diversify your portfolio
Components of a diversified portfolio
Build wealth through diversification
Diversification vs concentration
Summary
📍 What is portfolio diversification?
Portfolio diversification is the strategy of spreading your money across diverse investments in order to mitigate risk, hedge and balance your exposure in pursuit of uncorrelated returns. While it may sound complex at first, portfolio diversification could be your greatest strength when you set out to trade and invest in the financial markets.
As a matter of fact, once you immerse yourself into the markets, you will be overwhelmed by the wide horizons waiting for you. That’s when you’ll need to know about diversification.
There are thousands of stocks available for trading, dozens of indices, and a sea of cryptocurrencies. Choosing your investments will invariably lead to relying on diversification in order to protect and grow your money.
Diversifying well will enable you to go into different sectors, markets and asset classes. Together, all of these will build up your diversified portfolio.
📍 Brief history of the modern portfolio theory
“ Diversification is both observed and sensible; a rule of behavior which does not imply the superiority of diversification must be rejected both as a hypothesis and as a maxim. ” These are the words of the father of the modern portfolio theory, Harry Markowitz.
His paper on diversification called “Portfolio Selection” was published in The Journal of Finance in 1952. The theory, which helped Mr. Markowitz win a Nobel prize in 1990, posits that a rational investor should aim to maximize their returns relative to risk.
The most significant feature from the modern portfolio theory was the discovery that you can reduce volatility without sacrificing returns. In other words, Mr. Markowitz argued that a well-diverse portfolio would still hold volatile assets. But relative to each other, their volatility would balance out because they all comprise one portfolio.
Therefore, the volatility of a single asset, Mr. Markowitz discovered, is not as significant as the contribution it makes to the volatility of the entire portfolio.
Let’s dive in and see how this works.
📍 Why is diversification important?
Diversification is important for any trader and investor because it builds out a mix of assets working together to yield returns. In practice, all assets contained in your portfolio will play a role in shaping the total performance of your portfolio.
However, these same assets out there in the market may or may not be correlated. The interrelationship of those assets within your portfolio is what will allow you to reduce your overall risk profile.
With this in mind, the total return of your investments will depend on the performance of all assets in your portfolio. Let’s give an example.
📍 An example of diversification at work
Say you want to own two different stocks, Apple (ticker: AAPL ) and Coca-Cola (ticker: KO ). In order to easily track your performance, you invest an equal amount of funds into each one—$500.
While you expect to reap handsome profits from both investments, Coca-Cola happens to deliver a disappointing earnings report and shares go down 5%. Your investment is now worth $475, provided no leverage is used.
Apple, on the other hand, posts a blowout report for the last quarter and its stock soars 10%. This move would propel your investment to a valuation of $550 thanks to $50 added as profits.
So, how does your portfolio look now? In total, your investment of $1000 is now $1,025, or a gain of 2.5% to your capital. You have taken a loss in Coca-Cola but your profit in Apple has compensated for it.
The more assets you add to your portfolio, the more complex the correlation would be between them. In practice, you could be diversifying to infinity. But beyond a certain point, diversification would be more likely to water down your portfolio instead of helping you get more returns.
📍 How to diversify your portfolio
The way to diversify your portfolio is to add a variety of different assets from different markets and see how they perform relative to one another. A single asset in your portfolio would mean that you rely on it entirely and how it performs will define your total investment result.
If you diversify, however, you will have a broader exposure to financial markets and ultimately enjoy more probabilities for winning trades, increased returns and decreased overall risks.
You can optimize your asset choices by going into different asset classes. Let’s check some of the most popular ones.
📍 Components of a diversified portfolio
Stocks
A great way to add diversification to your portfolio is to include world stocks , also called equities. You can look virtually anywhere—US stocks such as technology giants , the world’s biggest car manufacturers , and even Reddit’s favorite meme darlings .
Stock selection is among the most difficult and demanding tasks in trading and investing. But if you do it well, you will reap hefty profits.
Every stock sector is fashionable in different times. Your job as an investor (or day trader) is to analyze market sentiment and increase your probabilities of being in the right stock at the right time.
Currencies
The forex market , short for foreign exchange, is the market for currency pairs floating against each other. Trading currencies and having them sit in your portfolio is another way to add diversification to your market exposure.
Forex is the world’s biggest marketplace with more than $7.5 trillion in daily volume traded between participants.
Unlike stock markets that have specific trading hours, the forex market operates 24 hours a day, five days a week. Continuous trading allows for more opportunities for price fluctuations as events occurring in different time zones can impact currency values at any given moment.
Cryptocurrencies
A relatively new (but booming) market, the cryptocurrency space is quickly gaining traction. As digital assets become increasingly more mainstream, newcomers enter the space and the Big Dogs on Wall Street join too , improving the odds of growth and adoption.
Adding crypto assets to your portfolio is a great way to diversify and shoot for long-term returns. There’s incentive in there for day traders as well. Crypto coins are notorious for their aggressive swings even on a daily basis. It’s not unusual for a crypto asset to skyrocket 20% or even double in size in a matter of hours.
But that inherent volatility holds sharpened risks, so make sure to always do your research before you decide to YOLO in any particular token.
Commodities
Commodities, the likes of gold ( XAU/USD ) and silver ( XAG/USD ) bring technicolor to any portfolio in need of diversification. Unlike traditional stocks, commodities provide a hedge against inflation as their values tend to rise with increasing prices.
Commodities exhibit low correlation with other asset classes, too, thereby enhancing portfolio diversification and reducing overall risk.
Incorporating commodities into a diversified portfolio can help mitigate risk, enhance returns, and preserve purchasing power in the face of inflationary pressures, geopolitical uncertainty and other macroeconomic risks.
ETFs
ETFs , short for exchange-traded funds, are investment vehicles which offer a convenient and cost-effective way to gain exposure to a number of assets all packaged in the same instrument. These funds pull a bunch of similar stocks, commodities and—more recently— crypto assets , into the same bundle and launch it out there in the public markets. Owning an ETF means owning everything inside it, or whatever it’s made of.
ETFs typically have lower expense ratios compared to mutual funds, making them affordable investment options.
Whether you seek broad market exposure, niche sectors, or thematic investing opportunities, ETFs are a convenient way to build a diversified portfolio tailored to your investment objectives and risk preferences.
Bonds
Bonds are fixed-income investments available through various issuers with the most common one being the US government. Bonds are a fairly complex financial product but at the same time are considered a no-brainer for investors pursuing the path of least risk.
Bonds have different rates of creditworthiness and maturity terms, allowing investors to pick what fits their style best. Bonds with longer maturity—10 to 30 years—generally offer a better yield than short-term bonds.
Government bonds offer stability and low risk because they’re backed by the government and the risk of bankruptcy is low.
Cash
Cash may seem like a strange allocation asset but it’s actually a relatively safe bet when it comes to managing your own money. Sitting in cash is among the best things you can do when stocks are falling and valuations are coming down to earth.
And vice versa—when you have cash on-hand, you can be ready to scoop up attractive shares when they’ve bottomed out and are ready to fire up again (if only it was that easy, right?).
Finally, cash on its own is a risk-free investment in a high interest-rate environment. If you shove it into a high-yield savings account, you can easily generate passive income (yield) and withdraw if you need cash quickly.
📍 Build wealth through diversification
In the current context of market events, elevated interest rates and looming uncertainty, you need to be careful in your market approach. To this end, many experts advise that the best strategy you could go with in order to build wealth is to have a well-diversified portfolio.
“ Diversifying well is the most important thing you need to do in order to invest well ,” says Ray Dalio , founder of the world’s biggest hedge fund Bridgewater Associates.
“ This is true because 1) in the markets, that which is unknown is much greater than that which can be known (relative to what is already discounted in the markets), and 2) diversification can improve your expected return-to-risk ratio by more than anything else you can do. ”
📍 Diversification vs concentration
The opposite of portfolio diversification is portfolio concentration. Think about diversification as “ don’t put your eggs in one basket. ” Concentration, on the flip side, is “ put all your eggs in one basket, and watch it carefully. ”
In practice, concentration is focusing your investment into a single financial asset. Or having a few large bets that would assume higher risk but higher, or quicker, return.
While diversification is a recommended investment strategy for all seasons, concentration comes with bigger risks and is not always the right approach. Still, at times when you have a high conviction on a trade and have thoroughly analyzed the market, you may decide to bet heavily, thus concentrating your investment.
However, you need to be careful with concentrated bets as they can turn against your portfolio and wreck it if you’re overexposed and underprepared. Diversification, however, promises to cushion your overall risk by a carefully balanced approach to various financial assets.
📍 Summary
A diversified portfolio is essentially your best bet for coordinated and sustainable returns over the long term. Choosing a mix of various types of investments, such as stocks, ETFs, currencies, and crypto assets, would spread your exposure and provide different avenues for growth potential. Not only that, but it would also protect you from outsized risks, sudden economic shocks, or unforeseen events.
While you decrease your risk tolerance, you raise your probability of having winning positions. Regardless of your style and approach to markets, diversifying well will increase your chances of being right. You can be a trader and bet on currencies and gold for the short term. Or you can be an investor and allocate funds to stocks and crypto assets for years ahead.
Potential sources of diversification are everywhere in the financial markets. Ultimately, diversifying gives you thousands of opportunities to balance your portfolio and position yourself for risk-adjusted returns.
🙋🏾♂️ FAQ
❔ What is portfolio diversification?
► Portfolio diversification is the strategy of spreading your money across diverse investments in order to mitigate risk, hedge and balance your exposure in pursuit of uncorrelated returns.
❔ Why is diversification important?
► Diversification is important for any trader and investor because it creates a mix of assets working together to yield high, uncorrelated returns.
❔ How to diversify your portfolio?
► The way to diversify your portfolio is to add a variety of different assets and see how they perform relative to one another. If you diversify, you will have a broader exposure to financial markets and ultimately enjoy more probabilities for winning trades, increased returns, and decreased overall risks.
Do you diversify? What is your strategy? Do you rebalance? Let us know in the comments.
Liked this article? Give it a boost 🚀 and don't forget to follow us if you want to be among the first to be informed.

Gold Correction: Seizing Strategic OpportunitiesThe analysis on XAUUSD highlights a likely corrective period for gold, in line with the movement of the US dollar and Treasury bond yields. After a period of steady growth, the price of gold is now consolidating recent gains, with the Relative Strength Index (RSI) signaling a high level of overbought conditions, potentially foreshadowing an imminent downward correction. However, the current bullish crossover of moving averages may mitigate this negative trend. It is essential for gold buyers to defend the key support level at $2,107 to avoid further declines, while surpassing the resistance at $2,144 could pave the way for further gains. Growing expectations of interest rate cuts by the US Federal Reserve, supported by disappointing economic data, are fueling interest in gold as a safe-haven asset. Investors will closely watch Federal Reserve Chairman Jerome Powell's testimony for further insights into future rate movements. Meanwhile, upcoming employment and labor market data will be crucial in influencing trading on both the dollar and gold, offering significant trading opportunities.

XAUUSD NEXT MOVE POSSIBLE Gold Is Bullish We Have Best Buying Opportunity Around 2116 To 2110 After Break 2110 Level Minimum H1 Time Frame Closing Important For Sell Entry Otherwise Best Buying Opportunity 2116 To 2110 For More Updates Stay Tuned

Still holding BTC based on my strategyHolding CRYPTO:BTCUSD CRYPTO:ETHUSD
My strategy on CRYPTOCAP:BTC
Profit factor 14
Winning rate 63%
MMD 17%
CRYPTOCAP:BTC CRYPTOCAP:ETH CRYPTOCAP:BNB

ALPH/USDT | GATE.IO | Micro/Macro Strategy | Daily TFi've loved alph very much since its inception. this chart has played out so well for me in these last 6 months.
finally another competitor PoW coin for the people.
i have been and will continue to stack this coin, if you haven't already. Do a little research on Alephium mining. it's easy AF and simple passive income, especially if your graphics cards are just idle, put them to work guys!.
here is my micro/macro trade for ALPH/USDC on the Daily TF. I do expect plenty of volatility as we stress the top of our previous ATH.
Also, as we do poke at this previous top a bit I will be watching on the 4hour for any re-entries and liquidity dips.
for now, i'm holding, watching the 4HR, daily & weekly timeframes for quick wicks of liquidity grabs.
in 2 weeks or less we will have our directional answer. no stops set here, only limit orders. my direction is heading North!

GBP/USD Analysis: Rebound Continues Amidst Technical SignalsThe GBP/USD exchange rate experienced a positive rebound the previous Friday, rising from the round figure of 1.2600 after touching a one-and-a-half-week low. This positive momentum continued into the following Monday, with spot prices reaching a multi-day peak in the range of 1.2660-1.2665 during the Asian session. However, the Relative Strength Index (RSI) indicator on the 4-hour chart remains below 50, indicating some weakness, and the exchange rate stays below 1.2650, where the 200-period Simple Moving Average and the 23.6% Fibonacci retracement of the long-term uptrend converge. If the exchange rate fails to surpass 1.2650 again, sellers could take control. In such a scenario, support levels at 1.2600 and 1.2540 could be tested. On the other hand, if the GBP/USD exceeds 1.2650 and holds it as support, technical buyers may enter the market, paving the way for further gains towards 1.2680 and 1.2700. Meanwhile, US stock index futures are trading positively, which could support a bullish opening on Wall Street and attract risk flows that may further sustain the GBP/USD. Best regards and happy Monday to all.

EUR/USD: Fluctuations and Challenges Amidst US Economic DataThe EUR/USD exchange rate continues to fluctuate within its daily range above the level of 1.0800 during Friday's American session. Economic data from the United States shows that the ISM Manufacturing PMI decreased more than expected in February, making it difficult for the US dollar to gain momentum. Nonetheless, the EUR/USD has found support around 1.0800 but still needs to surpass the 200-period Simple Moving Average (SMA) on the 4-hour chart, currently around 1.0820. The Relative Strength Index (RSI) indicator remains just below 50, indicating a lack of momentum in the recovery phase. If the EUR/USD manages to consolidate above 1.0820 and utilize that level as support, we could see the next resistance at 1.0860, followed by 1.0900-1.0910. However, a 4-hour close below 1.0800 could attract technical sellers, pushing the exchange rate towards 1.0760 and 1.0720. The EUR/USD was under bearish pressure during Thursday's American trading hours and closed in negative territory for the third consecutive day. Although the exchange rate manages to stay above 1.0800 on Friday, it might struggle to recover unless Eurozone inflation data supports the euro. Favorable comments on monetary tightening from Federal Reserve (Fed) members following the inflation data strengthened the US dollar, causing the EUR/USD to turn downward. Eurostat will publish the Harmonized Index of Consumer Prices for February, with forecasts of a 2.5% increase. I expect a breakout on the daily level of 1.088 with a break of supply and subsequent retracement for a retest before the upward momentum towards 1.0950. Best wishes and have a good start to the week everyone.

Stock Market Logic Series #7Options Spreads strategy, let us talk about it.
If you want to buy high-probability spreads, there are specific places where you have the advantage.
And, there are other specific places where it is just pure gambling.
And, we don't gamble, EVER.
We take calculated risks, where the probability of success is much higher than the probability of loss.
--------------------------
In spread options, what matters the most is where the price will be at the expiration date.
WHY?
Because your profit can only be realized near the expiration date unless the price moves dramatically into your favor and far away from the spread strikes.
So, if what matters is where the price is at the expiration date, you want that in this future date, the price of the stock to be away from it, with HIGH PROBABILITY.
As you can see from the drawing on the chart,
the blue channel signifies the probability area of where the price should be in the future.
So if in the future, you are in the probable zone, as seen in the RED spreads, at the expiration date, the price could be below or above your strikes, and thus be successful or not successful, so your odds are more 50-50.
since the price can just stall there, and oscillate in this area, since it is the probable area where the price should be.
But if you look carefully at historical data, you can see that in the GREEN (MONEY ZONES), the price gets immediately rejected...
WITH THE HELP OF T-I-M-E
And when you buy spreads, you want TIME to be on your side...
So now you can easily see... how to make TIME which is a HUGE factor in spreads, on your side!
The trend is your friend... IF... you let it TIME to help you...
When you use options, and trading options in general you need to know which strategy fits which scenario, and where your HIGH probability trade waiting for you.
Just in case you don't know what options spreads are...
In simple words...
You choose 2 prices of the stock (aka strikes):
------$100
------$90
and you speculate that
if the price in a month will be above $100, you profit 1 point.
and if the price in a month will be below $90, you lose 1 point.
So it is a 1:1 risk-to-reward strategy.
So your advantage comes from knowing where are the pivot points.
But not all pivot points have the same advantage...
As I just showed you in this post...

USDCAD Trade Update | 30mThere was an opportunity for another entry printed today in the retracement.
Today the trade hit 60 pips in profit. The whole move has a chance of making 150+ pips.
I'll keep you updated.

S&P500 (SPX): Swimming Against the CurrentS&P500 (SPX): SP:SPX
Swimming against the current with our analysis, we still see a very plausible scenario in the S&P 500. There are multiple scenarios at play, each with its own significance.
Our primary scenario posits that we've completed Wave (5) and the first cycle at $4,818 points, now embarking on a Wave II. We've likely finished Wave (A) and soon Wave (B), preparing to embark on Wave (C).
An alternate scenario, marked as alt. (3) and alt. (4), suggests that surpassing the 138% level would lead us to expect alt. Wave alt. (5) before concluding the entire first cycle.
On another note, the least likely of these scenarios is having already completed Wave II with Wave (A).
This diversity of possibilities underscores the complexity and uncertainty inherent in market analysis, reminding us of the importance of our own risk and portfolio management and the readiness to adapt our strategies should we encounter surprises in the market.

EURUSD MY LONG TRADE | 30m | Short TermAs I said in my last post. Lot's of imbalance, liquidity and stops was taken and there will be possibilities for long entries.
I took a small long which is already in BE and I took some profits early.
Let's see how it goes.
LQP = Liquidity Pool
Arrows = Inducement Points
2WT = 2 Way Trap
POI = Point Of Interest

EURUSD 15m | Short/Mid Term VisionEURUSD in my opinion has a lot of short potential.
Lots of liquidity and support manipulations under.
I'm already BE on my position. Lets see how it goes.
DBD = Drop Base Drop Supply Zone
LQP = Liquidity Pool
Arrows = Inducement Points
2WT = 2 Way Trap

GBPUSD 30m | UpdateGU and EU are mirroring. GU has some laying liquidity above. Have this in mind.
Asia SSL was taken. I took profits there.
EU looks like it's going down and GU also looks like it should go down but there are also signs that there might be a RAID for the orders above first. There are also news soon.
I'm taking it easy.
LQP = Liquidity Pool
Arrows = Inducement Points
2WT = 2 Way Trap

GBPUSD 15m / Short/Mid Term ViewLQP = Liquidity Pool
Arrows = Inducement Points
2WT = 2 Way Trap
Lots of liquidity resting at the overstock level.
Runner left.

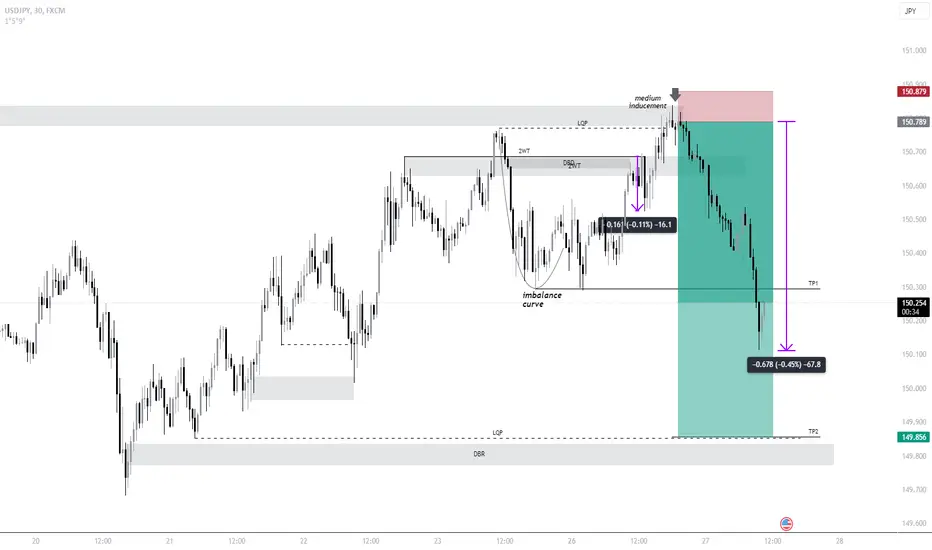
USDJPY 30M TRADE UPDATE | MID TERM VISIONDBD = Drop Base Drop Supply Zone
DBR = Drop Base Rally Demand Zone
LQP = Liquidity Pool
Arrows = Inducement Points
2WT = 2 Way Trap
The first setup gave a 15+ pips reaction and then reversed (BE for me).
The second setup is running 65+ pips.
Watch out on the US session!
Runner left.
AUDUSD 1H | MY MID TERM VISION updateDBR = Drop Base Rally Demand Zone
RBD = Rally Base Drop Supply Zone
LQP = Liquidity Pool
Arrows = Inducement Points
2WT = 2 Way Trap
I missed the entry from the Demand Zone because it was in Asia. I might look for new entries.
Lots of liquidity to be taken.
I'll be targetting the RBD supply zone.

XAUUSD SHORT UPDATE | 15m Short/Mid Term ViewRBR = Rally Base Rally Demand Zone
LQP = Liquidity Pool
Arrows = Inducement Points
2WT = 2 Way Trap
Price is still moving in a way that tells me it should continue going down at least to 2024. (retracement + imbalance curve)
Price nearly hit my TP. I closed most of my position and left a runner.

How to use call option buy or sell indicatorHello Traders,
Exciting news! We've just released a detailed video guide on how to harness the full potential of Chobotaru Brothers Option Indicators. In this short tutorial, we cover everything you need to know to use the indicator, specifically focusing on out-of-the-money call options.
Here's what you'll discover in the video:
1. Adding the Indicator to Your Chart:
Learn the simple steps to seamlessly integrate Chobotaru Brothers Option Indicator into your trading view for a clear and concise analysis.
2. Finding Option Parameters:
Navigate through your broker's option chain on platforms such as Interactive Brokers to locate all the essential parameters needed for effective trading decisions.
3. SEE the Lines of Profit:
Gain a deep understanding of the meaning behind each line of profit displayed by the indicator, empowering you to make informed choices based on market movements.
4. Utilizing Lower Timeframes (Example of 5m and 30m):
Explore the versatility of Chobotaru Brothers Option Indicator by discovering how it can be effectively applied to lower timeframes like 5 minutes and 30 minutes.
5. LIVE Example: Out-of-the-Money Call Option:
Follow along with our real-time example using an out-of-the-money call option, providing practical insights into how EASY is the indicator's functionality and application in a live trading scenario.
We've designed this tutorial to be beginner-friendly, ensuring that traders of all levels can seamlessly integrate Chobotaru Brothers Option Indicators into their trading arsenal. Watch the video, enhance your trading skills, and unlock the potential for greater success in the options market.
If you find the video helpful, don't forget to like, follow, and share it with your fellow traders. Happy trading, and may your profits soar!
Best regards,
Chobotaru Brothers

PARA Paramount Global Options Ahead of EarningsAnalyzing the options chain and the chart patterns of PARA Paramount Global prior to the earnings report this week,
I would consider purchasing the 12.50usd strike price Calls with
an expiration date of 2024-6-21,
for a premium of approximately $1.15.
If these options prove to be profitable prior to the earnings release, I would sell at least half of them.

How to Find a High Probability Trade in an Uptrend Hey Traders,
We'll show you how you can find an easy trade with a high risk-to-reward ratio using some basic concepts.
- Step One: Spot an uptrend where you have higher highs and higher lows.
- Step two: Spot the last break of structure.
- Step three: Use the Fibonacci tool and connect it from the recent lows to the recent highs.
- Step Four: Watch prices coming back to the broken structure that lines up with any Fibonacci level. ( Focus on the 50% - 61.8% - 78.6% Levels )
- Step Five: Wait for a clear bullish candle and then enter with stoploss structure
- Step Six: Take partial profits at the recent highs and the Fibonacci extensions ( - 0.27 & -0.618 )
