Gold Correction: Seizing Strategic OpportunitiesThe analysis on XAUUSD highlights a likely corrective period for gold, in line with the movement of the US dollar and Treasury bond yields. After a period of steady growth, the price of gold is now consolidating recent gains, with the Relative Strength Index (RSI) signaling a high level of overbought conditions, potentially foreshadowing an imminent downward correction. However, the current bullish crossover of moving averages may mitigate this negative trend. It is essential for gold buyers to defend the key support level at $2,107 to avoid further declines, while surpassing the resistance at $2,144 could pave the way for further gains. Growing expectations of interest rate cuts by the US Federal Reserve, supported by disappointing economic data, are fueling interest in gold as a safe-haven asset. Investors will closely watch Federal Reserve Chairman Jerome Powell's testimony for further insights into future rate movements. Meanwhile, upcoming employment and labor market data will be crucial in influencing trading on both the dollar and gold, offering significant trading opportunities.
Strategy

XAUUSD NEXT MOVE POSSIBLE Gold Is Bullish We Have Best Buying Opportunity Around 2116 To 2110 After Break 2110 Level Minimum H1 Time Frame Closing Important For Sell Entry Otherwise Best Buying Opportunity 2116 To 2110 For More Updates Stay Tuned

Still holding BTC based on my strategyHolding CRYPTO:BTCUSD CRYPTO:ETHUSD
My strategy on CRYPTOCAP:BTC
Profit factor 14
Winning rate 63%
MMD 17%
CRYPTOCAP:BTC CRYPTOCAP:ETH CRYPTOCAP:BNB

ALPH/USDT | GATE.IO | Micro/Macro Strategy | Daily TFi've loved alph very much since its inception. this chart has played out so well for me in these last 6 months.
finally another competitor PoW coin for the people.
i have been and will continue to stack this coin, if you haven't already. Do a little research on Alephium mining. it's easy AF and simple passive income, especially if your graphics cards are just idle, put them to work guys!.
here is my micro/macro trade for ALPH/USDC on the Daily TF. I do expect plenty of volatility as we stress the top of our previous ATH.
Also, as we do poke at this previous top a bit I will be watching on the 4hour for any re-entries and liquidity dips.
for now, i'm holding, watching the 4HR, daily & weekly timeframes for quick wicks of liquidity grabs.
in 2 weeks or less we will have our directional answer. no stops set here, only limit orders. my direction is heading North!

GBP/USD Analysis: Rebound Continues Amidst Technical SignalsThe GBP/USD exchange rate experienced a positive rebound the previous Friday, rising from the round figure of 1.2600 after touching a one-and-a-half-week low. This positive momentum continued into the following Monday, with spot prices reaching a multi-day peak in the range of 1.2660-1.2665 during the Asian session. However, the Relative Strength Index (RSI) indicator on the 4-hour chart remains below 50, indicating some weakness, and the exchange rate stays below 1.2650, where the 200-period Simple Moving Average and the 23.6% Fibonacci retracement of the long-term uptrend converge. If the exchange rate fails to surpass 1.2650 again, sellers could take control. In such a scenario, support levels at 1.2600 and 1.2540 could be tested. On the other hand, if the GBP/USD exceeds 1.2650 and holds it as support, technical buyers may enter the market, paving the way for further gains towards 1.2680 and 1.2700. Meanwhile, US stock index futures are trading positively, which could support a bullish opening on Wall Street and attract risk flows that may further sustain the GBP/USD. Best regards and happy Monday to all.

EUR/USD: Fluctuations and Challenges Amidst US Economic DataThe EUR/USD exchange rate continues to fluctuate within its daily range above the level of 1.0800 during Friday's American session. Economic data from the United States shows that the ISM Manufacturing PMI decreased more than expected in February, making it difficult for the US dollar to gain momentum. Nonetheless, the EUR/USD has found support around 1.0800 but still needs to surpass the 200-period Simple Moving Average (SMA) on the 4-hour chart, currently around 1.0820. The Relative Strength Index (RSI) indicator remains just below 50, indicating a lack of momentum in the recovery phase. If the EUR/USD manages to consolidate above 1.0820 and utilize that level as support, we could see the next resistance at 1.0860, followed by 1.0900-1.0910. However, a 4-hour close below 1.0800 could attract technical sellers, pushing the exchange rate towards 1.0760 and 1.0720. The EUR/USD was under bearish pressure during Thursday's American trading hours and closed in negative territory for the third consecutive day. Although the exchange rate manages to stay above 1.0800 on Friday, it might struggle to recover unless Eurozone inflation data supports the euro. Favorable comments on monetary tightening from Federal Reserve (Fed) members following the inflation data strengthened the US dollar, causing the EUR/USD to turn downward. Eurostat will publish the Harmonized Index of Consumer Prices for February, with forecasts of a 2.5% increase. I expect a breakout on the daily level of 1.088 with a break of supply and subsequent retracement for a retest before the upward momentum towards 1.0950. Best wishes and have a good start to the week everyone.

Stock Market Logic Series #7Options Spreads strategy, let us talk about it.
If you want to buy high-probability spreads, there are specific places where you have the advantage.
And, there are other specific places where it is just pure gambling.
And, we don't gamble, EVER.
We take calculated risks, where the probability of success is much higher than the probability of loss.
--------------------------
In spread options, what matters the most is where the price will be at the expiration date.
WHY?
Because your profit can only be realized near the expiration date unless the price moves dramatically into your favor and far away from the spread strikes.
So, if what matters is where the price is at the expiration date, you want that in this future date, the price of the stock to be away from it, with HIGH PROBABILITY.
As you can see from the drawing on the chart,
the blue channel signifies the probability area of where the price should be in the future.
So if in the future, you are in the probable zone, as seen in the RED spreads, at the expiration date, the price could be below or above your strikes, and thus be successful or not successful, so your odds are more 50-50.
since the price can just stall there, and oscillate in this area, since it is the probable area where the price should be.
But if you look carefully at historical data, you can see that in the GREEN (MONEY ZONES), the price gets immediately rejected...
WITH THE HELP OF T-I-M-E
And when you buy spreads, you want TIME to be on your side...
So now you can easily see... how to make TIME which is a HUGE factor in spreads, on your side!
The trend is your friend... IF... you let it TIME to help you...
When you use options, and trading options in general you need to know which strategy fits which scenario, and where your HIGH probability trade waiting for you.
Just in case you don't know what options spreads are...
In simple words...
You choose 2 prices of the stock (aka strikes):
------$100
------$90
and you speculate that
if the price in a month will be above $100, you profit 1 point.
and if the price in a month will be below $90, you lose 1 point.
So it is a 1:1 risk-to-reward strategy.
So your advantage comes from knowing where are the pivot points.
But not all pivot points have the same advantage...
As I just showed you in this post...

USDCAD Trade Update | 30mThere was an opportunity for another entry printed today in the retracement.
Today the trade hit 60 pips in profit. The whole move has a chance of making 150+ pips.
I'll keep you updated.

S&P500 (SPX): Swimming Against the CurrentS&P500 (SPX): SP:SPX
Swimming against the current with our analysis, we still see a very plausible scenario in the S&P 500. There are multiple scenarios at play, each with its own significance.
Our primary scenario posits that we've completed Wave (5) and the first cycle at $4,818 points, now embarking on a Wave II. We've likely finished Wave (A) and soon Wave (B), preparing to embark on Wave (C).
An alternate scenario, marked as alt. (3) and alt. (4), suggests that surpassing the 138% level would lead us to expect alt. Wave alt. (5) before concluding the entire first cycle.
On another note, the least likely of these scenarios is having already completed Wave II with Wave (A).
This diversity of possibilities underscores the complexity and uncertainty inherent in market analysis, reminding us of the importance of our own risk and portfolio management and the readiness to adapt our strategies should we encounter surprises in the market.

EURUSD MY LONG TRADE | 30m | Short TermAs I said in my last post. Lot's of imbalance, liquidity and stops was taken and there will be possibilities for long entries.
I took a small long which is already in BE and I took some profits early.
Let's see how it goes.
LQP = Liquidity Pool
Arrows = Inducement Points
2WT = 2 Way Trap
POI = Point Of Interest

EURUSD 15m | Short/Mid Term VisionEURUSD in my opinion has a lot of short potential.
Lots of liquidity and support manipulations under.
I'm already BE on my position. Lets see how it goes.
DBD = Drop Base Drop Supply Zone
LQP = Liquidity Pool
Arrows = Inducement Points
2WT = 2 Way Trap

GBPUSD 30m | UpdateGU and EU are mirroring. GU has some laying liquidity above. Have this in mind.
Asia SSL was taken. I took profits there.
EU looks like it's going down and GU also looks like it should go down but there are also signs that there might be a RAID for the orders above first. There are also news soon.
I'm taking it easy.
LQP = Liquidity Pool
Arrows = Inducement Points
2WT = 2 Way Trap

GBPUSD 15m / Short/Mid Term ViewLQP = Liquidity Pool
Arrows = Inducement Points
2WT = 2 Way Trap
Lots of liquidity resting at the overstock level.
Runner left.

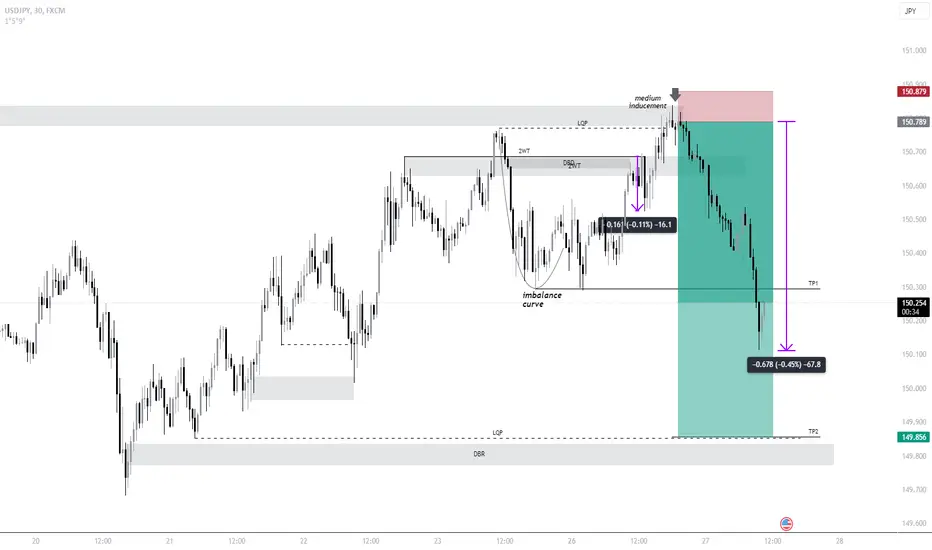
USDJPY 30M TRADE UPDATE | MID TERM VISIONDBD = Drop Base Drop Supply Zone
DBR = Drop Base Rally Demand Zone
LQP = Liquidity Pool
Arrows = Inducement Points
2WT = 2 Way Trap
The first setup gave a 15+ pips reaction and then reversed (BE for me).
The second setup is running 65+ pips.
Watch out on the US session!
Runner left.
AUDUSD 1H | MY MID TERM VISION updateDBR = Drop Base Rally Demand Zone
RBD = Rally Base Drop Supply Zone
LQP = Liquidity Pool
Arrows = Inducement Points
2WT = 2 Way Trap
I missed the entry from the Demand Zone because it was in Asia. I might look for new entries.
Lots of liquidity to be taken.
I'll be targetting the RBD supply zone.

XAUUSD SHORT UPDATE | 15m Short/Mid Term ViewRBR = Rally Base Rally Demand Zone
LQP = Liquidity Pool
Arrows = Inducement Points
2WT = 2 Way Trap
Price is still moving in a way that tells me it should continue going down at least to 2024. (retracement + imbalance curve)
Price nearly hit my TP. I closed most of my position and left a runner.

How to use call option buy or sell indicatorHello Traders,
Exciting news! We've just released a detailed video guide on how to harness the full potential of Chobotaru Brothers Option Indicators. In this short tutorial, we cover everything you need to know to use the indicator, specifically focusing on out-of-the-money call options.
Here's what you'll discover in the video:
1. Adding the Indicator to Your Chart:
Learn the simple steps to seamlessly integrate Chobotaru Brothers Option Indicator into your trading view for a clear and concise analysis.
2. Finding Option Parameters:
Navigate through your broker's option chain on platforms such as Interactive Brokers to locate all the essential parameters needed for effective trading decisions.
3. SEE the Lines of Profit:
Gain a deep understanding of the meaning behind each line of profit displayed by the indicator, empowering you to make informed choices based on market movements.
4. Utilizing Lower Timeframes (Example of 5m and 30m):
Explore the versatility of Chobotaru Brothers Option Indicator by discovering how it can be effectively applied to lower timeframes like 5 minutes and 30 minutes.
5. LIVE Example: Out-of-the-Money Call Option:
Follow along with our real-time example using an out-of-the-money call option, providing practical insights into how EASY is the indicator's functionality and application in a live trading scenario.
We've designed this tutorial to be beginner-friendly, ensuring that traders of all levels can seamlessly integrate Chobotaru Brothers Option Indicators into their trading arsenal. Watch the video, enhance your trading skills, and unlock the potential for greater success in the options market.
If you find the video helpful, don't forget to like, follow, and share it with your fellow traders. Happy trading, and may your profits soar!
Best regards,
Chobotaru Brothers

PARA Paramount Global Options Ahead of EarningsAnalyzing the options chain and the chart patterns of PARA Paramount Global prior to the earnings report this week,
I would consider purchasing the 12.50usd strike price Calls with
an expiration date of 2024-6-21,
for a premium of approximately $1.15.
If these options prove to be profitable prior to the earnings release, I would sell at least half of them.

How to Find a High Probability Trade in an Uptrend Hey Traders,
We'll show you how you can find an easy trade with a high risk-to-reward ratio using some basic concepts.
- Step One: Spot an uptrend where you have higher highs and higher lows.
- Step two: Spot the last break of structure.
- Step three: Use the Fibonacci tool and connect it from the recent lows to the recent highs.
- Step Four: Watch prices coming back to the broken structure that lines up with any Fibonacci level. ( Focus on the 50% - 61.8% - 78.6% Levels )
- Step Five: Wait for a clear bullish candle and then enter with stoploss structure
- Step Six: Take partial profits at the recent highs and the Fibonacci extensions ( - 0.27 & -0.618 )

ADI Analog Devices Options Ahead of EarningsAnalyzing the options chain and the chart patterns of ADI Analog Devices prior to the earnings report this week,
I would consider purchasing the 195usd strike price Calls with
an expiration date of 2024-3-15,
for a premium of approximately $3.50.
If these options prove to be profitable prior to the earnings release, I would sell at least half of them.

The most subjective facet of my decision-making systemIn the previous publication I started talking about my decision-making system. I use it when investing in stocks. This system allows me to answer three questions:
- which stocks to choose?
- at what price to make a trade?
- and in what quantity?
In this post, I will continue to answer the question Which stocks to pick? and tell you about another facet of my crystal.
As you can see, my decision-making system is quite formalized. What do I mean? It has clear criteria for which a company must be checked before investing in its stocks. If we go deeper into this idea, we can say that the state of affairs in any public company can be assessed using numbers from its statements and stock exchange prices for its stocks. All this can be visualized, put into a form that is readable for the investor, and accelerate the decision-making process many times over.
However, there is an area with information that hovers around the companies, directly or indirectly influences it, but is poorly formalized: this is News . News can be called a message related to a company and distributed through its website, media, and social networks. This message triggers an almost knee-jerk reaction among stock investors (and traders). They will try to interpret the information received, make a forecast, and in some cases even make a trade. It is for this reason that the moment the news is published is often accompanied by a sharp movement in the stock price and an increase in trading volume. The order book now has a lot more players than before. These are traders excited by the news, confident of what will happen next.
Here I can’t help but recall the allegory about Crazy Mister Market from Benjamin Graham. It presents the market as a partner who is constantly knocking on your door and offering you crazy ideas (stock prices). Where does this mister get his madness from? My answer is simple — from the news. Despite this, I cannot help but pay attention to the news, I cannot help but interpret it, to build predictions in my head. This happens reflexively, as a reaction to boiling water hitting my skin. However, will I make a trade under the influence of this information? We'll talk about this at the end of the post.
Let's find out what news is available and where to find it. In this publication, I will only consider matters relevant to the stock market. That is information that can directly or indirectly affect the state of affairs in the companies. As I work, I divide the news flow into two categories: macro-event and corp-event .
A macro-event is something that can indirectly impact the state of affairs in a company since it impacts the external environment in which it lives.
For example:
1. In the third quarter, US GDP grew by 4.9% year-on-year, which was better than expected (*).
GDP Dynamics are a general economic indicator of economic growth in a particular country. This event only indirectly affects the business of the US companies. In other words, a company can be unprofitable even if the GDP in the country of its business is growing.
(*) In the news, you will often see the following wording:
- better than expected
- worse than expected
- as expected
These are significant clarifications since it is believed that the exchange price already considers expectations for future events. Therefore, the coincidence with expectations will most likely be perceived calmly by market participants. Conversely, price fluctuations can be significant if the news can be qualified as a “surprise”.
2. The EPA is setting rules for a proposed “methane fee” on waste generated by oil and gas companies.
This news also refers to macro events, as it impacts an entire industry: the oil and gas business. Moreover, please note that methane fee is only suggested. That is, it is not at all a fact that it will ultimately be implemented.
Unlike macro events, a corp-event directly affects the state of affairs in the companies. Let's look at some of them.
For example:
3. Hilton's (HLT) 3rd quarter Profit was in line with revenue forecasts.
The news contains information about Hilton's financial results for the 3rd quarter. Of course, this directly impacts investors’ assessment of the company's prospects, and therefore the volume of investment in it.
4. Devastating wildfires have forced California's largest utility, Pacific Gas and Electric Company, to plan the sale of gas assets.
Based on the news headline, we can conclude that the company is considering selling a significant part of its business (since the word “gas” even appears in the company name) to compensate for the damage from the devastating fires. Of course, this directly points to the difficult situation in the companies.
Well, we figured out which news is considered a macro-event and which is a corporate event. Now let's find them where we need to. First, let's look at the event calendars that are available on TradingView. They are convenient because they inform us in advance what event to expect on the date in question.
Let's start with the Economic calendar . You can find it in the main TradingView Products menu (Products -> Economic calendar ). This calendar shows upcoming publications of key macroeconomic indicators such as GDP, interest rate, unemployment, and inflation. It will also reflect national events — for example, presidential elections. Thus, you will only see macro events in it.
Click on globe and select the country you are interested in, a group of countries, or the whole world: this way you will filter events by geography. If you are interested in tracking only important events, there is a special button for this High importance . There is also a three-column importance indicator next to each event. If all are shaded, the event is of maximum importance. You can expand any event, read information about it, view statistics, and even add it to your personal calendar.
In terms of importance, the higher the importance of the event, the stronger the market reaction may be after the information is released. Furthermore, the strength of the reaction will depend on how much reality diverges from expectations for this event (with the forecast). Please note that the current value published is published to the left of the forecast, and the value for the previous period is published to the right. This allows you to evaluate the released metric over time.
So, my standard set of filters for the economic calendar is:
- Geography: all over the world;
- High importance;
- This week;
- All categories.
The economic calendar has been set up. There is another calendar on TradingView: this is Earnings calendar . It is located in the interface for working with Supercharts and, of course, is intended for analyzing corporate events. Once you go to the chart, click on the calendar icon in the menu on the right, and the events panel will open in front of you.
The Earnings calendar will contain the names of the companies, their next reporting date, and analysts' estimates of earnings per share: EPS. In its meaning, this estimate is an average expectation or forecast. Therefore, any strong discrepancy between current data and the forecast value can greatly change the value of the company's stocks. By the way, you can check this simply by clicking on the company's name in the calendar: the window with the stock price chart will update instantly. The released earnings per share value can be viewed both on the chart itself and in the company's information (the top menu button on the right). The current value will be marked with either a red circle (below the forecast) or a green circle (above the forecast). The gray circle indicates the forecast itself.
Calendars are convenient because they present us with the main essence of the news in a compressed, digitized form. The description of such news is not as important as the value of the key indicator. However, if you want to read classic text news about a related company, simply click on the lightning bolt icon on your chart.
You can also find news grouped by asset class, region, news agency, etc. in the main menu of the TradingView site's root page. Of the groups presented, I most often use News Flow to get a general context of what is happening.
Returning to my decision-making system, there is news (let's call it critical ) that can trigger the closure of a position or non-opening of a position in the shares of a particular company, even though the main indicators do not suggest this.
To determine such news, I ask myself three questions:
1. Do I trust this news source?
We are surrounded by many sources of news: social networks, news sites, television, etc. It’s easy to check everyone’s reputation on the Internet. Therefore, to take the news into account, you must trust its source. If you see significant news about a company, but it is not in reputable media resources and/or on the company's website, this is a reason to think whether the source is trying to increase its popularity through a loud headline and unverified content.
2. Does this news describe an accomplished fact?
Even in reputable publications, you can find publications with versions of events, forecasts, and opinions. This is good food for thought. However, when deciding, I constantly try to separate the standpoint from the fact confirmed by a reliable source. Only facts can be considered when deciding.
3. Is an accomplished fact capable of leading the company to bankruptcy?
This is a difficult question that requires an assessment of the company's economic damage, and its comparison with the level of total debt to creditors and current assets. Even if a company is facing bankruptcy, it can be saved by providing assistance from the government or other businesses. Answering this question, I can listen to the opinions of analysts and my intuition. Therefore, this is the most subjective facet of my decision-making system. I just have to tell myself: “Yes, this fact can lead the company to bankruptcy” or vice versa: “No, this news is bad, but it does not pose a critical threat to the business.”
So, if I answer “yes” to all three questions, then I can close a position in the shares of a particular company or not open it, guided simply by my “yes, this should be done.” The fact is that critical news comes out now, and reporting on a specific date in the future: there is a time gap between these events. Therefore, I find myself in a situation where I just need to decide and evaluate it later, in the future, based on published reports. It is similar to flying an airplane that fails during transit. The pilot may not fully understand what happened, but the choice must be made right now. If I answer “no” to any of the three questions, then I continue to use other facets of my “crystal” in standard mode, and leave the news “just for my information.”
In future publications, I will continue to elaborate on my decision-making system and share my approach to choosing the price and quantity of a stock trade.

The 9 Rules of Successful Investors The world of investing can be a daunting place, especially for beginners . With so many factors to consider and the potential for significant losses, it can be difficult to know where to start. However, there are a few basic rules that all successful investors follow. By following these rules, you can increase your chances of success and avoid costly mistakes.
1. Be prepared to lose money.
This is the first and most important rule of investing. No matter how much research you do or how experienced you are, there is always the possibility of losing money. This is why it is important to only invest money that you can afford to lose.
2. Calculate your risk before opening a trade, not during.
Before you open any trade, you should always calculate your risk. This means determining how much money you are willing to lose on the trade. You should also set a stop-loss order to automatically close the trade if it reaches a certain price level.
3. Be in a cold state of mind (without the influence of emotions).
Emotions can be a major enemy of successful investing. When you are trading, it is important to stay calm and rational. Do not let your emotions get the best of you, as this can lead to making bad decisions.
4. Open positions only in the direction of the trend.
One of the best ways to increase your chances of success in trading is to trade in the direction of the trend. This means identifying the overall trend of the market and then trading in line with that trend.
5. Keep a trading journal with a detailed description of each trade.
A trading journal is a great way to track your progress and identify areas where you can improve. In your trading journal, you should record details of each trade, such as the date, time, entry price, exit price, and profit or loss.
6. Regularly analyze your trades.
Once you have a few trades under your belt, it is important to take some time to analyze them. This will help you identify what you are doing right and what you need to improve on.
7. Constantly improve yourself.
The world of trading is constantly evolving, so it is important to keep up with the latest trends and strategies. There are many resources available to help you learn more about trading, such as books, websites, and courses.
8. Give yourself time to rest from trading.
Trading can be a stressful activity, so it is important to give yourself time to rest and recharge. Taking breaks from trading will help you stay focused and avoid making emotional decisions.
9. Profit is only what you have taken and have in your pocket (conditionally), not what the open P&L in the position shows, because it is floating and not fixed profit.
This is a reminder that profit is not real until you have taken it out of the market. Do not get too attached to your profits, as they can quickly disappear if the market moves against you.
Additional Tips for Successful Investing
In addition to the 9 rules listed above, there are a few other things you can do to increase your chances of success as an investor:
Do your research. Before you invest in any asset, it is important to do your research and understand the risks involved. This includes understanding the asset's fundamentals, as well as the overall market conditions.
Diversify your portfolio. Don't put all your eggs in one basket. By diversifying your portfolio, you can reduce your risk and increase your chances of success.
Invest for the long term. The stock market is volatile in the short term, but it has historically trended upwards over the long term.
By investing for the long term, you can ride out the short-term fluctuations and maximize your returns.
Don't panic sell. When the market takes a downturn, it is important to stay calm and avoid panic selling. Selling when the market is down will only lock in your losses. Instead, focus on the long term and ride out the storm.
By following these tips, you can increase your chances of success as an investor. However, it is important to remember that there is no guarantee of success. Even the best investors in the world lose money sometimes. The key is to learn from your mistakes and keep moving forward.

🔥 How To Time The Market: Become Rich With Ethereum!In this analysis I want to discuss a way to time the market. Or more precise: to time the next ETH market bottom.
We don't have a lot of trading data to look at, but we have 2 instances where this strategy has worked. The strategy is simple: buy Ethereum once the weekly RSI is below 30 and enjoy the ride.
Every single time that ETH has reached oversold, this was the bear-market bottom for the cycle and ETH pumped.
Make your life easier and put an alert on your chart. Might take a few years for the alert to hit, but at least you're going to be prepared.
Next time you will actually buy the bottom instead of selling it with this simple trick.
