Strategy 2025. Introducing Palantir, BTC Killer Of The Year 2024It's gone 3 months or so since Palantir stock has joined on Friday, September 20 Stock Top Club, also known as S&P 500 stock index SP:SPX .
Palantir was one of the strongest contenders for inclusion in the broad market S&P500 Index.
This inclusion, as well as Dell (DELL), came after tech companies Super Micro (SMCI) and Crowdstrike (CRWD) also joined the index earlier in this year 2024.
Since that, Palantir stock became the best (i.e. #1) S&P500 index performer this year, with current +375% YTD return in 2024, being highlighted at 80.55 USD per share - the new all the history peak reached last Friday, December, 19 at regular session close.
What is most important also, even recent Federal Reserve (The US Central Bank) hawkish projections on monetary policy in 2025 were not able to stop the only game in the city, or even make a pause on Palantir leadership.
Since Palantir stock is rallying 7th month in a row, the stalkers remain decently far away, swallowing the galactic dust of Palantir shares.
Judge for yourself.
One of the nearest pursuer, Nvidia Corporation NASDAQ:NVDA (# 4 out of all S&P500 index performers in 2024) is nearly to finish the year of 2024 with +170% return, i.e. lagging against Palantir behind twice.
The quite similar things happen with the most popular and heavy c-coin, also known as Bitcoin BITSTAMP:BTCUSD that is currently +130% YTD return in 2024.
What is most important also, Palantir stock outperforms both - S&P500 index, Nvidia Corp. and Bitcoin 7th straight month in a row.
In human words that means, Palantir stock monthly returns (every single month from May to December 2024) were better against each of mentioned above assets.
What is Behind this?
On November 4, 2024 Palantir Technologies has announced financial results for the third quarter ended September 30, 2024.
“We absolutely eviscerated this quarter, driven by unrelenting AI demand that won’t slow down. This is a U.S.-driven AI revolution that has taken full hold. The world will be divided between AI haves and have-nots. At Palantir, we plan to power the winners,” said Alexander C. Karp, Co-Founder and Chief Executive Officer of Palantir Technologies Inc.
Q3 2024 Highlights
• U.S. revenue grew 44% year-over-year and 14% quarter-over-quarter to $499 million
• U.S. commercial revenue grew 54% year-over-year and 13% quarter-over-quarter to $179 million
• U.S. government revenue grew 40% year-over-year and 15% quarter-over-quarter to $320 million
• Revenue grew 30% year-over-year and 7% quarter-over-quarter to $726 million
• Closed 104 deals over $1 million
• Customer count grew 39% year-over-year and 6% quarter-over-quarter
• GAAP net income of $144 million, representing a 20% margin
• GAAP income from operations of $113 million, representing a 16% margin
• Adjusted income from operations of $276 million, representing a 38% margin
• Rule of 40 score of 68%
• GAAP earnings per share (“EPS”) grew 100% year-over-year to $0.06
• Adjusted EPS grew 43% year-over-year to $0.10
• Cash, cash equivalents, and short-term U.S. Treasury securities of $4.6 billion
• Cash from operations of $420 million, representing a 58% margin and $995 million on a trailing twelve month basis
• Adjusted free cash flow of $435 million, representing a 60% margin and over $1 billion on a trailing twelve month basis.
Is the stock growth fundamentally deserved? Definitely, "Yes".
Palantir stock Alpha
What is Alpha?
Alpha (a) is a term used in investing to describe an investment's ability to beat (outperform) the market, or its “edge.” Alpha is thus also often referred to as excess return or the abnormal rate of return in relation to a benchmark, or any other asset (even against simple sitting in a cash) when adjusted for risk.
The main graph represents a comparison across Bitcoin and Palantir stocks. Since Palantir outperforms BTC twice over the past 12 months (watch lower "percent bar chart" subgraph), so why isn't to continue the play, by staying in a long with Palantir, and kill "the new oranges" respectively.
Strategy

DOA trading Strategy - AAPL#AAPL - Red DOA meter and Sniper fired, we're rejecting at LH and created a nice 3rd point like SPY

USD/JPY: Will the Fed or BoJ Dominate the Tug of War?The USD/JPY exchange rate has shown both resilience and vulnerability in recent trading sessions, shaped by competing factors from monetary policy shifts to global economic developments. On the positive side, the U.S. dollar remains underpinned by Federal Reserve rate decisions, with market expectations of steady rates in the near term supporting its strength. Tariff threats from the U.S. administration further bolster the dollar’s safe-haven appeal, particularly as external economic pressures persist. Additionally, the pair has demonstrated an ability to recover from lower levels, such as rebounding to 155.50 during Tuesday's Asian trading, aided by softer Japanese service-sector inflation data. However, the Japanese yen has also gained momentum due to the Bank of Japan’s recent 25 basis point rate hike, which reflects a confident stance on inflation and wage growth trends. This decision has increased the yen’s attractiveness as a safe-haven asset, exacerbating pressure on the USD/JPY pair, particularly as global uncertainties and shifts in risk sentiment encourage investors to diversify into safe havens like the yen and the Swiss franc. Market sentiment surrounding U.S. economic vulnerabilities, including concerns over tariffs and a potential dovish shift by the Federal Reserve, has further weighed on the dollar. Traders are now pricing in a 50 basis point rate cut by the Fed later this year, a factor that could erode the dollar’s appeal if realized. Overall, while USD/JPY has displayed moments of strength, the competing influences of U.S. dollar dynamics, Japanese yen strength, and global market sentiment create a volatile environment where traders must remain vigilant of economic data and central bank decisions.

MSFT Microsoft Corporation Options Ahead of EarningsIf you haven`t bought MSFT when they reported 49% stake in OpenAI:
Now analyzing the options chain and the chart patterns of MSFT Microsoft Corporation prior to the earnings report this week,
I would consider purchasing the 430usd strike price Calls with
an expiration date of 2025-2-21,
for a premium of approximately $15.35.
If these options prove to be profitable prior to the earnings release, I would sell at least half of them.

Time to "ZOOM" back to winnings ways?On Thursday afternoon, the King Trading Momentum Strategy triggered alongside eleven other alerts, followed by five more on Friday. This flurry of signals doesn’t exactly indicate a “bearish” sentiment, but as always, the market has its unpredictable ways! With markets approaching all-time highs, I’ve been cautious, limiting my positions to just a few with low allocations in TNA, ADBE, PYPL, and XYZ.
When I analyzed Zoom (ZM), I noticed that it experienced a strong rally from July through the end of the year, gaining over 50%. Now, the key question is: has it finished consolidating, or is there more downside ahead?
Looking back to July, ZM’s performance suggests a classic bull flag pattern. It’s retraced to the 38% Fibonacci level, and during a two-hour window when the signal fired, the impressive “wick” formed caught my attention. Now, after a short-term pump, it’s retracing again, and I’m eyeing the 50% Fibonacci level as a potential entry point.
Unless Monday brings a major selloff due to concerns over the Fed meeting on Wednesday or the PCE data on Friday, I’ll likely use the usual morning volatility to position myself in this trade. Let’s see how this one unfolds!
The King Trading Momentum Strategy employs a robust combination of indicators: the 5 EMA crossing above the 13 EMA, RSI strength, favorable momentum measured by ADX+, and MACD confirmation. ZM, along with over 100 other equities, is integrated into this script with optimized backtested take-profit and stop-loss levels. Activating these parameters is as simple as checking a box (they’re off by default), making this strategy both powerful and user-friendly.

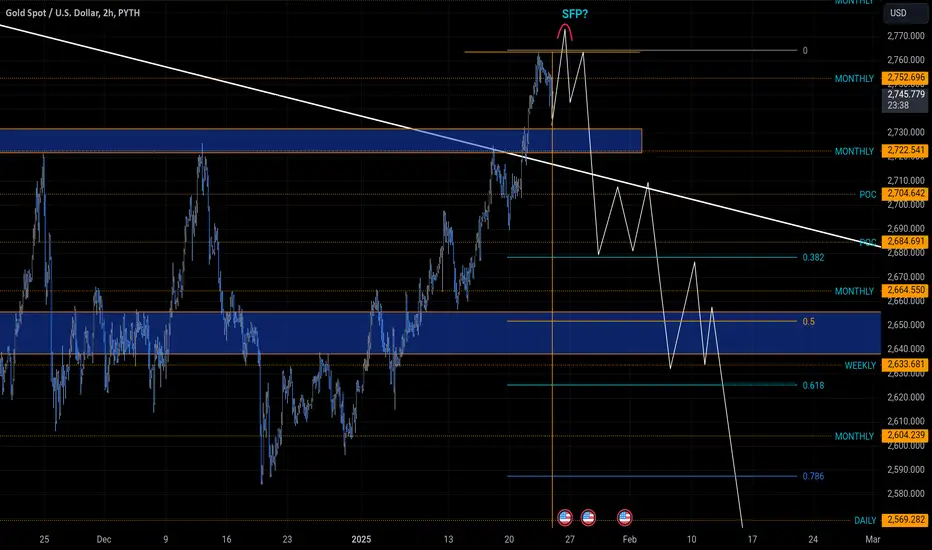
Scenario on XAUUSD 23.1.2025 [update]This analysis will only be about adjusting the level from the previous analysis, because my longivy setup turned out better than I expected, but now the question is what will happen next, I personally would like the scenario as I displayed it with sfp above high and then a proper correction to lower levels is important sr the level is at the price of 2730, if the market holds it then there could be a movement of gold to a new ath, but if this level were to break, my scenario would be fulfilled
SHOP Go Long! Will it break out this time?Recently SHOP has retraced and held the 50% Fib level and has been trading within a channel where it is about at the mid point of it. The King Trading Momentum Strategy yesterday issued a buy signal. This strategy combines the 5 EMA crossing above the 13 EMA, RSI strength, favorable momentum as measured by ADX plus evaluating recent volume changes. It has been forming a bull flag on the hourly and pre-market suggests this may be ready to break out. I followed the signal and bought a half position, looking to protect the trade at take-profit of 4%. During backtest this proved to be an optimum area and a stop-loss of 3% is warranted. SHOP and over 100 equities are built into this script. If trade protects at 4%, a trailing stop-loss of 2% will be adhered to in order to lock in as much profit as possible if this stock breaks out of the descending channel! I'm thinking its not too late for me to add to this position given typical morning volatility.

GBP/USD: BOE Is Ready for the Big Cut!GBP/USD shows mixed signals, remaining below 1.2350, influenced by economic and political factors in both the UK and the US. After a strong rally on Monday, the pair lost momentum on Tuesday, driven by the recovery of the US Dollar and overall disappointing UK labor market data. The rise in the unemployment rate to 4.4% and a slowdown in employment growth weigh on the Pound, despite an annual wage increase of 5.6%. From a technical perspective, the RSI on the 4-hour chart signals a loss of bullish momentum, approaching the neutral level of 50 after being in the overbought zone. Key support levels are located at 1.2230 and 1.2200, while resistances are seen at 1.2350.
The Pound is also affected by an uncertain macroeconomic context, with Trump's comments indicating potential tariffs on China, Mexico, and Canada, supporting a recovery in the Dollar due to its safe-haven status. In the absence of significant US economic data, investor focus shifts to stock market performance: a negative opening on Wall Street could support the Dollar, exerting additional bearish pressure on GBP/USD. In the short term, the pair may remain under pressure, with a potential test of key support levels, unless more solid signs of Pound strength or Dollar weakness emerge.

VZ Verizon Communications Options Ahead of EarningsIf you didn’t exit VZ before the selloff:
Now analyzing the options chain and the chart patterns of VZ Verizon Communications prior to the earnings report this week,
I would consider purchasing the 38.50usd strike price Puts with
an expiration date of 2025-1-31,
for a premium of approximately $0.68.
If these options prove to be profitable prior to the earnings release, I would sell at least half of them.

USD/JPY Under Pressure: Yen Strengthens Amid Bearish MomentumThe USD/JPY pair exhibits a clear bearish inclination, driven by a combination of economic and market factors that are strengthening the Japanese Yen and weakening the US Dollar. Currently, the pair has dropped to approximately 155.60, recording a 0.44% loss for the day, with sellers evidently attempting to push the price further toward critical support levels between 154.90 and 153.15. The downward pressure is amplified by rising expectations of a rate hike by the Bank of Japan, further supported by recent positive data such as improvements in Japan’s core machinery orders, signaling a recovery in capital expenditure. Simultaneously, uncertainty surrounding the economic policies of the Trump administration contributes to a negative climate for the US Dollar, which is already under pressure from a recent slowdown in buying flows.
From a technical perspective, the pair has encountered significant resistance in the 156.55-156.60 region, a level that halted previous recovery attempts and now acts as a key barrier. For a meaningful trend reversal, a sustained breakout above this resistance, followed by consolidation above 157.00, would be necessary to pave the way toward recent highs at 158.00 or even 158.85. However, the likelihood of a downward breakout seems more tangible, considering that the support at 155.25 represents the last defense before a drop toward the psychological level of 155.00 and further toward 154.60 and 153.30.
The current market environment, characterized by reduced trading volumes due to Martin Luther King Jr. Day in the US, suggests caution for traders, as dynamics could quickly shift with the return of liquidity and the announcement of potential monetary or political decisions in both Japan and the US. The combination of positive economic data for Japan and expectations of higher rates positions the Yen in a place of strength, while the Dollar may continue to struggle without a clear positive catalyst. Holding below 155.00 would be a significant signal for bears, indicating an extended downward trajectory toward deeper support levels.

NIFTY-50 analysisNifty 50 now has a strong support level at 23050-23240 and a resistance on the upper side at 23400. If 23400 breaks, the upper level targets are 23605 to 23779. And if the 23050 support breaks, the lower side support levels are 22650 - 22250. This is just my view on the market.!!

DOTUSD Plunge Alert Precision Short Targeting 10%+ Gains !The asset, DOTUSD, is showing a sharp bearish momentum with a decline indicating strong selling pressure.
The current price is 6.905, while the short entry position aligns with a retracement after a peak profit zone
1. Trend Direction
The price has broken below green channel, signaling a trend reversal from bullish to bearish.
Red zones around the moving averages confirm the presence of downward momentum.
2.Entry Confirmation
The short position appears to be placed after the market failed to hold its highs (Peak Profit 10.14%) and created lower highs, validating the short trade setup.
Entry aligns with the rejection of resistance levels, suggesting a good risk-to-reward setup.
3. Risk Management
Stop-loss is placed slightly above the sell zone, covering the recent swing high. This limits risk in case of price retracement.
The profit target extends well below the entry, suggesting confidence in further downside potential.
4. Aetos Indicators
A potential momentum-based or moving average indicator is being used to highlight peak profit areas, confirming optimal trade execution.
The bearish engulfing candles in the sell region validate the short bias.
Projection
Target Zone: The profit target aligns with the 6.230 support level, indicating expectations of a 10% drop from the entry point.
Downside Risk: If bearish momentum continues, there could be a breakdown below 6.230, extending losses toward 6.000 or lower.
Analysis
DOTUSD is experiencing a sharp bearish reversal after failing to hold its highs. The short entry capitalizes on lower highs and rejection near the resistance. Stop-loss is strategically placed above recent highs, while the target aligns with key support levels. This trade setup is supported by
Bearish momentum.
Clear breakdown below the moving average channel.
High risk-to-reward ratio for short-term traders.
Strategy
Stay short below 6.905, targeting 6.230. If price retraces above 7.00, consider exiting the position. Always book profits partially and move SL to BE

SPX: MTF Cluster Support at 5,810 with EMA Confirmation StrategyCurrent Technical Setup
The SP:SPX is testing a significant cluster support level at 5,810, identified by FibExtender Pro with multiple timeframe confluence. The price has shown a clear reaction at this level, making it a potential launching point for a bullish move.
Entry Conditions
Primary Triggers Required:
8 EMA crossing above 34 EMA on 30-minute chart (currently bearish)
Price breaking above last swing high at 5,850
Price holding above cluster support at 5,810
Price Targets
First target: 6,000 (psychological level and major cluster resistance - 4 levels)
Second target: 6,170 (cluster resistance - 3 levels)
Risk Management
Stop Loss Parameters:
Place stops below 5,810 cluster support
Exit if price fails to hold above EMAs after entry
Cancel setup if entry triggers aren't activated
Timeframe Analysis
30-Minute Chart:
Currently bearish configuration
8 EMA below 34 EMA
Waiting for bullish crossover and Price breaking above last swing high at 5,850
Weekly Chart:
Strong bullish structure
Moving averages stacked positively
5,810 cluster support adds confluence
50 EMA > 200 EMA (bullish)
Time-Based Considerations
The January 13 time cluster provides an additional layer of confluence for potential trend reversal. This timing aligns with Fibonacci principles suggesting higher probability setups when time and price zones converge.
Special Notes
The mixed signals between timeframes require patience. The weekly chart provides a strong bullish foundation, but entry must wait for 30-minute confirmation signals to align. The setup becomes invalid if price breaks below cluster support without triggering entry conditions.

XAU/USD Analysis: Gold's Bullish Momentum Eyes $2,790The analysis of XAU/USD highlights a strong bullish momentum in the short term, with gold prices reaching a one-month high above $2,700 on January 16, 2025. This rally was supported by contrasting U.S. economic data: while consumer spending showed strength, the increase in unemployment claims contributed to a decline in U.S. Treasury yields, enhancing gold's appeal as a safe-haven asset. Optimism regarding a possible Federal Reserve rate cut, driven by cooling inflation, has further strengthened positive sentiment toward gold, which has posted three consecutive sessions of gains. From a technical perspective, the breakout above the key resistance level of $2,697 opens the door to a potential target of $2,740, reinforcing the current bullish trend. However, traders remain focused on upcoming economic events, including the Federal Reserve's rate decision at the end of January and the release of CPI and Non-Farm Payrolls data in early February, which could significantly impact market sentiment. Expectations suggest that a potential rate cut or weak macroeconomic data could continue to support gold prices, while signs of economic strength or a rate hike might trigger bearish pressure. In the medium term, gold could fluctuate between $2,650 and $2,800, with the market remaining sensitive to monetary policy developments and inflation dynamics. In the long term, potential geopolitical stabilization and a global economic recovery could reduce interest in gold as a safe-haven asset, bringing prices to a range between $2,500 and $2,600.

The Prop Trader’s Secret: How to Trade for Real MoneyTrading for Profit vs. Trading to Make Money
There’s a critical difference between trading to be profitable and trading to make money. While they may seem like the same thing, they’re not—and as a trader, you must decide which approach you want to take. If your goal is to be a prop trader who actually makes money, here’s 3 ways you shift your mindset and strategy.
1. Make Frequent Withdrawals
Traders focused on making money consistently withdraw profits. I learned this the hard way during my early trading days, seven years ago. Back then, I was obsessed with being "profitable." My focus was on hitting arbitrary profit targets—green months, green quarters, and a green year. While that mindset works for hedge funds, it’s not ideal for prop traders.
To succeed in the prop trading space, you need to prioritize frequent withdrawals.
Hit a strong run and make 2.5%? Withdraw.
Have a profitable day and the withdrawal window opens tomorrow? Even if you’re only up 1%, withdraw.
Frequent withdrawals create a feedback loop: the more often you secure profits, the more motivated and disciplined you’ll be to continue nailing winning trades. Prop trading comes with inherent uncertainty, so obsessing over 10% profit targets or arbitrary milestones only sets you up for disappointment.
2. Follow the 1-1-1 Rule
Stick to the 1-1-1 rule:
Take 1 trade per day.
Risk 1% per trade.
Focus on 1 financial instrument.
Adhering to this rule will transform your trading. You’ll avoid overtrading, reduce your exposure to losing streaks, and eliminate the emotional tilt that often leads to blowing accounts.
This discipline has kept me consistently profitable over the years. Whether you’re trading GBPUSD, EURUSD, XAUUSD, or US30, pick one instrument and master it. The path to trading success is as much about mastering yourself as it is about mastering the market.
3. Focus on Small Risk-to-Reward Ratios (R:R)
Small R:R trades may not sound exciting, but they’re the backbone of consistent profitability. Catching a 1:10R move might feel like the ultimate trading achievement, but are you here to be "profitable" or to make money? Make up your mind.
Most traders chase high R:R setups, only to give back 80% of their gains after one emotional mistake. Instead, focus on smaller, attainable targets:
Learn to consistently spot 1:2, 1:3, and occasionally 1:4 R setups.
On a $200k account, a single 1:3R trade at 1% risk generates $6,000.
After locking in a winning trade, withdraw your profits and repeat the process. Over time, these smaller, consistent gains will make you far richer than grinding for massive R:R setups and risking it all in the process.
The Bottom Line
Prop trading is about discipline, consistency, and the ability to extract real money from the markets—not just hitting arbitrary profit goals. By making frequent withdrawals, following the 1-1-1 rule, and focusing on attainable R:R setups, you can trade with confidence, avoid burnout, and get make real money! Isn't that why we're all here?
Happy Trading

XRP is flying. How much further?I published this chart a few weeks ago showing the potential for a gorgeous fratcal that's appearing for XRP. Do we dare to dream to see if reach three figures as we continue to soar? There's a few other alternatives that I'll also share some ideas around. But, this could be the best uptick we've seen from any coin... ever.. Good luck and follow and share for more.

WFC Wells Fargo & Company Options Ahead of EarningsIf you haven`t bought WFC before the breakout:
Now analyzing the options chain and the chart patterns of WFC Wells Fargo & Company prior to the earnings report this week,
I would consider purchasing the 70usd strike price Puts with
an expiration date of 2025-3-21,
for a premium of approximately $2.82.
If these options prove to be profitable prior to the earnings release, I would sell at least half of them.

EURUSD: Pullback before the crash!The EUR/USD continues its downward trend, recently touching a new cycle low around 1.0176 as the US Dollar maintains its relentless rally, fueled by rising expectations that the Federal Reserve will keep interest rates elevated for an extended period. The Greenback’s strength has been amplified by a fifth consecutive bullish session, with the DXY surpassing the critical 110.00 level. Investors have sharply revised their outlook on Fed policy, reducing the probability of significant rate cuts in the near term. This shift in sentiment follows a robust Nonfarm Payrolls report and hawkish remarks from Fed officials, emphasizing the priority of taming inflation before contemplating further easing.
On the policy front, while the Fed recently trimmed its benchmark rate to 4.25%-4.50%, Chair Powell’s cautious tone during the final press conference of 2024 left markets in little doubt that any future rate cuts will be gradual. Powell underscored the need to anchor inflation closer to the 2% target and pointed out that despite some softening, the labor market remains resilient. This narrative has bolstered USD demand and widened the divergence with the European Central Bank’s stance.
In contrast, the ECB faces mounting pressure to sustain its easing cycle amid a deteriorating economic outlook across the eurozone, particularly in Germany, where industrial performance has been lackluster. Despite a marginal rise in inflation figures for December, ECB policymakers seem committed to prioritizing growth over inflation control in the short term. This divergence in central bank policies has created a headwind for the euro, further weakening EUR/USD and increasing the likelihood of a test of parity.
Adding to the complexity, potential trade policy shifts under the incoming US administration could inject additional volatility. Proposals for renewed tariffs could stoke inflationary pressures in the US, compelling the Fed to adopt a more aggressive tightening stance. Such a scenario would exacerbate the euro’s struggles, as a stronger USD and continued ECB easing would widen the interest rate differential between the two economies.
Looking ahead, the focus will remain on key data releases, including US CPI and Retail Sales, alongside eurozone Industrial Production and German inflation data. These reports will offer crucial insights into the respective economic trajectories and may set the tone for future price action. However, in the current context, the EUR/USD appears poised to remain under pressure as the fundamental backdrop heavily favors the Greenback. Until there is a significant shift in economic or policy expectations, the pair may continue its march towards parity.

top 8 simple steps to successful trading
1- Determining the trend
Before looking for entry points, it is important to clearly determine whether the market is in a trend or a sideways movement (flat). After all, it is in the continuation of the trend that signals usually work best.
Moving averages (EMA) and other trend indicators help to visually understand whether the price is rising, falling or “sleeping” in a sideways trend.
Regression channels and Bollinger Bands can further clarify the direction of movement and market volatility.
An example of trend visualization:
In this screenshot we can see how the moving averages are located above each other (bullish trend) or below each other (bearish trend). This is the first step: to understand where the river is “flowing”.
2- Identify levels and zones of interest
Support and resistance levels are a fundamental element of technical analysis. Prices often “walk” from one level to another, and large volumes visible in the horizontal profile of the market signal zones of interest for players.
Support/resistance levels are formed based on historical price extrema.
The horizontal profile of volumes shows where the greatest buying/selling activity is located.
Market participants' stop-losses (approximate levels) help to understand where a liquidity spike may occur.
Example of defining levels:
On the screenshot we can see the highlighted price areas and horizontal volume levels, which are worth paying attention to in order to find an entry.
3. finding entry points
When the trend is already defined and the main levels and zones of interest are marked, it is time to look for specific entry points. This is where signals from smart technical analysis indicators are especially important:
Smart signals help you recognize the beginning of a trend movement or a possible reversal.
Evaluating the strength of signals gives you an idea of the reliability of the current pattern according to many criteria (for example, on a trivial scale from 1 to 10).
Built-in technical analysis (“auto-trading” or “auto-marketing”) can confirm your observations.
An example of searching for an entry point:
In this example, you can see how buy signals (Long) appear at the moment of the beginning of an upward impulse when bouncing off supports.
4. Confirm the set-up with additional factors
There is no Golden Grail, so it is always desirable to have as many confirming factors as possible. These can be divergences, indicators of buyer/seller pressure, as well as signs of manipulation by big players.
Divergences in several indicators (RSI, MACD, etc.) often foreshadow a trend reversal or slowdown.
Buyer/seller pressure shows who controls the current market (bulls or bears?).
Manipulations by big players form false breakdowns, reversals and “knocking down stops”.
Example of setup confirmation:
On the screenshot you can see an example of divergence, as well as areas where, judging by the volumes, there was obvious activity of the “big hand”.
5. Confirming the trend we have identified via Midas Up
After the first trend analysis, it is useful to double-check it with additional indicators. There may be new signals of reversal or impulse movement that we missed.
Money supply movement: figure out how active the participants are and in which direction the volumes are flowing.
Trend tape and oscillators: filter market noise and confirm the start/end of a momentum move.
Price momentum: Often heralds powerful upward or downward spurts.
An example of a trend confirmation:
Note how several indicators confirming the same direction are combined in the screenshot.
6. Analyzing the behavior of large players
Large players (market makers, funds, etc.) have money and influence enough to significantly change the price. Observing their actions is one of the key aspects of successful trading.
The pressure of the big players shows who is entering the market and in what volumes.
Large whale buys/sells indicate points where significant liquidity is exchanged.
Whale buying/selling in the market confirms a powerful price movement.
Example of major player analysis:
In the screenshot we can see indicators of large trades, which often become triggers for reversals or acceleration of the movement.
7. Confirm the entry point by analyzing the current momentum
Even after knowing the general trend and observing the activity of big players, it is important to evaluate the moment of entry itself - especially when the market has already started moving in the chosen direction or is slowing down.
Pulse reversal points indicate the optimal moment to enter or exit.
Evaluation of the signal strength level (for example, 6 out of 10 or 9 out of 10) indicates the probability of successful execution.
The built-in technical analysis can additionally generate “Long” or “Short” signals.
Example of impulse analysis:
You can see how the combination of signals (candlestick patterns, volumes, indicators) indicates a possible long upward impulse.
8. Confirm the setup with additional factors
If one indicator gives a signal, it does not always guarantee a profitable trade - you need to look for confirmation from different sources. Here we can use:
Volume candlestick detailing - determining the true strength of the movement.
The weighted average price helps to smooth out sharp fluctuations and better navigate the trend.
Overheating by oscillators (RSI, Stoch) warns of a possible correction.
Example of additional factors:
In the screenshot we can see how several indicators of overheating and volume simultaneously indicate a high probability of correction, which can save from false entry or late entry into the market.
Conclusion
Consistent market analysis is a step-by-step process that requires a comprehensive approach:
We identify the trend and try to trade in its direction.
We look for key levels and zones with high liquidity and increased attention of big players.
Find entry points based on smart signals, candlestick patterns and volumes.
Confirm the set-up using factors like divergences, activity of big players and buying/selling pressure.
We double-check the trend with indicators, analyze the dynamics and momentum of the movement.
We study the behavior of major players, because they are the ones who form the main market movements.
We confirm the moment of entry by analyzing the current momentum and strength of signals.
We add finishing touches - analyze volumes, market overheating by oscillators and other factors.
Use various tools in a complex - and then the probability of closing a deal with a profit will increase significantly.
Have a good trade!

GBP/USD Holds Key Level Amid US Data WatchCurrently, GBP/USD is attempting to hold above the 1.2500 level after hitting an intraday high of 1.2575, but pressure from a strengthening US Dollar, driven by positive economic data, has capped further gains. A sustained move above this level could pave the way for new bullish targets, with the first resistance area at 1.2620-1.2630, corresponding to the 61.8% Fibonacci retracement, followed by 1.2700, which aligns with the 78.6% retracement level. On the downside, the first significant support stands at 1.2302. The recent strength of the Pound has been supported by broad-based USD weakness earlier this week, driven by improved market sentiment, which reduced demand for the greenback as a safe-haven currency. However, risk flows could be influenced by upcoming US macroeconomic data. Traders are focused on December’s ISM Services PMI and JOLTS job openings data. A reading above 50 has strengthened the Dollar, signaling expansion in the services sector.

STZ Constellation Brands Options Ahead of EarningsIf you haven`t sold STZ before the previous earnings:
Now analyzing the options chain and the chart patterns of STZ Constellation Brands prior to the earnings report this week,
I would consider purchasing the 230usd strike price Calls with
an expiration date of 2025-1-17,
for a premium of approximately $2.07.
If these options prove to be profitable prior to the earnings release, I would sell at least half of them.

Brent Oil Poised for a Rally!Brent crude prices are currently influenced by a combination of strong geopolitical and climatic factors. At present, WTI is trading around $73.30 per barrel, nearing its highest levels since October 2024, as investors closely monitor the potential impact of colder weather in the United States and Europe. Seasonal demand for heating oil is expected to rise, providing additional support to crude prices. Simultaneously, China’s economic policy plays a crucial role in shaping the global energy market, given its status as the world’s largest crude importer. Recent stimulus measures announced by Beijing, including ultra-long-dated treasury bonds and initiatives to boost investment and consumption, have heightened expectations for increased fuel demand. Support from the People’s Bank of China, which anticipates a potential interest rate cut in 2025, along with the Shanghai Stock Exchange’s commitment to further open capital markets to foreign investors, strengthens the country’s economic recovery outlook.
In addition to these dynamics, the outlook for Iranian exports remains a critical factor for the Brent market. Goldman Sachs forecasts a decline in Iranian production by approximately 300,000 barrels per day by the second quarter of 2025, lowering the country’s total output to 3.25 million barrels per day. This drop is attributed to the anticipated tightening of sanctions under the new Trump administration, which could curtail global supply and support higher prices. The combination of rising seasonal demand for heating oil, growing demand from China, and reduced Iranian supply could sustain an upward trend in Brent prices in the short to medium term. However, it remains essential to closely monitor geopolitical developments and major central bank policies, as any significant changes could alter the current outlook.

