STRAXUSDT Forming Descending WedgeSTRAXUSDT is showing strong technical potential as it forms a classic descending wedge pattern on the chart. This pattern is typically viewed as a bullish reversal signal, suggesting that the downtrend may be nearing exhaustion and a breakout to the upside is likely. With the price compressing within the wedge and volume remaining steady, STRAX appears to be coiling for a major move. The current market structure indicates a high-probability setup with an expected gain of 90% to 100%+ if a breakout occurs above the wedge resistance.
Descending wedge formations are often found at the end of bearish trends, where sellers begin to lose momentum and buyers start stepping in. As price action narrows, the likelihood of a strong bullish breakout increases, especially when volume starts to rise. STRAXUSDT has been respecting this structure with consistent lower highs and lows, but it is now approaching a critical level where momentum could flip decisively bullish.
Investor interest in the STRAX project is also picking up, adding fundamental support to this technical setup. The STRAX ecosystem, known for its flexible blockchain development and support for enterprise-grade applications, has remained active despite broader market volatility. This growing attention from the crypto community, combined with the favorable chart pattern, adds confidence to the bullish outlook.
If STRAXUSDT breaks above the descending wedge resistance with confirmation, it could trigger a powerful rally toward higher price levels. Traders watching this setup may find an excellent risk-to-reward opportunity, especially with a solid structure and growing momentum behind it.
✅ Show your support by hitting the like button and
✅ Leaving a comment below! (What is You opinion about this Coin)
Your feedback and engagement keep me inspired to share more insightful market analysis with you!
STRAX
#STRAX/USDT#STRAX
The price is moving within a descending channel on the 1-hour frame and is expected to break and continue upward.
We have a trend to stabilize above the 100 moving average once again.
We have a downtrend on the RSI indicator that supports the upward move with a breakout.
We have a support area at the lower limit of the channel at 0.04263, acting as strong support from which the price can rebound.
Entry price: 0.04262
First target: 0.04311
Second target: 0.04311
Third target: 0.04426

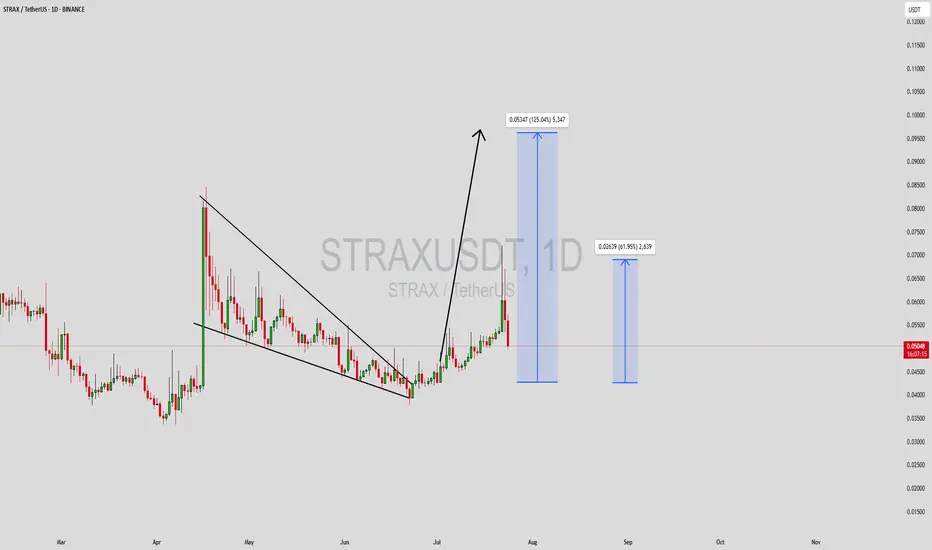
Stratis Reveals A Bullish Bias Across The AltcoinsThe market is set to resume growing, the proof is in the charts. Stratis (STRAXUSDT) was one of the first projects to move strongly after its 7-April low. Here you can see a 150% jump within 10 days.
This type of move always reveals two things. The start of the next bullish cycle and the fact that the bottom is in. Both are one and the same.
Once the bottom hits, only growth is possible or else the bottom is not in. Once a new bullish cycle starts, then there can't be any new lows so the last low present on the chart must be the bottom.
After the initial bullish breakout we get the classic correction, now two months strong. The correction found support at the same level support was found in November 2024.
Here is the interesting part. Stratis was one of the first projects to move strong, seeing it getting ready to produce a new bullish wave, reveals that the market is done with its correction and will resolve to produce rising prices. What one does, the rest follows. Some projects move first though.
This is the signal. It is still very early of course, but that is the advantage we can enjoy by looking daily at the charts.
I will do a short-term trade-signal for this pair.
Thank you for reading.
Your support is appreciated.
Namaste.

#STRAX/USDT#STRAX
The price is moving within a descending channel pattern on the 4-hour frame, which is a retracement pattern
We have a bounce from a major support area in the color EUR at 0.0600
We have a tendency to stabilize above the Moving Average 100
We have an upward trend on the RSI indicator that supports the rise and gives greater momentum, upon which the price depends
Entry price is 0.0610
The first target is 0.0670
The second target is 0.0749
The third goal is 0.0832

Stratis: The Altcoins Bull Market Is HereLet me show you this price pattern and dynamic because it is great, it reveals what is coming to all of the Altcoins available for trading within the Altcoins market.
» Stratis (STRAXUSDT) peaked in December 2024. The same as with the rest of the market.
» After this high a correction developed. This is true for 99% of the trading pairs.
» There was a major low in February 2025. Another low mid-March 2025. Finally, an All-Time Low happened on the 7th of April. This is true for many other Altcoins with some variations.
» After the 7-April market low, prices started to grow slowly. This is where most of the pairs are right now. No new lows but no signification bullish action either, yet.
» Now, STRAXUSDT produced a strong bullish breakout just start. This will be true for the entire market and all those pairs that you requested through Your Top Altcoins Choice.
» STRAXUSDT is now up 110% since the 7-April low and 73% within the last 48 hours. A strong bullish breakout yesterday. This is only the start.
It will be an awesome bull market —life changing.
Namaste.

STRAXUSDT (Stratis) Updated till 20-12-24STRAXUSDT (Stratis) Daily timeframe range. its holding decently here.
PA trying to get a close over 0.07540. a valid close can push it to 0.09874 or above. but it need to stay above 0.05686. which is recent support.

#STRAXUSDT Bullish Breakout: Aiming for 220% Gain!#STRAX is currently breaking out above the 35 EMA and the resistance trendline. With only 8 hours and 28 minutes left until the daily candle closes, STRAX must close above the resistance trendline for bullish confirmation.
The price is within the accumulation range, and a rally toward the primary resistance at $0.573 is likely.
In a bearish scenario, accumulating STRAX between $0.0345 and $0.0436 could be considered a worthwhile buying opportunity.
Key levels:
- Confirmation: A breakout above the 35 EMA and resistance trendline.
- Accumulation: $0.0345 to CMP.
- Lower Support: All-time low at $0.0345.
- Primary Resistance: $0.0573.
- Targets: $0.0573, $0.0741, $0.0937, $0.1103, $0.146.
DYOR, NFA.
Like, share, and follow for more.
Thank you.
#strax #cryptocurrency

#STRAX/USDT#STRAX
We have a bearish channel pattern on a 12-hour frame, the price moves within it and adheres to its limits well
We have a green support area at 0.0700 after the price touched it and bounced from it
We have a tendency to stabilize above moving average 100
We have an uptrend on the RSI indicator that supports the price higher
Entry price is 0.0800
The first target is 0.0886
The second goal is 0.0976
the third goal is 0.1068

#STRAX/USDT#STRAX
The price has been trading in a descending triangle since January 2022
And the descending triangle was broken strongly.
Powered by Moving Average fraction 100.
And overselling on MACD
We are now at the first goal 1.277.
Expects a correction to 1.06 before completing the growth.
For the second goal 1.645

#STRAX/USDT#STRAX
The price is moving in a downward channel on a 1-day frame
We have a trend of breaking moving average 100 to the upside
We have a major support area at the 0.800 level
We have a positive divergence on RSI
Entry area 0.917
The first goal is 0.974
The second goal is 1.087
Fourth goal 1.20

STRAX liquidity Wick above 1.4$ will be quick Strax bounced from demand zone and heading to grab the liquidity above 1.4 ,
take a position and chill

Stratis (STRAX) forming a bullish Gartley for the next pumpHi dear friends, hope you are well and welcome to the new trade setup of Stratis (STRAX) coin with US Dollar pair.
Recently we caught almost 190% pump of STRAX as below:
Now on a 4-hour time frame, STRAX has formed a bullish Gartley move for the next bullish reversal.
Note: Above idea is for educational purpose only. It is advised to diversify and strictly follow the stop loss, and don't get stuck with trade.

STRAXUSDT|Trying to buy back the fallHello trader! Today I have a new idea for you. Like and subscribe to the channel, there is a lot of useful information there.✅
After a strong strait, you can try to enter Long with a small volume! 1-2% of the deposit with a leverage of 2-3X.
Deal plan:
Entrance - 0.908/888$
Stop - $827, taking into account the good there will be less stop!
Take - 0.987, fix 50% of the position, stop in used!
Guys, the coin is extremely volatile, be careful and follow your risk management!

Spotting the Highs and LowsSTRAX on the 1-hour chart has shown signs of consolidation post a significant upward rally. The juxtaposition of various technical indicators suggests a mix of bullish and bearish cues, making it imperative to keep an eye on established levels.
Technical Indicators Overview:
Bollinger Bands: The price nearing the upper band often implies strong bullish momentum. However, it can also suggest a potential pullback or consolidation in the near term.
Parabolic SAR : Its position above the price could indicate potential short-term bearishness.
MACD: The closeness between the MACD and Signal lines suggests a lack of decisive momentum in the current phase.
RSI: Being in the neutral zone, it doesn’t hint at immediate overbuying or overselling.
Stochastic Oscillator: Its neutral positioning doesn't provide a definite buy or sell directive.
Fibonacci Retracement Levels:
The proximity to the 0% level indicates recent bullish strength.
The 38.2% and 50% levels will be pivotal in determining if the bullish trend will resume or if a deeper correction is in play.
Probable Scenario:
Given the price's interaction with the upper Bollinger Band and the neutral positioning of both RSI and Stochastic Oscillator, a period of consolidation or minor retracement could be on the horizon. The key will be observing how the price interacts with the aforementioned Fibonacci levels, especially the 38.2% and 50%.
Bullish or Bearish?
The current indicators suggest a cautious bullish stance. Still, vigilance is advised, especially around the crucial Fibonacci retracement levels.

STRAX is about to fall !STRAX has entered a correction phase after its recent climbs.
Now a supply area has been formed and we are expected to move from this supply to demand.
We have not been given good confirmations for a good drop yet, but if you are looking for a position, you can use the invalidation level as a basis for violating this analysis.

Finally Strax Started seems like getting ready for solid gains
formed text book symmetrical triangle in 3 days tf and breaking out incase of successful breakout expecting solid recovery
expecting move towards 2$ In Midterm do not buy without confirmed breakout

strax building up for Massive Breakout Seems Like Getting Ready For Massive Breakout Consolidating In Symmetrical Triangle In 3 Days Timeframe Incase Of Breakout Expecting Massive Bullish Rally In Midterm Expecting Move Towards 1.70$ In Case Of Successful Breakout Wait For Confirmed Breakout for Entry

Strax Testing Crucial Resistance Seems Wanna Break Descending channel In Higher Timeframes Incase Of Successful Breakout Expecting 240 to 260% bullish Rally In Midterm Keep Eyes On For Lower Timeframes Breakout

✳️ Stratis ALTSBTC Recovery Confirmation = Bitcoin CorrectionPatience is key...
More than 30 days of a steep decline, a strong correction, has been recovered in a single day.
This is Stratis on its Bitcoin pair (STRAXBTC).
Notice the super high volume and the massive growth today of 45%.
What one does, the rest follows... It is the turn for the Altcoins vs Bitcoin pairs.
Bitcoin will enter its correction, that's ok we've been waiting for it, we can protect our Bitcoins by moving to the Altcoins and enjoy the ride up, once the Altcoins stop moving we switch back to Bitcoin and win-win all across.
We have plenty of time because this process can take weeks... I shared my warning 24-March, see the chart below:
There is still time though.
Namaste.

$STRAX/#USDT [#Stratis]: Resistance_Breakout_Confirmation SuperT◳◱ We have identified both a Super Trend pattern and a Resistance Breakout on the $STRAX / $USDT chart. Both indicators are signaling a bullish trend, with the Super Trend showing a bullish trend and the Resistance Breakout confirming this trend by showing the price breaking above a key resistance level. Given the alignment of these signals, it may be a good idea to consider entering a long position and targeting higher levels. Our analysis indicates that the key resistance levels are at 0.54 | 0.59 | 0.692 and the major support zones are at 0.438 | 0.386 | 0.284. However, it is important to also consider other factors such as overall market conditions and other technical indicators before making a trade decision.
◰◲ General info :
▣ Name: Stratis
▣ Rank: N/A
▣ Exchanges: Binance, Gateio
▣ Category/Sector: N/A
▣ Overview: Stratis project overview is currently unavailable. I'll try to update this in the upcoming analysis.
◰◲ Technical Metrics :
▣ Mrkt Price: 0.548 ₮
▣ 24HVol: 725,203.725 ₮
▣ 24H Chng: 2.814%
▣ 7-Days Chng: N/A
▣ 1-Month Chng: N/A
▣ 3-Months Chng: N/A
◲◰ Pivot Points - Levels :
◥ Resistance: 0.54 | 0.59 | 0.692
◢ Support: 0.438 | 0.386 | 0.284
◱◳ Indicators recommendation :
▣ Oscillators: BUY
▣ Moving Averages: STRONG_BUY
◰◲ Technical Indicators Summary : STRONG_BUY
◲◰ Sharpe Ratios :
▣ Last 30D: N/A
▣ Last 90D: N/A
▣ Last 1-Y: N/A
▣ Last 3-Y: N/A
◲◰ Volatility :
▣ Last 30D: N/A
▣ Last 90D: N/A
▣ Last 1-Y: N/A
▣ Last 3-Y: N/A
◳◰ Market Sentiment Index :
▣ News sentiment score is N/A
▣ Twitter sentiment score is 0.64 - Bullish
▣ Reddit sentiment score is 0.38 - Bearish
▣ In-depth STRAXUSDT technical analysis on Tradingview TA page
▣ What do you think of this analysis? Share your insights and let's discuss in the comments below. Your like, follow and support would be greatly appreciated!
◲ Disclaimer
Please note that the information and publications provided are for informational purposes only and should not be construed as financial, investment, trading, or any other type of advice or recommendation. We encourage you to conduct your own research and consult with a qualified professional before making any financial decisions. The use of the information provided is solely at your own risk.
▣ Welcome to the home of charting big: TradingView
Benefit from a ton of financial analysis features, instruments and data. Have a look around, and if you do choose to go with an upgraded plan, you'll get up to $30.
Discover it here - affiliate link -

Riding the Bullish Wave with CautionLet's take a look at STRAX! This little crypto gem is currently priced at $0.745, and it's been on a bit of a tear lately. The RSI is currently sitting at a lofty 78.63, which tells us that the asset is overbought and due for a correction. But hey, that doesn't mean the party's over just yet!
When we dive a little deeper, we can see that STRAX is trading above the middle Bollinger band on the 4-hour timeframe, which is a good sign for the bulls. The upper Bollinger band is at 0.680, and the lower Bollinger band is at 0.439. That's a pretty wide range, but it tells us that there's a lot of volatility in this asset.
Speaking of volatility, the Fibonacci retracement levels are worth noting here. The 0 Fibonacci is at 0.508, the 0.5 Fibonacci is at 0.553, and the 1 Fibonacci is at 0.599. These levels can help us identify potential support and resistance levels for the price action of STRAX.
Now, let's talk about volume. The volume oscillator is currently at +44.79%, which is a good indication that there's a lot of buying pressure for this asset. That makes sense, given its recent bullish run. The MACD is also positive, currently sitting at 0.028, which tells us that the momentum is still in favor of the bulls.
But wait, there's more! The Stochastic oscillator is currently at 95, which means that STRAX is seriously overbought right now. That's not necessarily a bad thing, but it does mean that we should keep an eye out for a potential correction in the near future.
Finally, let's take a look at the hourly EMA 50, which is currently at 0.560. That's yet another bullish indicator for this asset, and it suggests that the trend is still in favor of the bulls.
Overall, STRAX looks like it's in a pretty strong bullish trend right now, with a lot of buying pressure and positive momentum. However, it's also overbought and due for a potential correction. As always, it's important to keep an eye on the indicators and price action to make informed trading decisions.
Good luck!

Strax Building Up for Massive Breakout Seems Like Has Already Bottomed Out
Formed & Breaking descending Channel In 2 days Tf Incase Of breakout expecting 160 to 180% bullish Move

Stratis (STRAX) forming a bullish Gartley for upto 35.50% pumpHi dear friends, hope you are well and welcome to the new trade setup of Stratis ( STRAX ) coin with US Dollar pair.
Recently we caught a almost 72% pump of STRAX as below:
Now on a 2-hr time frame, STRAX is about to complete the final leg of a bullish Gartley move for another pump soon.
Note: Above idea is for educational purpose only. It is advised to diversify and strictly follow the stop loss, and don't get stuck with trade
