25.07.25 Morning ForecastPairs on Watch -
FX:USDJPY
CAPITALCOM:DE40
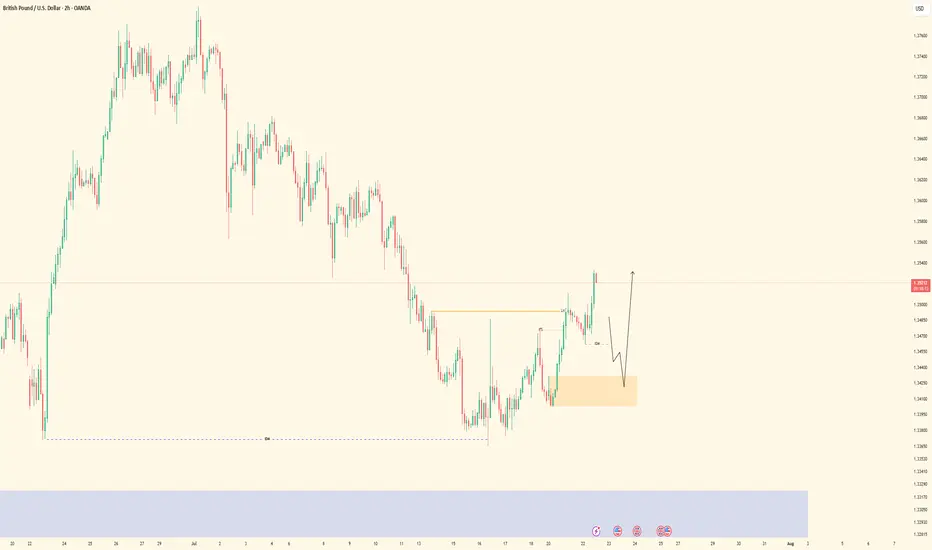
FX:GBPUSD
FX:AUDUSD
A short overview of the instruments I am looking at for today, multi-timeframe analysis down to what I will be looking at for an entry. Enjoy!
Structure

CADJPY - The Bulls Are Stronger than Ever!Hello TradingView Family / Fellow Traders. This is Richard, also known as theSignalyst.
📈CADJPY has been overall bullish trading within the rising wedge pattern marked in red.
This week, CADJPY has been retesting the lower bound of the wedge.
Moreover, the green zone is a strong weekly support.
🏹 Thus, the highlighted blue circle is a strong area to look for buy setups as it is the intersection of the lower red trendline and green support.
📚 As per my trading style:
As #CADJPY approaches the blue circle zone, I will be looking for trend-following bullish reversal setups (like a double bottom pattern, trendline break , and so on...)
📚 Always follow your trading plan regarding entry, risk management, and trade management.
Good luck!
All Strategies Are Good; If Managed Properly!
~Rich
Disclosure: I am part of Trade Nation's Influencer program and receive a monthly fee for using their TradingView charts in my analysis.

XAUUSD Locked In| Waiting for 5M OB SparkPair: XAUUSD (Gold)
Bias: Bullish
Timeframes: 30M / 5M
Gold has followed structure beautifully — top-down alignment from 30M into 5M is clear. Price respected the 30M OB and showed intent, but now we’re approaching the moment of truth.
I’m watching the 5M OB for entry — this is where execution mode activates. No rush. I’m in analysis mode right now, but the shift is coming.
Entry zone is mapped, structure’s in place, order flow is aligned — all I need now is price to do what it always does: respect the blueprint.
Entry Zone: 5M OB
Target: 5M highs
Mindset Note: Patience before the spark. I don’t force entries — I wait for the market to hand me the move it already hinted at. ⚡️

A slight pullback to around 112,000 is expected before a bullishThere is a double top on the daily timeframe. It could pull back to the previous support level that I mentioned in the chart. Moreover, there is a healthy trendline support that can help BTC price bounce.

24.07.25 Morning ForecastPairs on Watch -
FX:GBPCAD
FX:GBPUSD
FX:AUDNZD
A short overview of the instruments I am looking at for today, multi-timeframe analysis down to what I will be looking at for an entry. Enjoy!

USDJPY| - Bullish Setup Loading30M price action remains heavy to the upside. Structure is intact — no lows invalidated. Currently sitting on a refined 30M order block, I’m patiently watching for price to dip back into the zone and sweep short-term liquidity (SSL).
Once that sweep happens and we pull back into the OB, I’ll be looking to ride the bullish momentum:
🎯 First target: 5M highs
🚀 Final target: 30M highs
Feeling confident — just waiting on smart money to confirm it’s time.

XAUUSD| Smart Money Confirmations LoadingBias: Bullish
HTF Overview: Price has just tapped into the 30-minute order flow zone after clearing out sell-side liquidity. This area aligns cleanly with bullish intent and prior structure.
LTF Focus: Currently waiting for lower timeframe confirmation — ideally a clear CHoCH or internal flip. Once smart money confirms this zone with a shift, I’ll look to enter and ride the momentum.
Target: Initial focus is on the 5-minute highs as a short-term objective. While price could continue toward 30-minute highs, structure suggests the recent 5M high is a more immediate and realistic target, making it a smarter move to secure profit around that level.
Mindset Note: Not in a rush — letting price speak first. The confirmation is what separates a guess from a smart move.

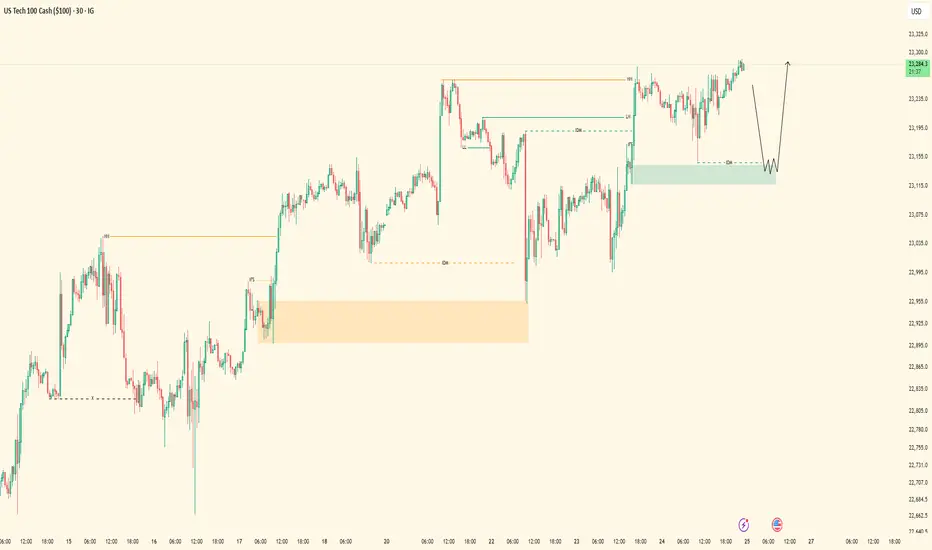
Nasdaq Bullish Flow | 5M OB Execution PendingPair: NAS100
Bias: Bullish
Timeframes: 30M / 5M
Price remains heavy bullish — structure aligning perfectly across the board. Ever since the 30M OB was mitigated, I’ve been following Nasdaq’s order flow step-by-step.
I was watching for full-bodied confirmations inside the 30M zone, but instead, price gave clarity through the lower timeframes. That 5M flip gave away smart money’s intent — showing me exactly where accumulation is happening.
Now waiting for price to tap into the 5M OB to shift into execution mode. This setup has been mapped with precision — no guessing. Once entry presents itself, I’ll follow through.
Entry Zone: 5M OB
Target: 5M highs
Mindset Note: Still in analysis mode — patience until price hits my zone. Smart money doesn’t rush, it accumulates. So do I. 💼
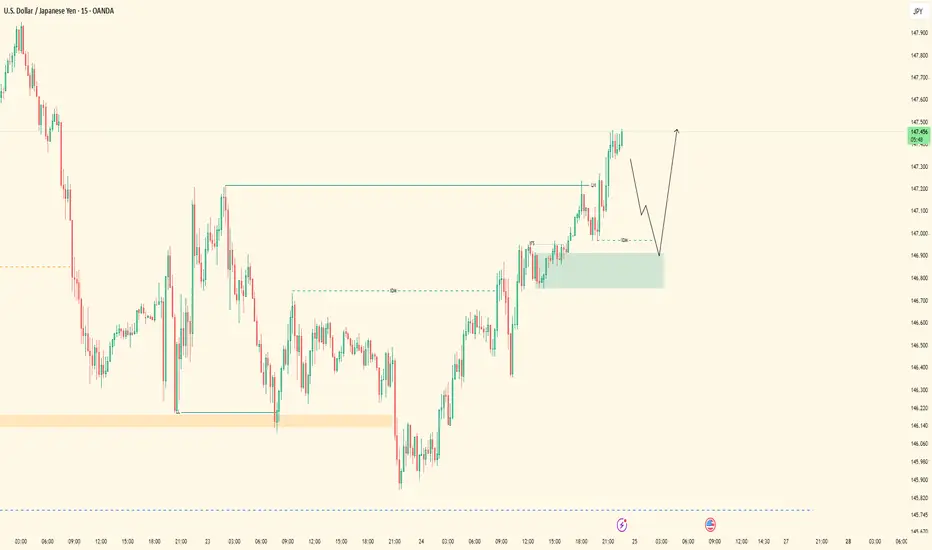
UJ Exexcution Flow| 5M OB Setup in MotionPair: USDJPY
Bias: Bullish
Timeframes: 30M / 5M
Top-down structure respected cleanly across the board — from HTF to LTF, price has been flowing exactly as forecasted. After confirming the bearish LH break and structure flip, we’re now in a bullish leg with intent clearly shown on the lower timeframes.
Currently waiting for price to mitigate the marked 5M order block for precise execution. Entry is valid and backed by structural logic — no guessing, just following what price has already confirmed.
Entry Zone: 5M OB (confirmed after LH break + LTF intent) Target: Clean 5M highs
Mindset Note: Analysis mode done. Execution mode engaged. I let price lead — I just follow structure.
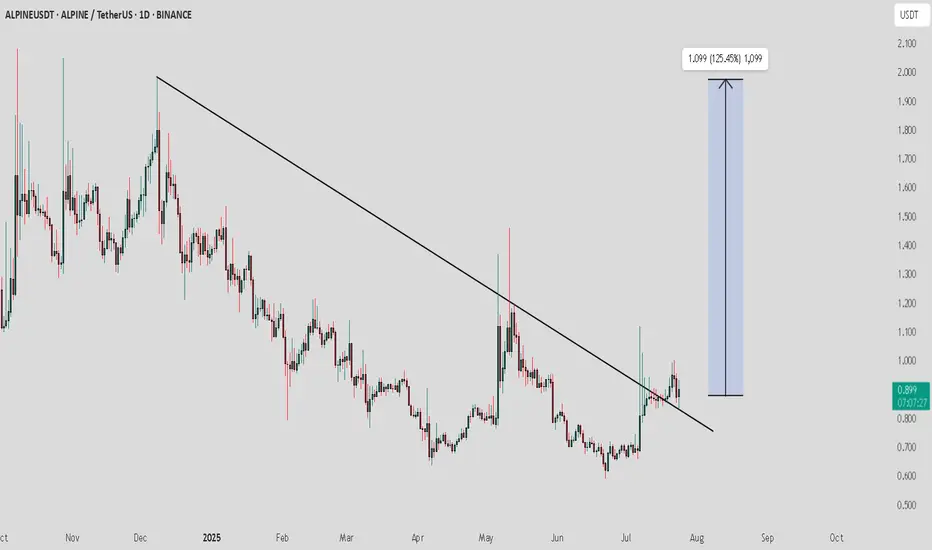
ALPINE / USDT : looking bullish ALPINEUSDT Analysis:
The price is currently retesting the downward trendline. This is a crucial point where the price may either bounce off or fail to hold the trendline, signaling the next major move.
Bullish Scenario:
Trendline Retest and Bounce: If the price holds above the trendline and shows bullish momentum, we could see a rise towards 1.099 (125.45% potential upside).
Confirmation: Look for strong buying volume during the retest to confirm the bounce.
Bearish Scenario:
Trendline Breakdown: If the price fails to hold the trendline and breaks below it, this could trigger a downward move.
Target: Watch for the next support levels to gauge the potential downside.
NASDAQ100| - Bullish Bias RemainsPrice didn’t give me the deep candle retrace into my 30M OB — just a wick tap — but that was enough. That wick shows me smart money touched in.
Dropped to the LTF and got my shift in structure confirming bullish intent.
Now I’m locked in, watching for price to sweep a 5M sell-side liquidity pocket into a clean LTF order block for the next entry.
🎯 Target: Short-term 5M highs
🚀 Bias: Still bullish unless structure breaks
This is a patience game now — execution only after confirmation.

23.07.25 Morning ForecastPairs on Watch -
FX:GBPUSD
CAPITALCOM:DE40
FX:NZDUSD
A short overview of the instruments I am looking at for today, multi-timeframe analysis down to what I will be looking at for an entry. Enjoy!

EURUSD| Back Aligned Bullish - Still in Analysis ModePair: EURUSD
Bias: Bullish
Following price closely and adapting to the market’s rhythm.
Recent structure showed that price is still respecting last week’s key zones — so I’ve realigned with the bullish bias accordingly.
No entries yet — still in analysis mode, which honestly is the best part 😉
Watching for clean LTF confirmations before engaging. No guessing. No forcing.
Price always tells the truth — you just gotta stay patient enough to listen.
#EURUSD #SMC #bullishbias #marketstructure #inducementking #smartmoneyflow
Bless Trading!

GBPUSD| Bullish Structure Intact - Waiting on BSL SweepPair: GBPUSD
Bias: Bullish
Been following price closely while staying in analysis mode — no rush.
Recent structure remains intact and aligned to the upside. Now waiting for a clean BSL sweep to clear liquidity before looking for LTF confirmations to engage in buys.
Momentum is there, structure is clean — I just need price to do its part.
Staying patient. Still in sync.
#GBPUSD #SMC #bullishstructure #orderflow #inducementking #smartmoneytrader
Bless Trading!
USDJPY| Bullish Bias - Mitigated OB, Waiting for LTF ConfirmsPair: USDJPY
Bias: Bullish
Price swept deeper liquidity and has now mitigated a key 30M bullish order block.
From the 2H bird’s eye view, structure is still aligned to the upside — but I remain in analysis mode until LTF confirms the shift.
No need to force anything — price is doing its job, and I’m waiting for it to speak clearly through confirmation.
Bullish structure still in play, but we wait for the perfect moment.
#USDJPY #SMC #bullishbias #orderblock #structuretrader #inducementking
Bless Trading!

XAUUSD| Still Bullish - Waiting on BSL Sweep for EntryPair: XAUUSD
Bias: Bullish
Price remains bullish and structurally intact. This morning’s updated view confirms the bullish alignment — no change in directional bias.
Currently watching for a clean BSL sweep to clear out early liquidity, followed by LTF confirmations before engaging.
Higher time frame perspective from the 2H chart offers a solid bird’s eye view — staying patient and letting price come to me.
No rush — structure is king.
#XAUUSD #gold #smartmoney #SMC #orderblocks #inducementking #structurefirst
Bless Trading!

22.07.25 Morning ForecastPairs on Watch -
FX:GBPJPY
FX:AUDUSD
OANDA:XAUUSD
FX:GBPUSD
A short overview of the instruments I am looking at for today, multi-timeframe analysis down to what I will be looking at for an entry. Enjoy!

EURUSD - Sell Setup in ProgressPair: EURUSD
Bias: Bearish
HTF Overview: Structure leaning bearish — price respecting recent lower highs with room to fall into deeper 4H demand.
Current Zone: Price just mitigated the 30M sell-side OB, showing early signs of reaction.
LTF Confirmation: Still in observation mode — waiting for 5M or 1M confirmation to trigger short entries with confidence.
Entry Zone: Focused on refined LTF shift beneath the 30M OB — ideal setup includes inducement or liquidity run before executing.
Targets: First target is intraday low — ultimate target is the strong 4H demand zone below.
Mindset Note: Let the market bring the entry to you — don’t jump ahead of confirmation. Smart patience wins.
Bless Trading!

GBPUSD| - Bearish Play Setting UpPair: GBPUSD (GU)
Bias: Bearish
HTF Overview: Bearish structure intact — market has been respecting lower highs and pushing into downside pressure.
Current Zone: Price just mitigated the 30M OB, reacting as expected within the supply zone.
LTF Confirmation: Now waiting for clean confirmations on 5M or 1M — not in trader mode yet, analysis still in control.
Entry Zone: Watching for internal liquidity sweep or inducement followed by structure shift to confirm the sell.
Targets: First target is the next 30M low — extended target based on 1H continuation.
Mindset Note: No chasing — let the LTF tell the story before pulling the trigger. Control the urge, trust the system.
Bless Trading!

USDJPY - Bullish Bias, In OB ZonePair: USDJPY (UJ)
Bias: Bullish
HTF Overview: Bullish structure remains intact — price currently pushing upward, respecting higher timeframe flow.
Current Zone: Price is now sitting within the 30M OB, showing potential strength but no LTF confirmation yet.
LTF Confirmation: Still in analysis mode — sitting on hands, waiting for clean reaction on 5M or 1M before considering entries.
Entry Zone: 30M OB being monitored closely — ideal setup would include inducement and clear shift before entry.
Targets: Next 1H high remains the first target — extended targets to be trailed if momentum builds.
Mindset Note: Analysis first, execution second. Discipline is the edge — no rush until LTF gives the green light.
Bless Trading!

XAUUSD - Bullish Bias Holding StrongPair: XAUUSD (Gold)
Bias: Bullish
HTF Overview: Multi-timeframe structure aligned bullish. Market is in a clear uptrend across 4H and 1H, currently retracing toward key OB levels.
LTF Confirmation: Waiting on price to mitigate the 1H OB — once tapped, will drop to 15M and 5M for confirmation before any entries.
Entry Zone: 1H OB marked — setup strengthens if inducement or liquidity sweep occurs just before mitigation.
Targets: Short-term target is the previous high — extended target based on 4H continuation range.
Mindset Note: Alignment is there — now it’s about patience and waiting for execution clarity. Let price deliver the opportunity.
Bless Trading!

GBPJPY| - Bullish Opportunity DevelopingPair: GBPJPY (GJ)
Bias: Bullish
HTF Overview: 1H structure remains bullish with clear higher highs. Market currently pulling back toward a visible 1H Order Block.
LTF Confirmation: Waiting for price to mitigate the 1H OB, then will drop to 15M and 5M for bullish confirmation before entering.
Entry Zone: OB zone marked and active — ideal setup includes liquidity grab or inducement before confirming entry shift.
Targets: First target is recent 1H high — extended targets based on continuation structure above.
Mindset Note: No need to force the trade — the edge comes after the zone is respected and price confirms. Let the setup come to you.
Bless Trading!

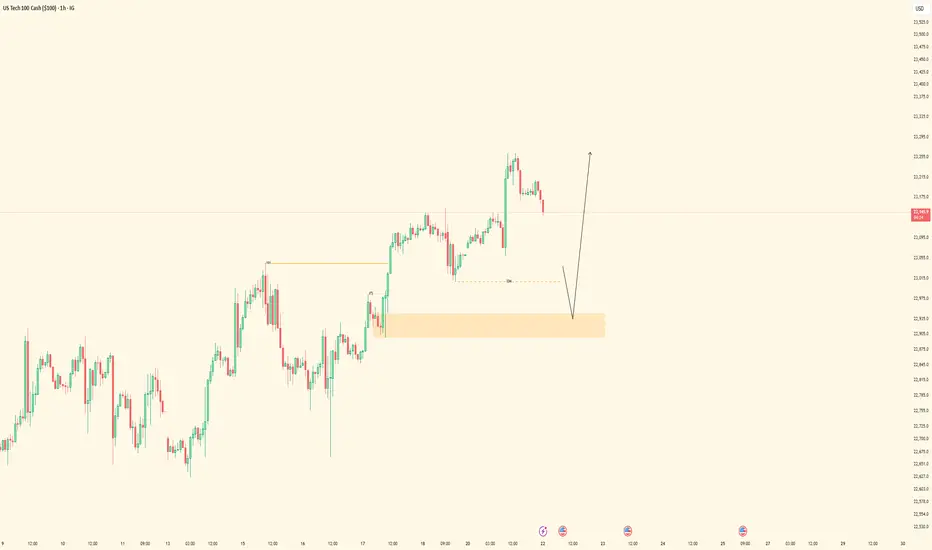
NAS100 - Bullish Setup BuildingPair: NASDAQ (NAS100)
Bias: Bullish
HTF Overview: 1H structure holding bullish after recent break of internal highs. Price pulling back toward a key demand zone.
LTF Confirmation: Waiting for price to mitigate the 1H Order Block, then drop to lower timeframes (15M → 5M) for confirmation entries.
Entry Zone: Watching for bullish reaction within OB, ideally paired with inducement or liquidity sweep before shift.
Targets: Short-term target is the next 1H high — extended targets align with overall bullish momentum continuation.
Mindset Note: Patience over prediction. Let price tap into the zone and confirm — don’t chase, just position smart.
Bless Trading!