UK100 6024.3 - 0.3 % LONG IDEA * STRUCTURE & REVERSAL Hey Every-one
Here's an idea on the FTSE 100 looking at it from the 4H chart which is trading in a descending triangle structure on a couple of time-frames but more focus on the 4H. The index just tested the bottom of structure or rather support looking for a push up with the bulls to respect the descending triangle structure before we see any break-out of any sort.
let's see how it goes..
HAPPY TRADING EVERYONE
_________________________________________________________________________________________________________________________
ENTRY & SL - FOLLOW YOUR RULES
TP 1 - 6070.5
TP 2 - 6111.0
SL - 5985.5
RISK-MANAGEMENT
PERIOD - SWING TRADE
__________________________________________________________________________________________________________________________
If this idea helps with your trading plan kindly leave a like definitely appreciate it.
Structure-trade
USDJPY Multiple Pattern SetupsLooking at this pair it looks like we have a few patterns setting up. Depending on what you trade we have a valid Bear Bat Pattern and Bear Gartley Pattern as well. I will be looking at taking the first to complete which is the Bear Bat Pattern. The Risk/Reward to target 1 is about 1/1.25 and to target 2's is roughly 1/2.
-Raymond Jeffries
EURJPY Bearish Structure TradeLooking at this structure short on the EURJPY on the 60m. We have a clear level of structure looking left, price has gone overbought, there is bearish divergence with a double top. With Stops above the highs we have a pretty good risk/reward even for more conservative targets above the .50's handle. If youre more aggressive you can shoot for a lower level of structure. Not looking for a big move but just some relief.
-Raymond Jeffries
NZD Short at a Level of StructureLooking at this level for a short on the NZDUSD 60m. We haven't gotten a confirmation for entry yet but this may be an area to look for a double top or a 3 bar reversal if you're aggressive. Setting up for a pretty decent reward to risk with just over 2.5/1.
-Raymond Jeffries
USDCHF 0.91099 + 0.37 % SHORT IDEA * DESCENDING TRI.A STRUCTURE Good Day Everyone
Here's an idea on the DOLLAR / SWISS which has been structure bound in a descending triangle respecting structure, the pair was just rejected at the roof of structure as we saw some DOLLAR recoveries upon market close this past week. looking for a continuation of this move to the base of structure/ support.
looking for structure to hold on the pair
let's see how it goes...
HAPPY TRADING EVERYONE
_________________________________________________________________________________________________________________________
ENTRY & SL - FOLLOW YOUR RULES
TP 1 - 0.90397
SL - 0.91611
RISK-MANAGEMENT
PERIOD - SWING TRADE
__________________________________________________________________________________________________________________________
If this idea helps with your trading plan kindly leave a like definitely appreciate it.
GBPUSD SELL SENTIMENTGBPUSD Showing Sell Setup Its In Abearish Flag Correction I Love Bearish Flag I Love The More Probabilities It Becomes For Example If Its Flag Gives Me 3 Touch And The Third Touch Goes In A Corrective Move Its High Probability And Im Gonna Short. Dont Ever Trade In Correctiion Wait Till It Finishes. Patience Is The Key In Trading Forex Thank You.
Bitcoin and Ethereum Shorting OpportunityHey there,
Please like this idea and follow me to stay updated on new ideas!
Bitcoin and Ethereum are looking for more downside in my opinion.
Take care on you longs.
Too many are bullish right now and market seems to currently break critical structure,
according to my analysis atleast.
Target ranging between 10,500 and 10k
Cheers,
Konrad
Close Eur/usd in 14 pip profit. Bias Uncertainty i will link the previous analysis below to see how i saw the market then. and i updated it why we are closing this trade.
we got a break of structure but at the end we saw more selling pressure and went all the way to test the daily support which is okey. so it mean the broken structure we saw is invalid and now we need to base it. by h4 timeframe and h1. so that why we close our trade in 14 pips profit
XLMUSDT Moon mission 🦐 🌘XLMUSDT After broke weekly structure , XLM seems very bullish
According to Plancton's strategy, we can set a nice order
–––––
Follow the Shrimp 🦐
Here is the Plancton0618 technical analysis, please comment below if you have any question.
The ENTRY in the market will be taken only if the condition of Plancton0618 strategy will trigger.
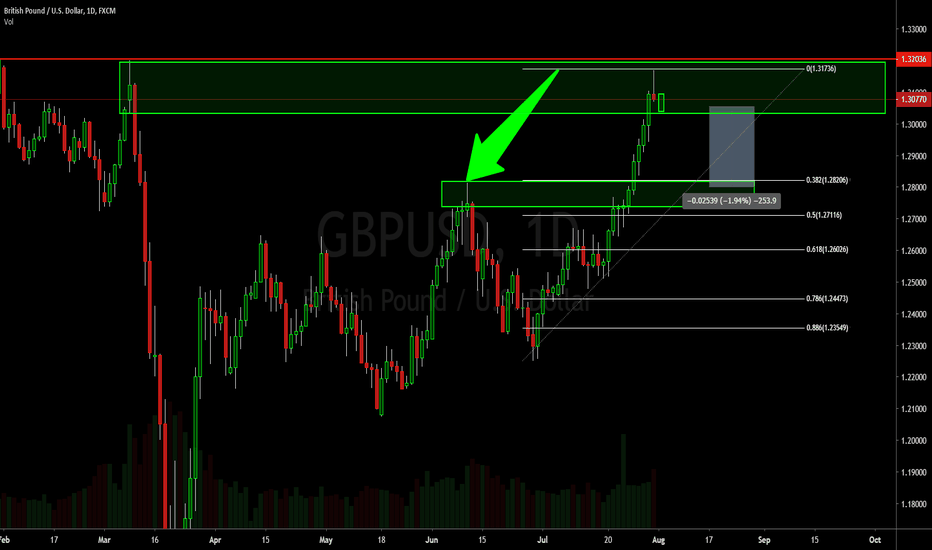
GBPUSD - DAILY - STRUCTURE TRADE IDEAThe GBPUSD has finally rallied to the previous level of structure resistance that we had on our radar. Now although we had a nice candle to close the week, we must remember that not only is it the close of a week but also the close of the month.
A good sign of confirmation for a little relief lower would be a lower low, lower close candle.
- Akil


