GBPUSD: Keeping An Eye Out For ShortsKeeping an eye out for potential selling opportunities at these 2 levels for the gbpusd today.
Akil
Structure-trade

GBPUSD, Potential Bearish Structure Trade On GBPUSD, price is heading towards the major structure zone, that is now acting as a Resistance Zone.
After the price formed New Structure Low, we are in confirmed bearish trend on 1H.
We see that currently price is in pullback mode, so I'm looking to hop on that bearish trend, at the end of that pullback.

USDCAD - Don't or Do Catch The Falling Knife?We just took a look at this pair in the Syndicate and I wanted to share it with you guys as well. I'm looking for buying opportunities here on the $USDCAD and this particular trade fits right into today's theme of being "Predictive with your analysis & reactive in your execution."
With the change in Canadian sentiment, we've seen a massive amount of buying for the CAD, nothing last forever and this looks to be a good place for buyers to retest the market (buy orders) and for sellers to remove some profits (buy orders)...See what I did there.
Anyway, I just missed confirmation on the recent for hour close, so I'll need to wait until 9pm NY time for my next opportunity to get involved.
Whenever you see this type of move you hear the cliche, "don't catch a falling knife" reference. To be that's a bunch of bull and as counter trend traders it's our job to catch those knives as long as their at smart areas in the market.
Akil

EURJPY CHANGE IN STRUCTURE- POTENTIAL BUYSLook for EURJPY to complete Structure A which would be a Straight Channel or Structure B which would see longs at the 38.2 retracement of the preceding wave.

EURUSD - Potential Gartley Formation (Should Say Long not Short)As the EURUSD recovers from Friday's NFP number, price is beginning to set up a potential bullish Gartley Formation.
Akil

EURUSD - The Rally To ResistanceAs soon as I hit send on the email, the EURUSD completes its double top at a retest of previous structure highs. This isn't the best place to short this pair in my opinion, but it is a good one and the only opportunity that I would have due to how price has developed.
Overall i still have a neutral bias on this pair but there's certainly room for a correction after today's rally to resistance.
Akil

GOLD - Potential Trend Trading Opportunity Up To 1290'sThe last pair looked at today was on GOLD. If you're a follower of my post here or anywhere else, then you know that I was looking for a potential head & shoulders pattern. Price didn't quite make it to a horizontal neckline (which is preferred not needed) before heading up to retest the level of the left shoulder.
A double top at that level then turned into an ascending triangle which has recently broken out to the upside. Back to the non-horizontal neckline. This continues our series of higher highs & higher lows which results in a bullish trend. So IF we are going to continue this bullish trend THEN the path of least resistance leads us up into previous structure resistance....hope that wasn't confusing.
As a countertrend trader, you should now be asking yourself the question "How can I get involved if we retest previous structure highs?" while a trend trader should be asking themselves "How can I get involved in the anticipated move up to those previous structure highs?"

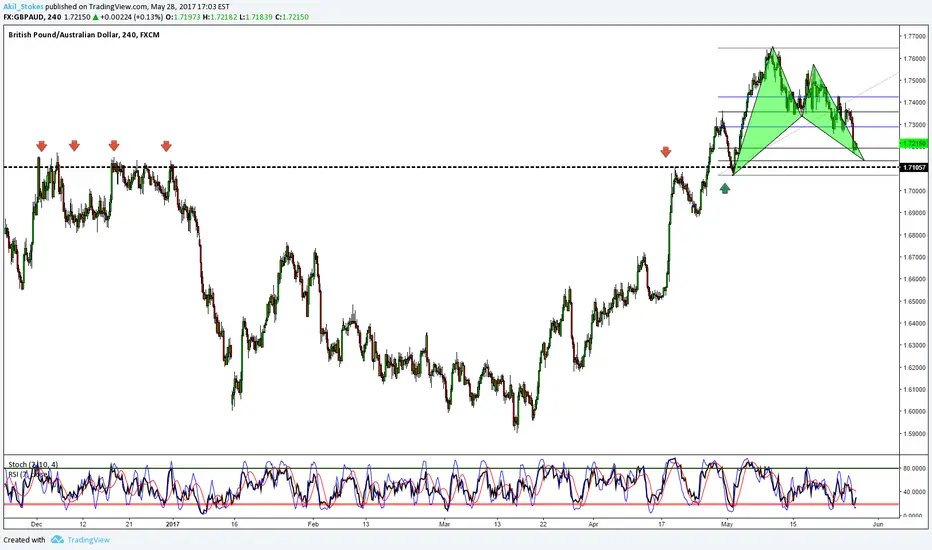
GBPAUD - Bullish Bat Formation at Previous Structure One of the simpler setups discussed today, price on the GBPAUD is moving down towards the "D" completion of a potential Bullish Bat formation. If a trader were to...look left, you should also see a previous zone that price has recently used as both support and resistance in the recent past as well as a few months back.
EURAUD - False Breakout Head & Shoulders/2618 Retest This was one of the more interesting pairs that we looked at today as it featured a lot. Starting on the higher timeframe it's important to realize that we have failed to break above our previous level of structure resistance. Therefore what seems like an obvious bullish flag formation may not be as appealing as it once seemed.
I'm looking at this as a potential false breakout due to the fact that after trying to rally above the highs of our channel, we've returned and passed it's midway mark. Now I've never tested this personally as I'm not much of a breakout trader but trading legend Linda Raschke warns to be aware of this.
if this is indeed a false breakout then a rally higher would give us 2618 opportunity competing at the same level as the left shoulder of a head and shoulders pattern. Giving us to reversal patterns at the same level.
Seems interesting to me.

NZDUSD: Ascending Channel into 2nd Level Resistance Test The Kiwi was my sole losing trade last week which doesn't come as a surprise. This trade features a dual level of structure which is always difficult to navigate and although I waited for a conservative entry, I also took a very conservative stop knowing that I would rather get stopped out and retry if the opportunity presented itself vs. using a bigger stop loss and taking a larger loss than I'd want to.
Similar to the GBPUSD, Kiwi is putting in an ascending channel where the buying pressure is starting to slow due to both bullish profit-taking and bearish interest at the current level of resistance. I don't know when or if I'll get the opportunity, but I would expect to see some relief in this market the closer we get to the higher level of resistance.

AUDUSD: 3rd Strike 2618 Opportunity AUDUSD was the first of 2 2618's shown today. As mentioned, I had previously been a fan of the higher level of structure resistance (red box) and although I couldn't involve myself in the initial test, was able to use an advanced pattern formation to get involved on the retest. We now have the potential for a 3rd strike of that level in the form of a 2618 trade if price action were to rally up to the .7480's level.
Overall I'm still neutral on this pair meaning I don't have a firm bullish or bearish bias bigger picture.

EURJPY: Looking At An Opposite Breakout The second pair in tonight's video focused on the EURJPY which has been extremely interesting as of late. Although this particular pattern formation traditionally breaks out in the direction of the flag pole. I still have a bullish higher time frame bias on this pair and our currently level of structure offers a low risk opportunity to get involved in an anticipated move retesting our previous structure highs.
At the bottom of the chart you'll see that our RSI has gone massively oversold & is now showing bullish divergence. This doesn't make it a no brainer buying opportunity but it does help us build a case for a bullish bias.

GBPUSD: Finding Relief at Previous Structure SupportThe first pair that I looked at in today's video was the GBPUSD where I'm paying attention to the current level of structure support & looking for a 2nd test (down on the hourly) followed by a failure. If the Bulls can once again show some buying pressure and hold that level then I think we can easily see a bit of relief back up to the previous level of structure support which may now act as resistance.

NATURAL GASS REPEATING STRUCTUREI have previously posted an update on natural gas plus a long on going trade which already gave us a lot of profit from target 1.
I have also notice the importance of 3,5$ per MMBtu for extra push to the upside read the articles below.
TECHNICALLY
WE CAN SEE THE HEAD AND SHOULDERS PATTERN,THE FIBONACCI LEVELS,THE ASCENDING CHANNEL,THE BIG TRIANGLE ABC.
WE ALSO SEE THE SMALLER DESCENDING TRIANGLES EDF AND E'D'F'.
AS PREVIOUS WE COPY THE ED SIDE AND WE SET IT AS A TARGET WE CAN SEE THAT THE FIRST TRIANGLE BROKE SUCCESSFULLY AND PRICE REACHED THE PRICE TARGET 3,380$ PER MMBTU WHICH IS THE MEASURED MOVE FROM E TO D OF EDF TRIANLE.
IF WE DO THE SAME WITH E'D'F' TRIANGLE AND TAKE E'D' TO PROJECT THE TARGETS WITH THE BLUE LINE WE CAN SEE THAT IT REACHES 3,5$ THE IMPORTANT LEVEL MENTIONED.
RSI HEADING INTO OVERSOLD ZONE TO TAKE THE POWER TO BREAK THAT TRIANLGE FOR SUMMER RALLY.
ATR CLOSE TO IT'S LOWEST LEVELS MAYBE PREPARING FOR EXTENSION SOON.
WE CAN TAKE THE TRADE MENTION OR MORE LONGTERM VIEW WE CAN TAKE THIS TRADE WHICH I WILL UPDATE ACCORDING TO THE PRICE ACTION.
POSSIBLE TRADE WITH 2 P/L RATIO
FIRST TARGET T1 AT 3,380$ PER MMBTU
SECOND TARGET AT 3,5$ PER MMBTU
WIDER STOP LOSS AT THIS ONE BECAUSE OF MORE A LONG-TERM VIEW AT 3,050$ PER MMBTU
THANK YOU FOR SUPPORT
HAPPY TRADING

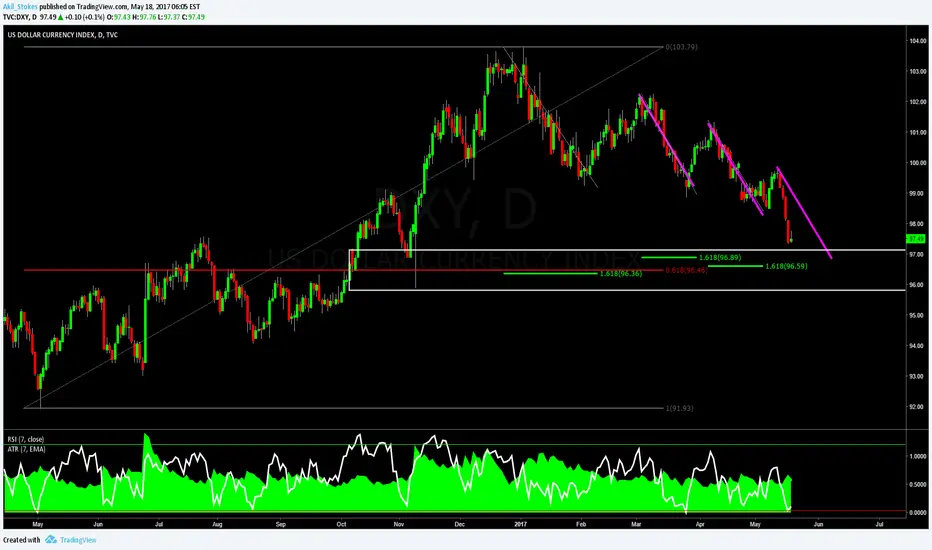
DXY: Just Some Random Analysis In my opinion, finding a good trading opportunity is like a detective gathers clues and seeing what they all add up to. There are lots of tools that we can use in our technical analysis, but in my opinion no single one is great. Rather it's the combination of those tools & tactics that allow us to dial down on the best areas in the markets.
GBPJPY in Structure. Will it hold?Hey guys,
very few trading opportunities today on my radar. Here is one of the most interesting, we're on the daily chart and it's clear to everyone that we're about to make a decision. The structure you see looking left seems very important, and also the RSI way overbought make me think it's going to reverse. Nonetheless, you don't want to short such a trending market without additional confirmation, that's why i'm paying attention to the hourly and 4hr chart in order to seek for trading opportunities.
I'll keep you updated!
If you want to ask questions or share your view, feel free to comment below.
Otherwise, see you in the next chart!

GBPJPY in Key Structure Point. Will it fall?Hey guys,
very few trading opportunities today on my radar. Here is one of the most interesting, we're on the daily chart and it's clear to everyone that we're about to make a decision. The structure you see looking left seems very important, and also the RSI way overbought make me think it's going to reverse. Nonetheless, you don't want to short such a trending market without additional confirmation, that's why i'm paying attention to the hourly and 4hr chart in order to seek for trading opportunities.
I'll keep you updated!
If you want to ask questions or share your view, feel free to comment below.
Otherwise, see you in the next chart!

USDCAD Daily OutlookHi guys,
as you can see in this chart price has already broken and closed above the last structure level looking left. What does it tell us? It tells that the trend is confirmed bullish and therefore we're going to look for trading opportunities only in that side.
As always, we don't want to chase price action, instead we wait for it to come in our comfortable zones in order to gives us a better risk to reward ratio.
The yellow zone represents for me the best scenario to long this market, since you should know that the more the price retraces the weaker the overall trend.
I'll keep you updated!
If you want to ask questions or share your viewpoint, go ahead and comment below.
Otherwise, see you in the next chart!

EUR/USD Sell SetupThis chart shows a revision on the Euro-US Dollar in the 4 hour timeframe. The analysis is based in market structure rather than the Fib presented.
As you may see, there was a strong bullish tendency since the beggining of March (1 ) which dropped down around 1.09008 . Afterwards, the market tried to imitate the same upwards movement, but with many corrections that could lead to a strong bearish movement ( 2 ).
I hope it is useful and trade with care!

Reversal area on EURCAD!Hi guys,
lately price action didn't go in our favor. I apologize to you if you did take some losses because of my charts, but one of the hard part in trading is to keep using the same methodology (proven to be valid) over and over again, without sabotaging it.
So here we are with one of the usual structure plays on the chart. As you all see, euro has rallied a lot this week, and in this particular pair it reached a key resistance area that could stop the rally and start a reversal.
Why am i interested in this particular zone? Simply, look left and you'll notice some of the previous touches on that level that always provided with some good shorting opportunities. So the previous behaviour could repeat again. Plus, we also have an AB=CD pattern that's just completed and the RSI is way overbought. It additionally confirm the good spot we're in.
So keep a look at the lower timeframes seeking for a shorting signal in price action, such as double tops, engulfings, pinbar and so on.
I'll keep you updated.
If you want to share your view, or simply ask questions, feel free to comment below.
Otherwise, see you in the next chart!

AUDNZD: CTS Short Opportunity With gaps interrupting the majority of the pairs in my trading portfolio I'll be turning to more minor pairs in order to find trading examples.
Following up on yesterday's Combined Technical Scoring System Strategy Lab I thought that this would be a perfect opportunity to share today.
Obviously price has already began to react after running into previous structure resistance, but a retest of structure (double top or 2618) would provide a much more conservative entry into this bearish opportunity.
Many of you enjoyed the article that I shared yesterday titled "The 1 Habit of Self Made Millionaires" so today i'll be doing a a Live discussion on it at 1:20pm (New York Time), relating it to trading. Should be fun!


