Previous Support becomes Resistance!Hi guys,
this is a trend continuation trade: you can tell this simply by looking at the last price moves. The recent downward movement created a new low in the 4H chart, so we are now setting our mindset in bearish condition for we'd want to hop on the trend as soon as price gives us the opportunity to do so. In this case price has created a double top on the lower timeframe (1h) right at the retest of the support that once broken could become resistance.
Entry at market, stops 2-3 pips above 0,70 round number, first target at the retest of the lows, second target could go all the way down to 0,69.
Let's see how it plays out.
If you want to share your view or ask questions, feel free to comment below.
Otherwise, see you in the next chart!
Structure-trade

Short on GBPUSDHi guys,
this time we're going to take a look at the pound dollar cross; as you can see price has formed a nice double top at a previous structure point in higher timeframe (4H) with RSI divergence (bottom of your screen).
I'm not taking this because i'm already involved with GBP pairs so i don't want to be overexposed, but i think this could be a nice short.
Stops would go above the highs, conservative target can go at the retest of the recent low, a more aggressive target could be at the retest of the lows at 1,2430 level.
If you want to share your view or ask quesitons, feel free to comment below.
Otherwise, see you in the next chart!

GBPMXN Weekly and Daily - important levelsPrice on GBPMXN is at a possible band of horizontal support. But at least it is an important structure level.
Price has also broken the 200 EMA on the weekly chart. However, it has recovered in the in recent months from such a level.
Disclaimer: This is not a recommendation or encouragement to take a position, or invest any money. GBPMXN makes both millionaires (the minority) and paupers (the majority) of traders. No liability accepted for any losses suffered. Paper trading accounts are recommended for those who wish to experiment.

EURJPY - 1st Strike Trend Continuation The EURJPY was one of the main pairs on my watch list heading into this week of trading due to the fact that we had just broken a previous level of structure support.
I took a small loss on an aggressive day trade on the 5 Range bar charts during this mornings Live Room session, but this was the first opportunity I had to get in as a swing trader.
It's an aggressive sell once again, but due to the amount of risk & the risk reward potential of the trade it's certainly a trade that I'm interested in.
If stopped out, my eyes will then be on a second chance short around the $119.00 price point which is a level where previous structure support has shifted to resistance in the past.
I sent a video out of the initial analysis this morning & if I have the time later on the the week I'll try to put everything together so that you guys can see it as well.
Good luck in the markets traders & keep an eye out for those WED FOMC Minutes. Although it's a USD based release, the USD & the YEN have been in a fierce battle of save haven pairs so I would certainly expect to see some type of reaction.
Akil Stokes
Forex Trader & Trading Coach

Head & Shoulders on NZDJPY!!Hi guys,
here it's an Head&Shoulders pattern on NZDJPY. I'm very interested on this cross because i think we have a nice rally ahead. On the daily price has formed 3 consecutive candles with buying pressure and we also have a divergence on the RSI. I patiently waited for a break of structure as a confirmation and that happened today.
Now there are two levels where i'm going to pay attention to: previous resistance and previous support.
If price will give us a weakness sign i will be buying this.
If you have any question or you want to share your thoughts about this, feel free to comment below.
Otherwise, see you in the next chart!

Head & Shoulders on NZDJPYHi guys,
here it's an Head&Shoulders pattern on NZDJPY. I'm very interested on this cross because i think we have a nice rally ahead. On the daily price has formed 3 consecutive candles with buying pressure and we also have a divergence on the RSI. I patiently waited for a break of structure as a confirmation and that happened today.
Now there are two levels where i'm going to pay attention to: previous resistance and previous support.
If price will give us a weakness sign i will be buying this.
If you have any question or you want to share your thoughts about this, feel free to comment below.
Otherwise, see you in the next chart!

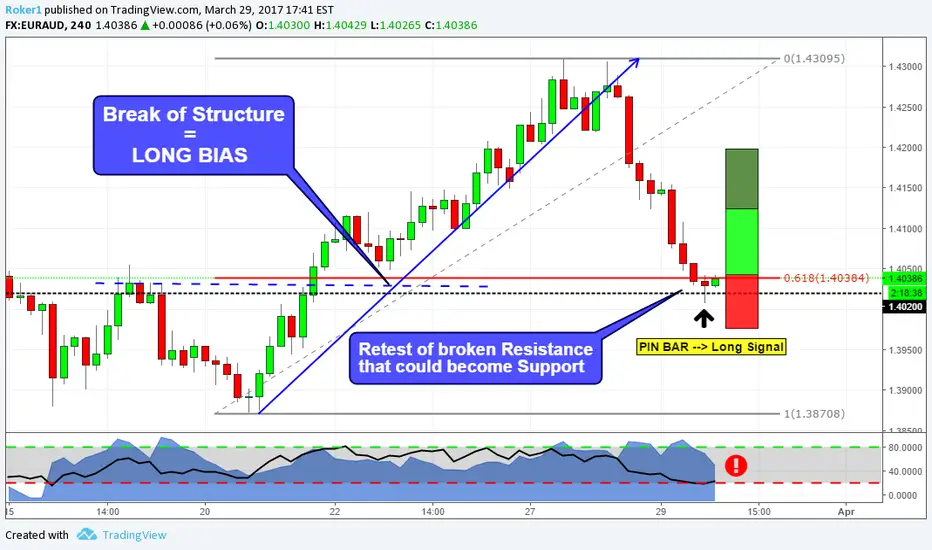
Structure Exposed!!Hi guys,
this is a simple structure trade: you can see price is coming back to retest the former resistance that once broken should turn into support. This is also lining up pretty well with a 618 retracement and a psychological number (1,40). You can see also a pin bar just formed with OVERSOLD condition.
All those clues together make this trade a nobrainer.
If the current candle will reject again that level i think i'm going to buy.
Stops obviously below the pin, target1 and 2 with 382 and 618 retracement.
Always look left. Structure leave clues!
If you want to share your thoughts or ask questions, feel free to comment below.
Otherwise, see you in the next chart!
Structure Exposed!Hi guys,
this is a simple structure trade: you can see price is coming back to retest the former resistance that once broken should turn into support. This is also lining up pretty well with a 618 retracement and a psychological number (1,40). You can see also a pin bar just formed with OVERSOLD condition.
All those clues together make this trade a nobrainer.
If the current candle will reject again that level i think i'm going to buy.
Stops obviously below the pin, target1 and 2 with 382 and 618 retracement.
Always look left. Structure leave clues!
If you want to share your thoughts or ask questions, feel free to comment below.
Otherwise, see you in the next chart!

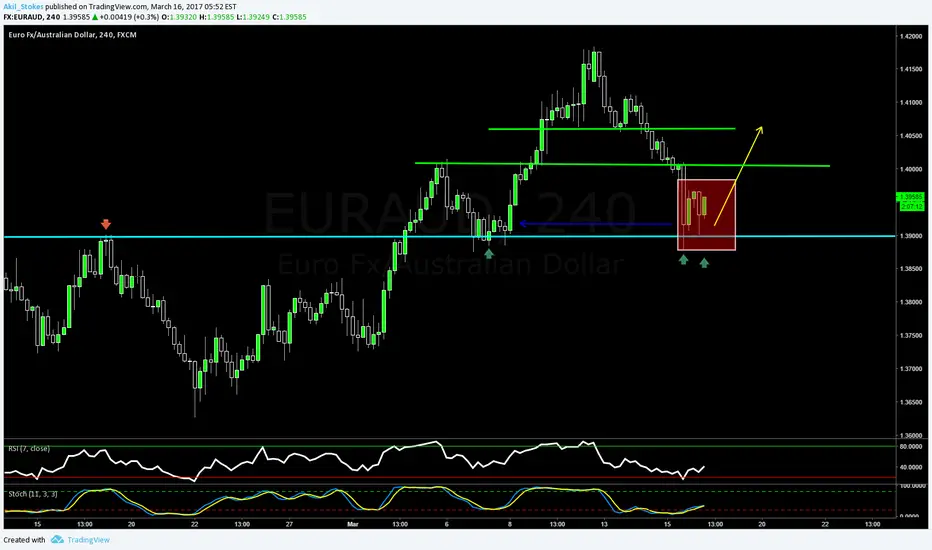
2618 on AUDCADHi guys,
few days ago i've published a shorting opportunity on this pair. But that doesn't mean we can't change our mind. In this particular case, i've missed the short entry but that was in fact a counter trend trade.
Now price has retraced back right on the previous resistance that was broken and that could turn into support (black box). Since we have a double bottom, with Rsi divergence, broken to the upside, i think this could be a good spot to long this pair (using the 2618 strategy).
Stops below the lows, target 1 and 2 as in the chart above.
If you want to share your viewpoint or ask questions, feel free to comment below.
Otherwise, see you in the next chart!

AB=CD Patterns unfolding!Hi guys,
this evening i want to bring your attention on this scenario on AUDCAD. As you can see on the left hand side of your screen, price is now testing a key resistance zone on the daily timeframe. Also, it has created two different ab=cd patterns (one on the daily, one on the 4hr chart) that are going to complete right at that structure level.
RSI is in overbought condition on the 4HR.
Pay attention to price action.
I'm waiting for a sell signal.
I'll keep you updated!
If you want to share your viewpoint, or ask questions, feel free to comment below.
Otherwise, see you in the next chart!

GBPUSD at a decision point! Will it hold?Hey guys,
today i want to bring your attention to GBPUSD. As you can see, looking left, there are multiple structure level that acted as supports or resistances. This level also lines up with the 618 retracement and a psychological number. So i'm going to look for a double top or a simple candlestick formation right there.
I'll keep you updated.
If you want to share your standpoint, or ask questions, feel free to comment below.
Otherwise, see you in the next chart!

What to expect from Gold: Structure ZoneRecently saw a nice pullback into the structure zone (blue rectangle). RSI went overbought on first move. Got a potential double top in this area where also the 50 % retracement lines up.
Additional confirmation would be RSI divergence.
OR: There is a chance we see a new high into the 61.8 retracement at the top of the blue box, so be prepared for both cases.
Follow your plan

EURAUD - A Simple Structure TradeA simple structure trading opportunity here on the EURAUD. What I'm looking at is price action pulling back into a previous level of structure support & forming a double bottom with divergence on the RSI.
If we rally the 2 levels that I'd predict price action to run towards would be the $1.40 even handle & $1.4050's level.
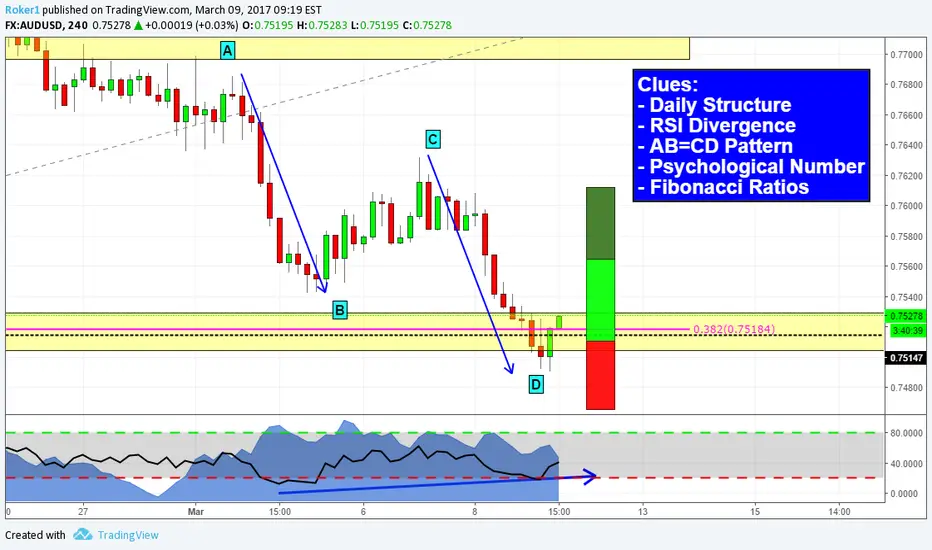
AUDUSD bunch of clues!Hi guys,
just wanted to share with you this analysis i've made on AUDUSD. All this starts from higher timeframe, if you take a look at the daily chart, you'll understand that price is at a decision level. The yellow box actually represents the daily structure zone that price is testing.
So the first thing i want to see is that price is at a structure point, then i go into details searching for reasons to go short/long.
In this case you can see on the 4hr chart we have an AB=CD pattern already completed at a psychological number (0,7500) together with a 382 fibonacci retracement (of the bigger daily leg) and an RSI divergence.
In conclusion, i'm waiting a little pullback in order to get a better entry and therefore a better risk to reward ratio.
Hope you like it!
If you want to share your viewpoint or ask questions, feel free to comment below.
Otherwise, see you in the next chart!
AUDUSD nice confluence!Hi guys,
just wanted to share with you this analysis i've made on AUDUSD. All this starts from higher timeframe, if you take a look at the daily chart, you'll understand that price is at a decision level. The yellow box actually represents the daily structure zone that price is testing.
So the first thing i want to see is that price is at a structure point, then i go into details searching for reasons to go short/long.
In this case you can see on the 4hr chart we have an AB=CD pattern already completed at a psychological number (0,7500) together with a 382 fibonacci retracement (of the bigger daily leg) and an RSI divergence.
In conclusion, i'm waiting a little pullback in order to get a better entry and therefore a better risk to reward ratio.
Hope you like it!
If you want to share your viewpoint or ask questions, feel free to comment below.
Otherwise, see you in the next chart!

EURNZD has to decide where to go! Will it break or will it hold?Hi guys,
just wanted to let you know that i'm watching attentively to this pair, since price is testing a very important structure level that acted as support and resistance many times in the past.
As of now, i'm looking for weaknesses in order to short the market: notice that we're deeply in overbought condition and price is testing a psychological number (along with structure) so any other candlestick signal would make me sell at market.
Nonetheless we should be ready to change our mind if price breaks the structure yellow zone so that we can take advantage of both the situations.
Never be unprepared! Think ahead!
I'll keep you updated.
If you want to share your standpoint, feel free to comment below.
Otherwise, see you in the next chart!

EURUSD buy opportunity Good morning traders!!
I just got long EURUSD. However, there is something important to note here. I believe that this pair will at least test 1.0621, but I don't know if it will do so from here because it could also do it from the lower level. In other words, if this trade fails, I will be ready to look for an opportunity on the lower level of structure. I got long on that huge pin bar at structure. Hopefully we will see some momentum to the upside.

GOLD: Potential Bullish Cypher (Sorry forgot to hit long)Here's something one of our traders found yesterday in the live trading room. It's a potential bullish Cypher formation on Gold. If you continue to scroll the chart left you'll see that the completion and retracement level as a whole comes at a pretty decent level of previous structure support & resistance as well. (Wish i had a cool name for this but I call it a "Polar Flip" If you have any suggestions let me know)
I don't personally trade gold, but I am a longer term investor in this hard asset metal so I would also welcome a bullish move.
FUNDAMENTALS
We had a great ADP number yesterday which is typically a precursor to tomorrow's Jobs number. The March interest rate hike has already been priced into the markets, but some great numbers could leave clues about the next hike.

EJ Potential Trading Opportunity. Here's a breakdown of my structure analysis for EURJPY. I am expecting a rejection of the price 121.100. (Confirmation needed)
If this price rejection a short opportunity to 120.000 will present itself.
Another trade opportunity may present its self after the short. Which would be a long. But I dont expect the price to retest the previous structure low of 118.00 This may be a good pair to keep in mind for market opening.

EURJPY: Where Previous Support Turns to Potential ResistanceAfter breaking down from a 2 month consolidation. The EURJPY is now returning to the level that at one point proved to be a significant level of support. After the violation we are now looking for this previous level of structure to potentially flip and act as resistance, offering a bearish trading opportunity with a very positive risk reward.
On the right of the chart are the 3 potential levels of profit taking that we discussed ranging from the conservative to the more aggressive.
My apologies for being absent, but between a rough start to the trading year and the launch of a new course, sharing on Trading View was a very low priority. Hopefully as things start to slow down towards the spring & summer, I can return to positing more consistently.
Either way i appreciate your continued support as we have a GREAT community of traders on this site!

Potential Buy on NZDUSDTwo ABCD moves to Structure rectangle
78.6 FIb Retracement
161.8 & 1414.4 Fib Extension at structure rectangle
RSI OS
0.7000 Underlying at structure
Uptrending trendline on Daily chart
Trigger: Higher High High Close Candle

Harmonic trading on USDJPYHi guys,
just wanted to share with you this Cypher pattern that i'm going to take. It completes near the previous resistance and the RSI is in overbought condition.
Stops above X, targets as usual with advanced patterns.
If you want to share your view or ask questions, feel free to write below.
Otherwise, see you in the next chart!

Advanced pattern formation on USDJPYHi guys,
just wanted to share with you this Cypher pattern that i'm going to take. It completes near the previous resistance and the RSI is in overbought condition.
Stops above X, targets as usual with advanced patterns.
If you want to share your view or ask questions, feel free to write below.
Otherwise, see you in the next chart!
