EURJPY: Nice structure and long opportunityWhat a nice structure at FX:EURJPY … Three sell-offs of almost exactly same length. As the last candle was an indecision candle, I'd suspect a great opportunity to go long. First retracement stopped at 0.5, the second was fully bought back before the sell off continued. In my opinion it's targets T1 at the 0.618 retracement of the last move (RR 1:2.3), T2 at the 0.5 (RR 1:3.3) and probably T3 at the 0.382 (RR 1:4.2) which is also last weeks S2 pivot.
Only the resistance between 0.786 and 0.618 might be a problem? What do you guys think?
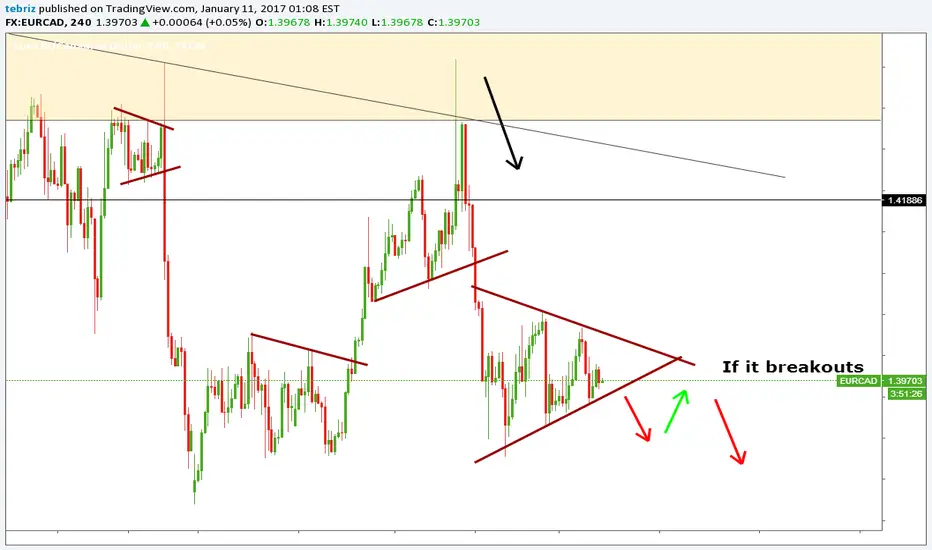
Structure-trade

Are We Breaking Out?Here on the GBPJPY we have a very big triangle pattern that appears to be breaking out. No if you don't trade breakouts, missed the breakout or just want a little more confirmation, you can wait for a pullback and then enter on a simple trend continuation style trade. Now minimum stops need to be above the previous swing high, and you can take targets a multitude of different ways. Even with the conservative targets I have here on the chart, you are still looking at more than 500 pips of potential profit. Now the risk:reward ratio is still very good, but make sure this meets your risk profile, because GBPJPY has a high ATR and it can have some massive stops.
If you would like to see the video I just put out on this setup along with a couple of other potential setups, here is the link: youtu.be
As always,
Good luck and good trading.

AB=CD completed right at Daily StructureHey guys,
very simple trade, price has completed an AB=CD pattern on this pair, right at the most previous structure level. Also, it has created a nice long wick to the top candle that closed as engulfing, with RSI overbought condition in our support.
Waiting for a little pullback in order to short the market and get at least a 1:1 RR on the first target that would be placed on the first AB=CD target (at the 382 retracement).
Stops above the highest highs.
Good trading!
If you want to share your standpoint or ask questions, feel free to write below.
Otherwise, see you in the next chart!

Possible LONG on this pair with bullish Cypher ConfirmationIt seems we have a probable LONG trade possibility on this pair, based on the following factors:
Elliott wave count suggests a wave 3 has almost been completed and is on the last price action through to the wave 3 target. Pattern structure has been broken for a small upwards move (to target 1 and/or 2) before it continues downward. Stochastic suggests a possible downward move, however looking at previous performance (around the 7th to 10th of February) seems to suggest a possible upward move before a downward move. RSI suggests more upwards movement before a downward move.
Additionally, we have what seems to be a BULLISH Cypher harmonic pattern forming, confirming an upwards move, where I have marked 2x targets. First target is at a channel trendline and the second target is at a conservative cypher pattern target. Either target could be hit, prior to a downwards move towards the completion of a wave 3 count.
----------------------------------------------------------------------------------------------------------------------------------------------------------
DISCLAIMER: This chart is for sharing and educational purposes only and is not intended to be a signal service or similar.
This chart analysis is only provided as my own opinion, based on my own analysis and comes with absolutely no warranty that this analysis is correct, whatsoever. Do not trade this chart if you do not have your own strategy. Trade only with your own strategy at your own risk.
Plan your trade and trade your plan... and IF in doubt, stay out.
.....::::: If you like this chart, please click on the THUMBS UP ! :::::.....
----------------------------------------------------------------------------------------------------------------------------------------------------------


Long Opportunity. Breaking down AUDJPY i was able to observe that the high was tested at 87.425 earlier today and was not able to break the price. That is a structure being held from DEC12th It doesnt lead me to believe a reversal is next. I believe a retest in this price will occur; Or consolidation will occur between the the structure price range given in the graph. I am seeking a possible long opportunity.
I will update with coordinates.

2618 on EURNZDHey guys,
this evening i'd want to share a setup that i will closely look at in the next few hours and probably on Monday opening. This is a 2618 trade that's forming on EURNZD. If you're not familiar with this kind of formation, it basically consists in selling/buying the 618 retracement of the leg that breaks the double top/bottom's neckline. Essentially it should be a conservative way to trade double top/bottom after the confirmation of the reversal (break of structure).
This analysis also aligns pretty well with higher timeframe analysis: on the daily price has created a new structure low (bearish trend confirmation) and it's now back retesting a 4hr structure level (black line) that could stop the price's rally and starts the new downtrend movement.
This is what i look for when trading: additional higher timeframe confirmation! It's very important to have bigger perspective.
That's why i'd split my position in two parts in order to follow the bigger trend in case i'm right. The first position should be taken at the retest of the new low. Stops above the highest high.
If you have any question, feel free to comment below.
Otherwise, see you in the next chart!
Have a good weekend!

GBPUSDThere is a chance for a trend continuation trade and for that reason im just waiting for me to get my reasons for entry for me to get in this trade.

Conditional Short on SPXCheck out chart for details. Summary: wait for price to break through major support then short on re-test. Target the essentially un-tested (tested by three daily candle wicks) previous all-time high breakout area.

Long opportunity based on structure Based on structure there is a trade setup with good risk reward , grey zone is from daily timeframe , and blue zone is in hourly zone.
In the blue zone you can look for entry reasons accourding to your trade plan , mby in smaller time frame.
Sam

AUDUSD Short DWe have tested and not been able to break this Key Level at 0.75324 for almost a week, Now we have broken below my target is the 0.73307 level with lines up with the 618 retracement of the recent impulse leg up

2618 on Gold! Ready to short!Hey guys,
i've been watching closely to gold lately and i've found out that it basically respect structure like any other pair i'm trading. So i've decided to apply some analysis to this instrument in order to give you my particular view about it.
The black line represents a daily structure level that i pointed out last week, after the first test price action fell forming a double top that has been recently broken to the downside.
This means my bias is now short, and this may be the startinig point of a new downtrend.
In order to hop on the trend with a nice risk to reward ratio, i've outlined two "Killzones" where i'm going to pay attention to candlestick formations.
The first one is the double top's neckline and the support that's been broken ultimately, thus it's considered to be the first possible turning point.
The second one is the 2618's completion that you could take as a trade alone.
My conservative style of trading tells me to wait till i see a weakness signal on price action.
Good luck!
If you want to share your standpoint or ask questions, feel free to write below.
Otherwise, see you in the next chart!

Flag pattern on EURGBPHey guys,
another simple pattern on my radar today. This time i'm right on time because the break has just happened. You can see the big impulsive leg that broke multiple structure levels on the 4hr chart. Like i said on the previous idea usually after impulses like this price put brief form of consolidation like flag, triangles and pennants.
You can trade in two different ways: the first is to sell the close of the breaking candle, but in this case in order to have a better than 1:1 RR you have to set your target1 below structure (maybe lining up with 1.27 extension), the other way (the one i'm using) is to wait for a pullback and then sell as soon as you get a 1:1 RR at the retest of the lows. And then maybe you can split your position and take target2 at the extension.
It's up to you.
Feel free to comment below if you want to share your viewpoint or ask some questions.
See you in the next chart!

Long Term Short on GOLD Very nice trend continuation setup on XAUUSD. This is definitely a longer term hold, but if you have the discipline and patience to hold on to it, this could be a very good trade.
Price action is putting in a double top right at the 38.2 Fibonacci retracement level which happens to line right up with a nice support level to the left. Now we know structure acts like a magnet, so if this level will hold, my prediction is that we will roll over and continue lower ultimately reaching 1054.00
Now before I get a bunch of comments about how crazy I am due to some fundamental reason or analysis, just know that this is a prediction based purely on the technical of the chart in front of you and nothing else.
As always follow your plan
Good luck and Good Trading!

Basic structure trade on NZDJPYHey guys,
this is a very basic concept of a structure trade. As you can see above on NZDJPY price just came out from a consolidation period and put new structure highs. At this moment i know my bias would be long; but i can't enter a trade long on the top of the movement, i should wait for price to give me a better entry in order to catch the upward move.
My analysis on higher timeframe tells me that price should test 83 flat and that's why it would be my second target. Anyway, the previous resistance should now becomes support and it lines up with .618 retracement of the impulsive move that break the consolidation pattern.
For all those reasons i'm going to wait for the close of the current candle and see what it tells me. If it'll hold i'm buying this up, hoping for, at least, a retest of the highs and then maybe a move further on.
If you have any question. feel free to comment below.
Otherwise, see you in the next chart!

EURJPY: Previous Structure Resistance Well if you've been following my daily trading blog then you know that I've been on a pretty good streak as of late. Funny how that goes hand in hand with me NOT posting to Tradingview for a week. of course that means that I've probably jinxed this trading opportunity..oh well too late now.
Similar to the AUDUSD, GBPUSD, NZDUSD & Silver trades that we've been looking at this week, price is at a point where it is retesting a previous level of structure support. Although we've had a bullish rotation here on the hourly, this is the first real test of the lows of our previous sideways channel.
Seeing how we traded in that channel for a good period of time I would anticipate some selling pressure at that level both from new sellers entering the markets and bulls taking profits.
Hard to see on this chart because it's zoomed out, but we also have the same type of price action leading up into the zone as we did with the GBPUSD meaning the high momentum move followed by the fading rising wedge.

USDJPY: Potential 2618 & Advanced Pattern Formation & a voteHappy Friday traders! Great to see everyone survive another week in these wild wild markets! Last night we were looking for a potential bullish 2618 trade to occur here on the USDJPY as a more conservative approach for those looking to get long.
If we get a completion, it would also represent the "C" leg of a potential advanced gartley formation providing traders with the opportunity to ride price up and then stop & reverse for a move back down (assuming it fits your plan).
We had a nice move on the previous 2618, but now it's pretty difficult for me to get a read on what Yen's next move is. There's not clear level of major support present so when talking to traders about this pair, we've been going over using a cautious approach.
Have a great weekend and also, lately I've been taking votes for what pair you'd like me to analyze in my Forex market Preview video. So if you have one that you like shoot it in the comment section below before Sunday!

EURCAD LONG Opportunity ?It seems we have an opportunity to LONG this pair, based on Elliott wave count on a wave 3 minuette time period and breakout of structure including use of 0.50 ~ 0.618 fibonacci, which both line up. Stochastic indicates a small move down before moving upwards and MACD 4C indicates the finalising of wave 2 minuette in preparation for a wave 3 minuette.
----------------------------------------------------------------------------------------------------------------------------------------------------------
DISCLAIMER: This chart is for sharing and educational purposes only and is not intended to be a signal service or similar.
Please do not trade this chart if you do not have your own strategy. Trade only with your own strategy.
Some very wise words: Plan your trade and trade your plan... and IF in doubt, stay out.
.....::::: If you like this chart, please click on the THUMBS UP ! :::::.....
----------------------------------------------------------------------------------------------------------------------------------------------------------

Going Bearish on USDJPYNow last week I went short on this pair and banked a couple hundred pips. I just put out a video on how I will be looking to do the same thing this week. youtu.be
I do believe that its not out of the realm of possibility to see this pair retrace down to 111.000. Which as you can see is only a 38.2 Fibonacci retracement of the entire leg up.
Here on the chart we have a potential 2618 setup that can be used to enter on the short side.
I myself will be looking to take off the first half of my position around 115.26. That way I can lock in some profits and then look for some extended targets around 111.05.
Now I know that the popular opinion out there is "Dollar Strength" but I think we might start seeing some relief in the dollar, and I believe that this potential setup my provide a great opportunity.
As always, follow your rules and trade your plan.
Good Luck and Good Trading

USDCAD: APutting In A Potential Right ShoulderDollar weakness in the markets have driven us down over 300 pips before finally looking as if we may see some relief. If you "look left" on this chart you'll see that current price action has made it's way down to an inside level of potential structure support which may also end up being the right shoulder in a potential head & shoulders pattern.
I

AUDJPY Counter trend tradeHey guys,
second analysis today, here on audjpy we can see we are testing a former resistance level. At this point price gave us a long wick to the top candle (selling pressure) followed by an engulfing candle. All seasoned with RSI Divergence.
That's enough for me to trade.
Currently i'm waiting for a pullback in order to enter short.
First target at roughly 1:1 RR, second along with structure.
Stops above the wick.
If you want to share your viewpoint, please do it beneath.
Otherwise, see you in the next chart!

EURUSD Trend Continuation tradeHey guys,
here on EURUSD we have a nice trading setup, since we broke below the most recent low and now we are pulling back to the resistance zone. I've outlined a box (between ex support and actual resistance) and in there i'm looking for a candlestick formation, considering we've already entered an OVERBOUGHT condition.
Trade simple.
If you have any question or remark, please fill the comment section below.
Otherwise, see you in the next chart!
