Structure-trade


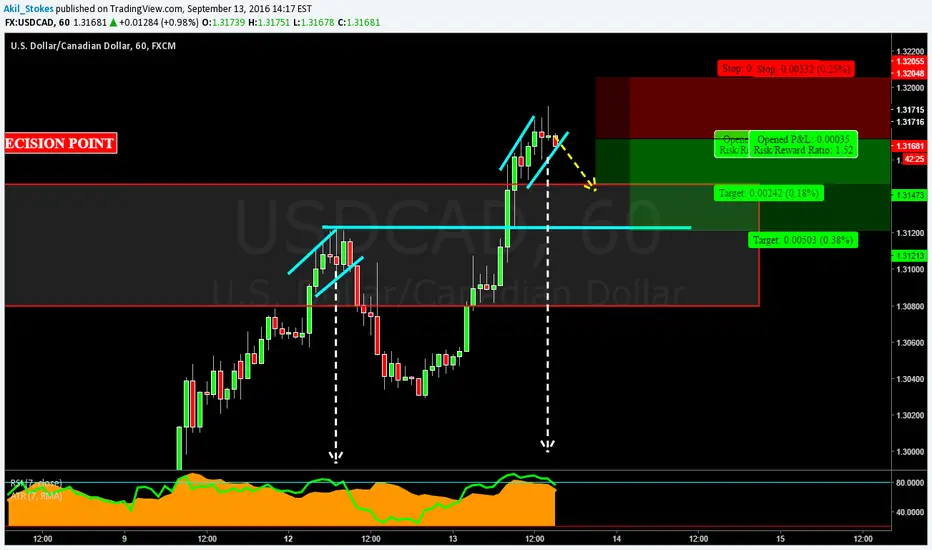
USDCAD: The Rising Wedge Pattern ExplainedAs price action blew through the potential double top that we were watching this morning in the Live Trading Room, we had to throw the idea out and start looking for other opportunities.
Currently we have a setup on USDCAD that I really like. It's called a rising wedge. This setup starts with a strong bullish move then as selling pressure starts to enter the market (from actually sellers, and from buyers who are selling to take profit), momentum starts to slow & price begins to flaten out. When combined with divergence on the rsi (and for me) a good level of structure, it makes for a very tasty trading opportunity.
So what's wrong with this situation? Well the fact is that we're so close to structure that there just isn't enough room to get a good enough risk to reward ratio. So I'll have to play the sidelines and watch.
Now before you think about forcing this trade REMEMBER THIS if there's one thing that we know about trading it's that "THERE WILL ALWAYS BE ANOTHER GOOD OPPORTUNITY"
Good luck out there traders! And thanks to all of you that were so quick to comment on my latest video blog!
If you Missed the Breakout, don't worry. Here's your 2nd chance!NzdUsd finally broke above that resistance level that it had been up against late last week. If you missed the breakout, you now have a chance to hop on with a trend continuation setup. Now price has put in a double bottom at this level w/rsi divergence, so you can use this as an entry. I personally use the 60 min for entries, but my trading time frame is the 240 min chart. Since the 240 is my TTF I will use the ATR from the 240 to set my stops. Here on the chart, I have a 2 ATR stop below the low of the double bottom. Target 1 is a retest of the structure highs and target 2 is a Fibonacci extension of the current impulse leg.
Now a more conservative place to put stops would be below the lows of our impulse. You can do this, and this is the safest way to place stops. I just personally use ATR when entering on double tops and bottoms. I just put out a video, breaking down this trade along with a few other trade ideas that I will be watching this week. So if you are interested here is the link. youtu.be
Good luck and Good Trading

USDJPY Long - Structure TradeIgnore the purple - that's a potential Gartley pattern on the daily time frame. While I wait to see whether price action completes the Gartley I am looking at a potential structure trade. Price action has been in a pretty strong uptrend but we can see bearish divergence on the RSI. So looking for a pull back down to previous structure for a long entry.

AUDCAD - Structure TradeA number of possibilities on this trade. Price action closed just below the support of the flag with RSI not oversold. If price continues down to previous low there may be a possibility to go short on the pullback. That would also trigger a double-bottom which could create opportunities to go LONG!


Gartley pattern at a great levelSorry for posting it late, I have been busy. I actually left my orders with an ATM strategy and I got filled but the stop and targets were not placed. I guess that is why we forward test, right? I have no idea why that happened but I will have to figure it out. Anyways, if you front run your orders you may have been filled. We are on a bullish trend and with room left to go higher.
Good trading! Follow your plan!!


EURJPY - Bullish 2618+++ Don't forget to LIKE & Follow+++I have my eyes on a potential Bullish 2618 Setup on 15M here on EURJPY, and I think this is perfect counter trend trading opportunity .
You may ask why?
We don't only have a conservative entry reason in the face of this 2618 but we can stack on it.
The Double Bottom(foundation of 2618 Setup) is right at Structure Low - look left on HTF (1H).
The 0.618% is right at the V of the Double Bottom - and our kill zone start from there.
Not to mention that on left Bottom we have a RSI under 20 with a RSI DIV on 2nd Bottom.
You can enter aggressively right @ 0.618 or you can look for alternative entry reason - either way you choose you'll get more than 1:1 Risk/Reward.
No matter how perfect this setup is, stops are below this Double Bottom and 1st Target Retest of the cycle high - you can shoot 113.30 for 2nd Target.
Good Luck!
-Alex
I'm a Professional Currency Trader & Mentor with years of trading experience.
Download my Free Ebook & transform your trading Today! bit.ly
If you'd like to see more good trading ideas from me, click the "Like" button!
You can get my trading ideas immediately, just make sure to follow me.

USDCAD: Gartley, CTS & TCT Trading Opportunities Hey traders, the USDCAD as recently just broken a level of previous structure support opening the doors to some new analysis & new predictions.
As I break down this price chart the opportunities that I have on my radar are
LONG: A bullish Advanced Gartley Formation and a CTS trade featuring an AB=CD pattern at previous structure support.
SHORT: If we get a pullback into previous structure a trend continuation opportunity in advance of the potential trades mentioned above.
Syndicate members this trade was featured in tonight's video. Non-Syndicate members I just released a video doing some analysis on the EURUSD as well as walking you through the trade that I posted earlier in the week.
Akil Stokes
Chief Currency Analyst & Head Trading Coach
www.TradeEmpowered.com -The Premier Online Trading Education Company
Trade Empowered on YouTube goo.gl
Facebook: goo.gl
Twitter: goo.gl
Instagram: goo.gl
Periscope: goo.gl

USD/JPY: MAJOR STRUCTURE ON THE SPOTLIGHTAs USDJPY goes downwards, found support around @100.900, retested six times in the last
days, so it has become a major level of structure,
Right now waiting for a better price to enter in a long position
Optional targets may be the previous structure high
Remember Traders "Eyes on your mind, not on your trade"
Thanks
CortesTeam

EURUSD: A Very Interesting Scenario--> Bull Trade/Bear CypherInteresting situation that we have here on the EURUSD dollar. 1st and foremost the long that I took on the Sunday achieved initial targets at 1.1148, stops have moved to lock targets in & I'm shooting for 1.1220's to remove the next part of my position. (I'll walk you through this trade in Thursday's Video, if you haven't seen it already)
However, we also have a potential bearish Cypher formation which would complete at 1.1192. In the Syndicate I'm all flat the earlier trade because of our 1 in, 1 out rule so I have orders in place to short the Cypher if it completes.
However in my personal account I'm going to allow the initial trade to play out and then look to catch the Cypher at a higher level if the opportunity allows me to.
I always mention how trading is a "give & take" type of game. Well if you're going to be a trader that shoots for multiple/extended targets, sometimes it means passing up on other opportunities in order to let you idea play out. Unfortunately the hard part is that it also sometimes means making adjustments so that your don't get burnt. That's the part that comes with experience.
I'm sure we'll talk more about this in the Live Trading Room today as well as in tomorrow's YouTube video.
Akil Stokes
Chief Currency Analyst & Head Trading Coach
www.TradeEmpowered.com -The Premier Online Trading Education Company
Trade Empowered on YouTube goo.gl
Facebook: goo.gl
Twitter: goo.gl
Instagram: goo.gl
Periscope: goo.gl

Quick setup to join the trend.Nothing fancy here, just normal support/resistance rules with few bonuses
What i do like of the setup is the 100 EMA acting as resistance, and the .618 retracement of the last impulse leg coming right around too.
Nice divergence overbought in the RSI forming a double top, let's see.
Keep it simple, and focus on the process
Twitter: @JeanC680
Jean

EUR/CAD - Simple structure playA simple structure trade. If we make it up to the resistance zone around 1.4530-14550 I anticipate sellers to re-enter and we should then see a move down towards 1.4460-1.4450 if the sellers are able to stay in control.

Cypher pattern comming to us soon !Look for sells in green area!
Target1: 38.20% retracement: 1.1135
Target2: 61.80% retracement: 1.1100
Stops go above X point!
Let the pips be with us ! Good luck.

USDCAD: Retest of previous structure SupportOne of the trades looked at in this morning's Live Trading Room session. Long USDCAD at 1.3019's on a retest of previous structure support.
Used an aggressive entry, but this opportunity as an excellent risk to reward on it.
Akil Stokes
Chief Currency Analyst & Head Trading Coach
www.TradeEmpowered.com -The Premier Online Trading Education Company
Trade Empowered on YouTube goo.gl
Facebook: goo.gl
Twitter: goo.gl
Instagram: goo.gl
Periscope: goo.gl

GBP/JPY: structure and fib confluenceAs we go down making lower lows, the price is getting close to a very nice point of confluence at @134.000 even handle
At this point we have the following:
61,8% fib retracement
1,272% fib extension
Structure alignment: support
We think we might get filled in this trade next week
Remember Eyes on your mind, not on your trade
Cortes Team
Thanks !

XAU/USD: Closing into a major support !After a dive of the past two weeks finally we are approaching an important level of structure
this support is in confluence with a minor fibonacci (0.50%)
In the higher time frames this could be seen as a Trend Continuation Trade, but for us, we just want to chunk some pips out of this leviathan that is why 61.8% is target 2
Remember guys: Eyes on your mind, not on your trade
Thanks
CortesTeam

Structure trade breakdown w/videoI just put out a video breaking down this trade that I entered last night. Here is the link.https://youtu.be/FZDU2nAuipc. Its a simple trend continuation trading setup, but it shows the value of knowing how to read structure. Also those who have already seen part 1 of the "pro trader course" that I am putting out on youtube, part 2 will be put out on 7/31/16. We will be covering Fibonacci, simple patterns and an introduction to harmonics. If you're interested in this, be on the lookout for the video. Thanks

USDJPY - Structure Trade+++ Don't forget to LIKE & Follow+++
I have my eyes on potential structure trade on 1H, USDJPY - looking for shorts.
If you look left you will see that price closed lower than PB (PullBack), confirming a bearish rotation in the market.
We can clearly see a kill zone(blue box) between previous PB and structure - and it should come as a surprise for you that price hit that kill zone and reversed.
I'm expecting price to test once again the that cycle top forming a Double Top with RSi being overbought on left top.
Stops will be based on that Double Top, for targets - retesting the NSL. We will get a little bit more than 1:2 Risk/Reward for that bearish rotation opportunity.
Good Luck!
-Alex
Professional Currency Trader & Owner of www.beaprofitabletrader.com
If you'd like to see more good trading ideas from me, click the "Like" button!
You can get my trading ideas immediately, just make sure to follow me.

AUDUSD: bullish outlook, but AUS CPI and Fed cause risksWhen looking at the daily for AUDUSD, I believe there's a clear uptrend visible, indicated by the orange trend line. H4 also shows lower lows and higher highs . Moreover, the lower level of the support area (indicated by the green arrows) has been tested multiple times and seems to be holding .
These are indicators that the pair could trend higher. We've seen a strong movement up to the first resistance level. From there, it's reasonable to think there will be a short retracement to previous levels, before continuing further up to the next key resistance level.
However, the upcoming Australian CPI announcement and the Fed's interest rate decision could invalidate this idea if the data proved to be different from the consensus so far. Anyone taking a position (any position really) should take care to keep in mind theses upcoming economic news releases.
For more forex insights and trading ideas, visit smartforexlearning.com and twitter.com
