EURUSD: Two Levels on my Radar Part IIIThe Euro is still one of the main pairs on my trading radar as it has been all week. Although we've yet to reach the level where I have buying interest we have been able to take a few bearish day trades in anticipation.
(If you missed my rant yesterday on the USD Bulls and the game they played during the FOMC yesterday make sure you check out yesterday's Syndicate video. Very Sneaky!)
In today's day trading session I'll be looking for yet another bearish TCT opportunity in anticipation of us reaching our lower levels of structure support as there looks to be about a 40 pip range which is more than enough for the lower time frames.
Swing trading wise, I'm still looking to buy starting at our Green box, but not aggressively so I'll have to wait for price action to dictate my decision making as I watch it test that level.
Akil Stokes
Chief Currency Analyst & Head Trading Coach
www.TradeEmpowered.com -The Premier Online Trading Education Company
YouTube goo.gl
Facebook: goo.gl
Twitter: goo.gl
@AkilStokesRTM (Instagram, Periscope, Snap Chat & StockTwits)
Structure-trade

EURAUD: Looking for a Bearish RunIf we end up getting a LLLC here on the EURAUD, my prediction for the next place that we'd see some buying pressure at is down at the 1.5050's-1.4950's level.
As a buyer, that's where I would look next if I'm interested in trying to catch a pullback. If I'm a seller, then I'm looking for a retest of previous structure & a chance to hop on the downward move in anticipation of the level mentioned above.
Akil Stokes
Chief Currency Analyst & Head Trading Coach
www.TradeEmpowered.com -The Premier Online Trading Education Company
YouTube goo.gl
Facebook: goo.gl
Twitter: goo.gl
@AkilStokesRTM (Instagram, Periscope, Snap Chat & StockTwits)

BIOCON - SHORT (INTRADAY CALL ON HOURLY CHART)IT SEEMS WEAK AS EXCESS SELLING IS BEEN OBSERVED DURING THE DAY. I BELIEVE IT WILL BE A GOOD SHORT FOR TOMORROW.
RISK REWARD: 1:8

EURUSD: Two Levels on my Radar Part IIIf awake at the close of the 5am candle I would have jumped in the double bottom long. Fortunately (this time) I missed out on what looks like may be a failed test as we've broken (but not yet closed) below.
This means all eyes are on the lower level of structure mentioned in yesterday's post around the 1.1160'd-1.1140's level.
It would have been great if the 1.168 fibonacci extension & one-to-one measured move lined up with that level instead of lower. But stops need to be beyond the lower support zone regardless so it doesn't effect the trading opportunity all to much.
Certainly a pair that we'll be keeping an eye on during today's trading session.
Akil Stokes
Chief Currency Analyst & Head Trading Coach
www.TradeEmpowered.com -The Premier Online Trading Education Company
YouTube goo.gl
Facebook: goo.gl
Twitter: goo.gl
@AkilStokesRTM (Instagram, Periscope, Snap Chat & StockTwits)

USDJPY double Bottom Weekly ChartStraight forward Double Bottom trade, previous area of support, we have rejected this area before

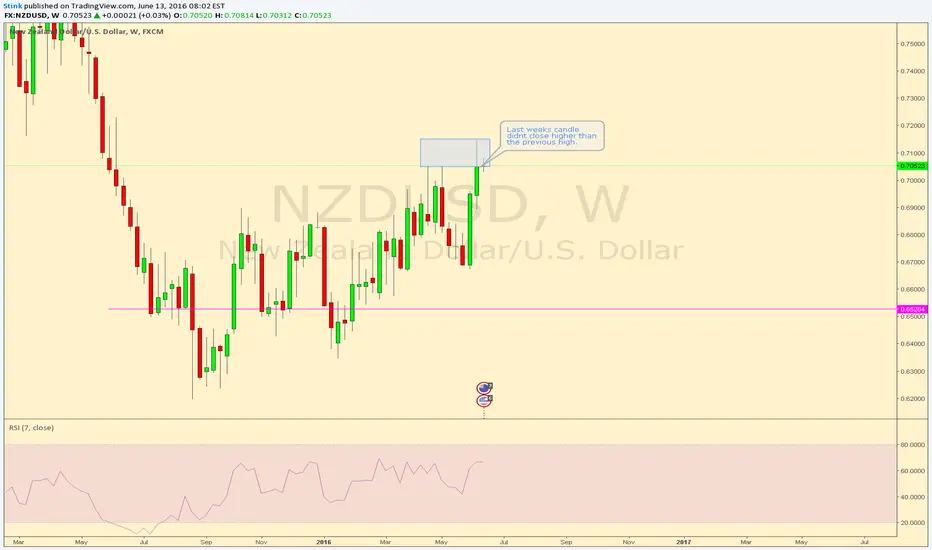
NZDUSD Weekly Double Top Straight forward Double top, possiblity of a 2618 depending on how things progress.
But last weeks candle didnt close higher than the previous high, previous area of Resistance.
EURUSD: Two Levels on my RadarI have two levels on my radar looking for long entries on the EURUSD. The first is our current level of previous structure where the RSI has already dipped into oversold territory and the second is beneath that near the 1.1150 level.
After a heavy week of training over the past 7 days, I'm excited to flip the focus back to "Trading" and hopefully I can make up for some of the big losses that the market handed me.
But as I tell the traders I work with, there's no need to force it. Good opportunities come to those who wait, and to those who follow their plans. Good luck this week traders!!!
Akil Stokes
Chief Currency Analyst & Head Trading Coach
www.TradeEmpowered.com -The Premier Online Trading Education Company
YouTube goo.gl
Facebook: goo.gl
Twitter: goo.gl
@AkilStokesRTM (Instagram, Periscope, Snap Chat & StockTwits)

GBPJPY Monthly possible 2618 set up So over the last week or so I have had ideas about getting long and each time I think we have had a double bottom we break structure and push lower.
So taking a step back from teh daily and weekly and having a look at the monthly charts we do have a possible s618 set up happening, this would coinside with the further push lower and also be in or arround teh over sold level on the RSI


POTENTIAL GARTLEY PATTERN FINISHING ON EURCAD 4HA Gartley coming to a finish on EURCAD 4H. First target @ .382 retracement, Secondary @ .618. Decent R/R ratio. RSI coming into oversold favoring a LONG entry @ around 1.43201.

GOLD: Potential Retest & Extension With GOLD putting in a HHHC I would now look for a continuation to the upside. IF price is going to continue higher THEN then next stopping point I would predict is our previous level of structure looking left.
As always there are 2 ways that price can reach that level. 1) It goes straight there or 2) we see some profit taking, causing a pullback into the previous level of resistance which now act as support before extending higher.
Akil Stokes
Chief Currency Analyst & Head Trading Coach
www.TradeEmpowered.com -The Premier Online Trading Education Company
YouTube goo.gl
Facebook: goo.gl
Twitter: goo.gl
@AkilStokesRTM (Instagram, Periscope, Snap Chat & StockTwits)

Potential Long trade in EURCHFI have identified a Potential trade in EURCHF
Open : 1.1060
SL : 1.1032
TP : 1.1075

EURUSD: Double Top at Previous StructureLooking at a double top at previous structure resistance here on the EURUSD to continue our TCT on this pair. We've also had the RSI go overbought on the initial test while showing divergence on the second test.
We've been watching for this level all week in the Live Room and Jason Stapleton just added it to his radar as well. So Syndicate members, make sure you tune into this morning's Warroom Meeting to see his take.
Akil Stokes
Chief Currency Analyst & Head Trading Coach
www.TradeEmpowered.com -The Premier Online Trading Education Company
YouTube goo.gl
Facebook: goo.gl
Twitter: goo.gl
@AkilStokesRTM (Instagram, Periscope, Snap Chat & StockTwits)

BAT PATTERN FINISHING ON 4H GBPJPYAn odd looking Bat finishing on the 4h of GBPJPY, price action strong on the 886 level, RSI on oversold favoring a short entry. Previous Bat patterns on this pair have paid off nicely. First target @ .382 of CD leg, secondary @ .618. Stops above X which is previous structure higher high.

GBPUSD Possible Double Top on the 4hrFollowing on from my cypher idea on the 60 min chart, we have come back up into previous levels of resistance
If this candle closes in the highlighted area I feel we will see movement downwards as we are in the oversold area of the RSI

Structure Analysis for SilverSince the monthly False Break $SLV has generated between Nov 2015 and Feb 2016, $SLV has exploded higher and broke through a key structure zone (15$) and two weekly SMA lines.
17$ is another Weekly Structure Zone that now $SLV is facing with. It can create some short term pullback in Silver.. even such pullback that will drive it back towards 15$.
The final target zone for $SLV's weekly bullish move, in my opinion, is the 18-19$ weekly structure zone. If and when the price will reach there, it will allow enough time for the 200 weeks MA to reach that zone and add its weight to make it a very strong weekly Sell Zone
Based on this weekly structure analysis, if you want to trade $SLV you should either focus on the 15$ support zone for bullish trades, or wait for $SLV to reach 18.5-19$ to try and short the Sell Zone.
Obviously you can also try to sell the Weekly Structure near 17$, but if you want stronger Price Zones, $15 and 18.5$ are the levels you should pay attention to
Tomer, The MarketZone.net
Follow me on TradingView
Follow my blog - goo.gl
Subscribe to my mailing lists - goo.gl

GBPUSD Cypher complete 60 min Still a valid cypher as not closed passed point X
2 targets at the 318 and 618 good RR

USDCAD: Rising Wedge On My RadarI've got a few pairs on my radar this morning heading into our Live Trading Session and the $USDCAD is one of them looking at this rising wedge iinto fibonacci confluence and previous structure resistance.
Other include $EURJPY & $AUDUSD while I still have current trades in progress on $EURUSD & $NZDUSD
Good luck in your trading this week gang.
Akil Stokes
Chief Currency Analyst & Head Trading Coach
www.TradeEmpowered.com -The Premier Online Trading Education Company
YouTube goo.gl
Facebook: goo.gl
Twitter: goo.gl
@AkilStokesRTM (Instagram, Periscope, Snap Chat & StockTwits)

$EURUSD: Potential Bearish Advanced Bat Formation I'm still involved in a $EURUSD short from last week, so I'm secretly wishing that this doesn't complete. But IF we break & close above previous structure THEN my next shorting opportunity on the $EURUSD will be a Bearish Advanced Bat Formation completing at a previous level of structure. (Look Left, Structure Leaves Clues)
I've gotten a lot of new followers since this originally came out, but if you haven't read it already here's a link to an article that I recently wrote for Forex Trader Magazine titled "Take Control of Your Trading" Feedback as welcomed as I'm rather new to the writing world (aside from personal blogging). I had a lot of fun writing it and if the you guys like my style, I'd love to create some more content
content.yudu.com
Akil Stokes
Chief Currency Analyst & Head Trading Coach
www.TradeEmpowered.com -The Premier Online Trading Education Company
YouTube goo.gl
Facebook: goo.gl
Twitter: goo.gl
@AkilStokesRTM (Instagram, Periscope, Snap Chat & StockTwits)

EUR AUD Another possible 2618 Setup Following on from my other idea where i am Currently short ther is another possible set up happenign which means my second target goign short might need to be adjusted.
will see, we have had a double bottom, broken structure and had our impulse leg which is the 618 point on the short trade

CADJPY: Price Action & StructureHey traders! As you know I like to work on my craft my scrolling through a few pairs that are outside of my trading portfolio and practice my chart reading and predictive analysis.
Her eon the CADJPY 1 hour I would a potential trend continuation setup as price as recently created new structure lows and has started to retrace back into a previous level of support which we'll look to act as resistance.
It's Thursday and I just released my Weekend Review Trading video titled "Trading Consolidation/Breakout Patterns" going over the USDJPY trade that I posted earlier in the week. www.youtube.com
Akil Stokes
Chief Currency Analyst & Head Trading Coach
www.TradeEmpowered.com -The Premier Online Trading Education Company
YouTube goo.gl
Facebook: goo.gl
Twitter: goo.gl
@AkilStokesRTM (Instagram, Periscope, Snap Chat & StockTwits)

Advanced Bat Patter FormationWe have a bearish opportunity on selling at previous resistance,there is also a bat formation wich means a high probability that the price is going to go down at that level.
Hope you enjoy :)

PNB Looks Strongly Bullish It is an ideal time to enter this one as following reasons,
1. Fibs Extension Completed at 1.618
2. Wave 3 completion at Structure
3. Ratio and Structure confluence
4. RSI and MACD negative
Target 1 - 80
