GBPJPY| Bullish Shift in ProcessGBPJPY broke its major lower high on the 4H, signaling a shift in directional intent to the upside. While external liquidity remains intact, I’m monitoring for a potential continuation setup.
On the 30-minute timeframe, price broke a significant high and internal structure is now aligned with bullish order flow. I’ve marked a near-term zone where price may pull back into — specifically watching for a sweep of short-term liquidity within an internal order block.
No rush. Just waiting for price to offer a high-probability entry aligned with refined structure and flow.
— Inducement King 👑
Bless Trading!
Structure

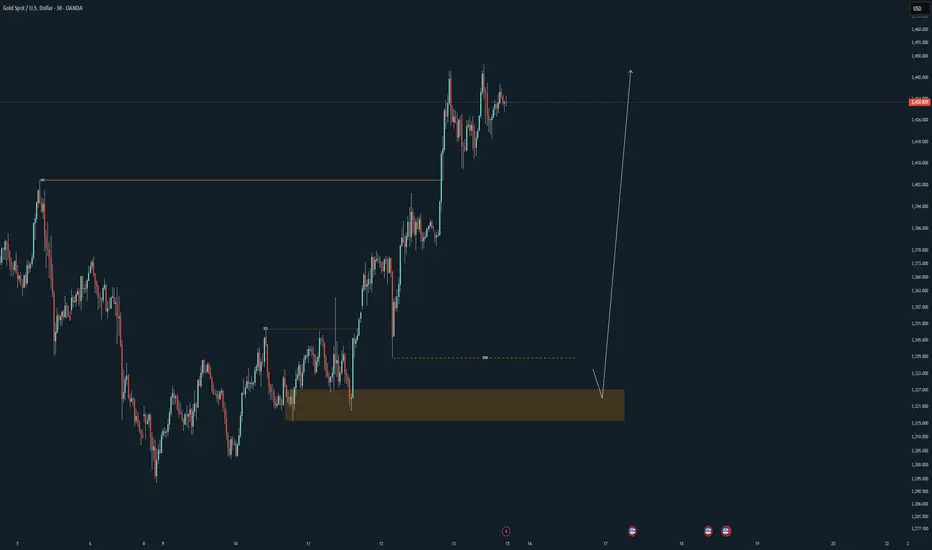
XAUUSD| Bullish Momentum Building with CLean StructureGold continues to show strong bullish momentum, with price steadily climbing and maintaining upward pressure.
I dropped to the 30-minute chart to refine structure, and the bullish narrative remains intact.
At this point, I’m allowing price to develop — waiting patiently for a potential liquidity sweep that aligns with my criteria.
No chasing, no guessing — just reading the market and executing when the story aligns.
Refined structure. Momentum confirmed.
Patiently waiting to act — as always, precision is key.
— Inducement King 👑
Bless Trading!
EU Loading the Next Leg Up| Bullish Bias in MotionEU gave that clean 4H high break — strong bullish intent locked in.
Zoomed into the 30M and spotted that refined structure doing what it does.
Now just sitting tight, waiting on market open to see if price wants to bless the kid with that next leg up.
High timeframe bias is bullish.
Mid-timeframe structure aligned.
It’s patience time — sniper mentality 🧠🎯
Bless Trading!

Caught EU clean today. Waited patiently for that textbook 30M liquidity sweep, then stalked the LTF entry like a sniper. No rushing—just letting price do its thing until it stopped running. Then we pounced. 💥
Execution was sharp. Setup was smooth.
This is how we trade over here—precision, patience, and purpose.
📉 Stay tuned for the breakdown and upcoming analysis.
Would love to hear y’all thoughts on this one 👀👇
#SMC #Forex #InducementKing #EUTrade #SmartMoneyFlow
Bless Trading!

13.06.25 Morning ForecastPairs on Watch -
FX:GBPUSD
FX:EURUSD
A short overview of the instruments I am looking at for today, multi-timeframe analysis down to what I will be looking at for an entry. Enjoy!

XAUUSD Daily Plan — June 13, 2025 By GoldFxMinds👋 Hello traders, and welcome to your full preparation for tomorrow’s gold session.
Gold continues to respect its structural map while liquidity traps remain active on both sides of the range. We’ve seen clean sweeps and fast reactions this week, but tomorrow brings a new catalyst: key U.S. data combined with fresh geopolitical tensions that may fuel additional volatility before the weekly close.
🌐 MACRO & GEOPOLITICAL OUTLOOK:
📊 Prelim UoM Consumer Sentiment & Inflation Expectations are scheduled tomorrow:
Consumer Sentiment ➔ 52.2
Inflation Expectations ➔ 6.6%
These data points often trigger sharp USD moves and liquidity grabs.
🌍 Geopolitical tension has increased as President Trump authorized the evacuation of U.S. personnel from several Middle East locations due to rising threats in the region, particularly concerning the Iran nuclear situation.
This development triggered sharp moves across commodities, with oil rallying strongly.
Gold remains well-supported in this environment as global risk sentiment deteriorates.
Traders should expect elevated intraday volatility and potential liquidity sweeps on both sides as markets digest these developments.
🔎 The combination of macro data and geopolitical risk creates highly reactive conditions where liquidity hunts may precede any clear directional moves.
🔎 STRUCTURE OVERVIEW:
Price remains inside premium territory after recent bullish expansions.
Liquidity has already been taken above and below earlier this week, but additional traps may unfold before Friday’s close.
Larger structure remains bullish while short-term supply zones may attract quick inducements.
Tomorrow's flow will likely begin with manipulation during or after news, before real momentum develops.
🎯 BIAS
Main bias: Controlled bullish, but highly reactive inside premium.
As long as price holds above 3340, bulls remain in control on higher timeframe.
However, premium zones above 3395 may act as liquidity traps, inviting fast selloffs after inducements.
Best opportunities likely to come from either:
Controlled retracement into buy zones for continuation higher.
Fast spikes into premium traps for short-term sell opportunities.
Patience will be critical as both news and geopolitical headlines may trigger manipulations before real trend unfolds.
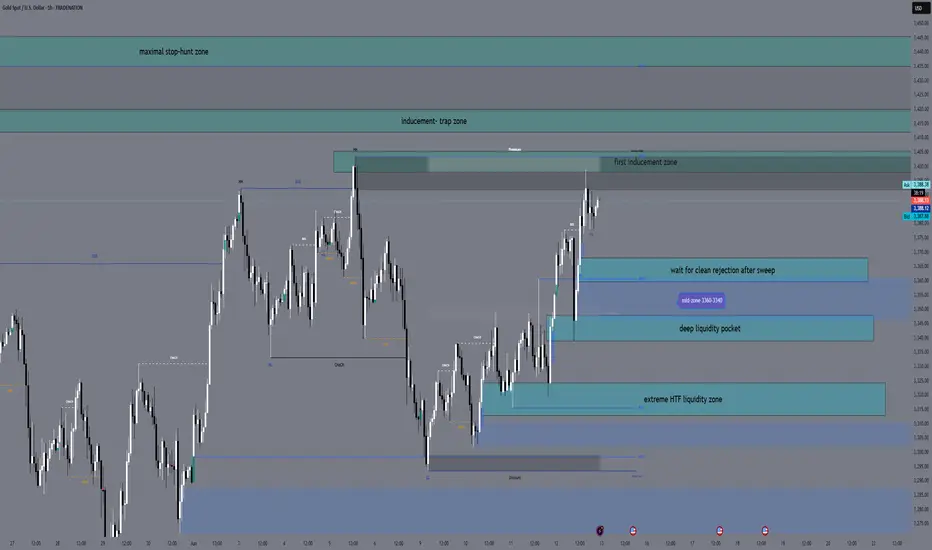
🔑 KEY ZONES TO WATCH:
BUY ZONES
🔵 3368 - 3360
Intraday pullback zone.
Look for minor liquidity dips followed by bullish rejection.
Targets: 3390 → 3405.
🔵 3348 - 3340
Deeper liquidity pocket into H4 imbalance and OB.
Engage only after strong downside sweep with sharp bullish reaction.
Targets: 3380 → 3396.
🔵 3325 - 3312
Extreme HTF liquidity zone.
Valid only if aggressive liquidation occurs into deeper discount.
Targets: 3360 → 3380.
SELL ZONES
🔴 3398 - 3405
First premium inducement area.
Look for fast spikes with M15 bearish rejection candles.
Targets: 3370 → 3348.
🔴 3412 - 3420
Secondary premium trap zone.
Valid only after upside wick rejection.
Targets: 3385 → 3355.
🔴 3435 - 3445
Maximum stop-hunt exhaustion zone.
Only valid if price aggressively squeezes into final liquidity.
Targets: 3390 → 3360.
⚠ TRADING REMINDER:
Friday’s session will likely be driven by both news and geopolitical headlines. Let liquidity play out inside the zones, wait for clear rejection signals, and execute with full confirmation. No chasing — sniper discipline only. 🎯
💎 Hit that 🚀 if you found this plan helpful.
👉 Feel free to follow for daily gold plans and share your thoughts in the comments.
We remain disciplined. We trade structure.
🌙 Rest well tonight — tomorrow we execute with precision and control.
— GoldFxMinds
EU| Workflow - End of Week but Still in SyncPrice still pushing with strong bullish conviction, so I’m just flowing with it and waiting on that precision entry — nothing forced, just discipline and patience.
Even though we’re nearing the end of the week, the workflow and higher timeframe analysis still align, so I’m staying ready. I’ve got my zones mapped out and I’m watching for price to pull back into that green zone POI. Once that mitigation happens, I’ll drop to the 1M for the structure shift and look for that 5M LH break to confirm my entry.
Just letting the setup mature and keeping emotions out of the way. 📊
Always open to hearing how others are viewing EU right now — let’s elevate the convo while we wait on the market to give us the greenlight. 🎯
#SMC #EU #SmartMoney #TopDownPrecision #InducementKing #JuicemannnStyle #ForexFlow #EndOfWeekExecution
Bless Trading!
12.06.25 Morning ForecastPairs on Watch -
OANDA:JP225USD
FX:AUDJPY
FX:USDJPY
FX:GBPJPY
A short overview of the instruments I am looking at for today, multi-timeframe analysis down to what I will be looking at for an entry. Enjoy!

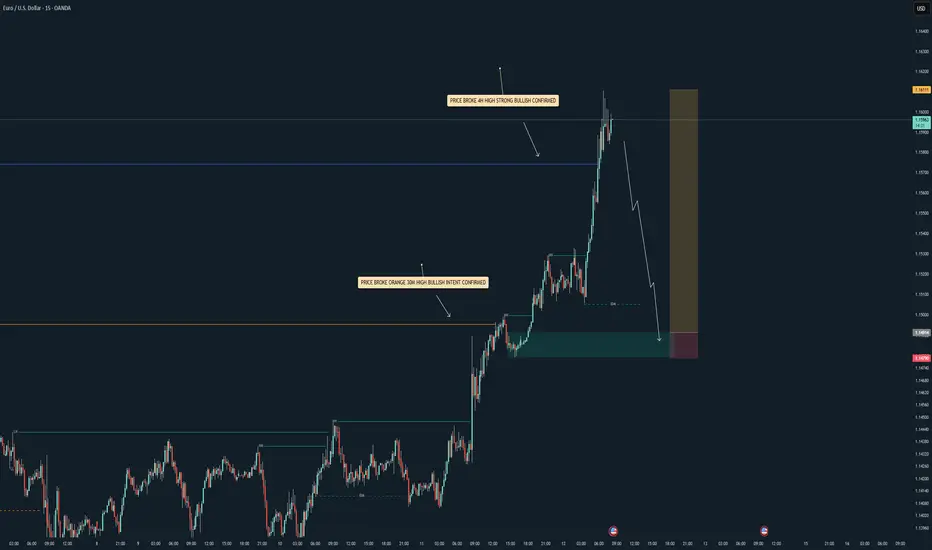
EURUSD| Riding the Real FlowInitially waited for price to return to my first POI — didn’t happen. Instead, price BOS’d and unlocked fresh liquidity. No panic. I’m not here to force old zones — I follow structure.
Now we’ve got:
✅ 4H bullish momentum still active
✅ Fresh BOS creating new intent + liquidity
✅ 30M heavy bullish push showing strength
✅ Top-down alignment from 4H → 30M → 5M
✅ Mitigation + sweep + OB entry on deck
That clean demand zone is holding value — I’m just staying patient, letting price do its thing. As always: “We sit. We wait. We strike.”
When it aligns — I’m in. Until then, I’m chilling like the sniper I am.
#SMC #JuicemannnFlow #TopDownMastery #ForexSniper #StructureTalks #InducementKing #EURUSD #RideTheMomentum #4HTo5M #LiquidityReads #FundedTraderMoves
Bless Trading!

11.06.25 Morning ForecastPairs on Watch -
PEPPERSTONE:COCOA
FX:GBPAUD
FX:CHFJPY
A short overview of the instruments I am looking at for today, multi-timeframe analysis down to what I will be looking at for an entry. Enjoy!

EURUSD| Buy Flow In PlayGot price respecting my top-down flow — 4H to 5M is in full alignment right now. We swept key liquidity levels and price held structure clean, giving me reason to look for a buy continuation.
Could’ve posted a more detailed breakdown (order blocks, FVGs, etc.), but I’ll save that sauce for another time. Just curious what y’all see here — feel free to share your take on this play. I’m always open to sharp minds tapping in.
Let’s see how this unfolds. 🧠💧
#EURUSD #SmartMoneyConcepts #LiquiditySweep #PriceActionTrading #TopDownAnalysis #InducementKing
Bless Trading!

10.06.25 Morning ForecastPairs on Watch -
FX:GBPJPY
FX:EURJPY
FX:USDCHF
A short overview of the instruments I am looking at for today, multi-timeframe analysis down to what I will be looking at for an entry. Enjoy!

AUDJPY Market Forecast – Level 3 Completion & Potential ResetThis chart illustrates a classic Market Maker 3-Level Rise Pattern:
Level 1: Initiated after a consolidation phase, marked by a clear shift in structure.
Level 2: Continued bullish expansion with stronger impulsive candles.
Level 3: Price reaches an overextended zone with signs of slowing momentum, indicating a potential distribution or retracement phase.
Key Forecast:
A retracement is expected toward the 93.297 zone, which aligns with:
Possible reaccumulating point before continuation
This move may serve as a manipulation trap to grab liquidity below recent lows before pushing higher. If price reacts strongly at 93.297 with bullish structure, a long setup targeting new highs (~94.40+) is favored.

09.06.25 Morning ForecastPairs on Watch -
FX:USDJPY
FX:AUDNZD
FX:AUDJPY
FX:CHFJPY
A short overview of the instruments I am looking at for today, multi-timeframe analysis down to what I will be looking at for an entry. Enjoy!

06.06.25 Morning ForecastPairs on Watch -
FX:EURUSD
FX:AUDUSD
FX:USDJPY
FX:AUDCAD
A short overview of the instruments I am looking at for today, multi-timeframe analysis down to what I will be looking at for an entry. Enjoy!

EURUSD - SellEntered this earlier on the 1min TF
Target will be the first Order Block which is 21:RR.
The reason I am targeting here is the 4H order flow is still bullish. So if we can hit the target I close 50% of the position and let the rest ride and manage accordingly to price.
Lets see how it plays out

05.06.25 Morning ForecastPairs on Watch -
FX:AUDUSD
OANDA:XPTUSD
A short overview of the instruments I am looking at for today, multi-timeframe analysis down to what I will be looking at for an entry. Enjoy!

04.06.25 Morning ForecastPairs on Watch -
FX:EURUSD
FX:USDJPY
FX:GBPCHF
OANDA:XPTUSD
A short overview of the instruments I am looking at for today, multi-timeframe analysis down to what I will be looking at for an entry. Enjoy!

"When Price Confirms The Vision" NAS100“Go peep my last NAS100 post 📌—I told y’all I wasn’t in the trade, but the lesson was clear. 💡
Price moved exactly how I expected, respecting my key levels and analysis to the pip.
This is why we trust the process, not just the profit. 🧠💰
Study the breakdown, learn the blueprint. The next one’s always around the corner.”
Currently Looking for 2nd Entry
#NAS100 #SmartMoney #InducementKing #MarketStructure #PriceAction #TradingView #JuicemannAnalysis**
Bless Trading!

NZDCAD - Lucrative Range!Hello TradingView Family / Fellow Traders. This is Richard, also known as theSignalyst.
📈NZDCAD has been hovering within a range between the red support and blue resistance.
This week, NZDCAD has been bearish and approaching the red support.
Moreover, it is retesting the lower bound of its rising wedge pattern in blue.
🏹 Thus, the highlighted blue circle is a strong area to look for buy setups as it is the intersection of support and lower blue trendline acting as a non-horizontal support.
📚 As per my trading style:
As #NZDCAD approaches the blue circle zone, I will be looking for bullish reversal setups (like a double bottom pattern, trendline break , and so on...)
📚 Always follow your trading plan regarding entry, risk management, and trade management.
Good luck!
All Strategies Are Good; If Managed Properly!
~Rich
Disclosure: I am part of Trade Nation's Influencer program and receive a monthly fee for using their TradingView charts in my analysis.

03.06.25 Morning ForecastPairs on Watch -
FX:EURUSD
FX:GBPAUD
FX:AUDUSD
FX:AUDCAD
A short overview of the instruments I am looking at for today, multi-timeframe analysis down to what I will be looking at for an entry. Enjoy!

02.06.25 Morning ForecastPairs on Watch -
FX:AUDUSD
FX:USDJPY
FX:EURGBP
A short overview of the instruments I am looking at for today, multi-timeframe analysis down to what I will be looking at for an entry. Enjoy!

NASDAQ Markup- Not in the Trade, But the Lesson's ClearDidn’t take this one—not trading NASDAQ right now—but I still mapped it out from the 30M perspective just to stay sharp.
4H gave bullish intent after breaking the major macro LH, so I followed the flow.
Saw a clean 30M inducement sweep, price then mitigated internal structure OB, and I marked exactly where I would’ve entered with LTF confirmation.
Didn’t trade it, but the logic’s there—and if you’ve been watching… you already know what it’s doing now. 🧠📈
Every setup teaches something.
– Inducement King
Bless Trading!
