XAUUSD – Calm Before the LaunchMarked this IDM sitting under the HH with clean structure flowing bullish on 4H and 30M.
Flipped to the 2H for a smooth Bird’s Eye view—just watching now, waiting for that sweep and micro shift to load up.
The market’s breathing, building up energy. Once it taps in and confirms, it’s game time.
Let the liquidity do the work. I’ll handle the entry.
Bless Trading!
Structure

05.05.25 Morning ForecastPairs on Watch -
FX:USDCHF
FX:AUDUSD
FX:AUDCAD
FOREXCOM:COFFEE
A short overview of the instruments I am looking at for today, multi-timeframe analysis down to what I will be looking at for an entry. Enjoy!

02.05.25 Morning ForecastPairs on Watch -
OANDA:XAGUSD
FX:AUDJPY
FX:EURUSD
A short overview of the instruments I am looking at for today, multi-timeframe analysis down to what I will be looking at for an entry. Enjoy!

01.05.25 Morning ForecastPairs on Watch -
GBP / JPY
GBP / CHF
XAG / USD
NZD / CAD
A short overview of the instruments I am looking at for today, multi-timeframe analysis down to what I will be looking at for an entry. Enjoy!

30.04.25 Morning ForecastPairs on Watch -
GBP / AUD
AUD / JPY
GBP / JPY
EUR / USD
A short overview of the instruments I am looking at for today, multi-timeframe analysis down to what I will be looking at for an entry. Enjoy!

29.04.25 Morning ForecastPairs on Watch -
GBPJPY
AUDUSD
EURUSD
A short overview of the instruments I am looking at for today, multi-timeframe analysis down to what I will be looking at for an entry. Enjoy!

28.04.25 Morning ForecastPairs on Watch -
FX:EURNZD
FX:GBPCHF
FX:USDCHF
FX:EURUSD
A short overview of the instruments I am looking at for today, multi-timeframe analysis down to what I will be looking at for an entry. Enjoy!

25.04.25 Morning ForecastPairs on Watch -
FX:EURNZD
FX:USDCHF
FX:EURUSD
A short overview of the instruments I am looking at for today, multi-timeframe analysis down to what I will be looking at for an entry. Enjoy!

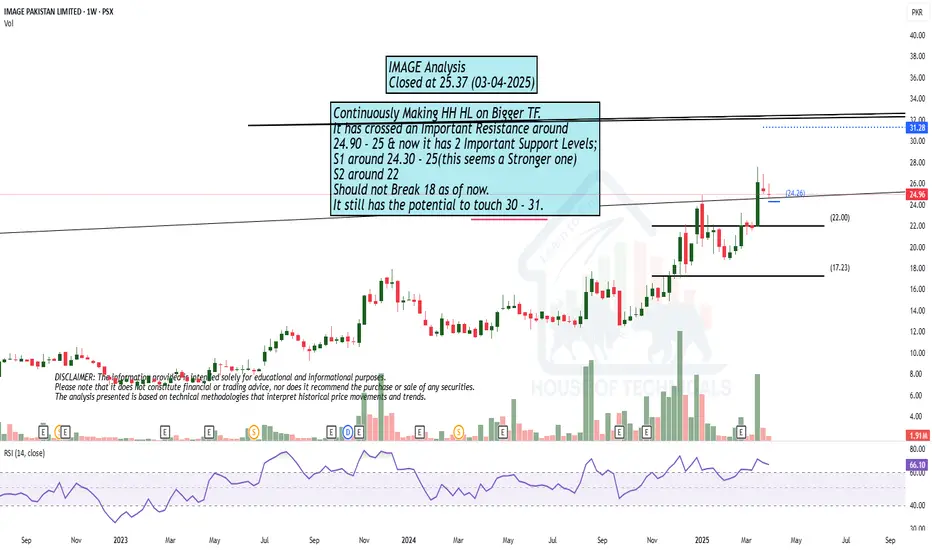
Continuously Making HH HL on Bigger TF.Continuously Making HH HL on Bigger TF.
It has crossed an Important Resistance around
24.90 - 25 & now it has 2 Important Support Levels;
S1 around 24.30 - 25(this seems a Stronger one)
S2 around 22
Should not Break 18 as of now.
It still has the potential to touch 30 - 31.
23.04.25 Morning ForecastPairs on Watch -
FX:GBPAUD
FX:AUDCAD
FX:USDCHF
A short overview of the instruments I am looking at for today, multi-timeframe analysis down to what I will be looking at for an entry. Enjoy!

22.04.25 Morning ForecastPairs on Watch -
FX:AUS200
FX:AUDUSD
FX:EURUSD
FX:GBPUSD
A short overview of the instruments I am looking at for today, multi-timeframe analysis down to what I will be looking at for an entry. Enjoy!

21.04.25 Morning ForecastPairs on Watch -
FX:EURNZD
FX:EURAUD
FX:EURUSD
FX:AUDUSD
A short overview of the instruments I am looking at for today, multi-timeframe analysis down to what I will be looking at for an entry. Enjoy!

Breakout from a Parallel Channel.
Breakout from a Parallel Channel.
Monthly Closing above 20.20 - 20.30
would be a positive sign.
Re-tested the Breakout leve around 21.20
Stoploss as of now should be 20.20 with
Buy on Dips Strategy.

18.04.25 Morning ForecastPairs on Watch -
FX:NZDUSD
FX:AUDUSD
FX:EURNZD
FX:USDJPY
A short overview of the instruments I am looking at for today, multi-timeframe analysis down to what I will be looking at for an entry. Enjoy!

Breakout Retest Possible?431 - 433 is a Good Support level as of now.
However, Extreme Pressure may bring the price towards
420 - 429 which is also the breakout re-test level.

17.04.25 Morning ForecastPairs on Watch -
FX:GBPCAD
FX:EURAUD
FX:GBPAUD
A short overview of the instruments I am looking at for today, multi-timeframe analysis down to what I will be looking at for an entry. Enjoy!

Still Bullish.Still Bullish.
Long Consolidation Box - Breakout
Still has the potential to touch 26 - 27
Huge Volumes; though candle of 24-03-2025
closed red due to heavy selling but...

16.04.25 Morning ForecastPairs on Watch -
FX:CHFJPY
FX:GBPAUD
FX:EURNZD
FX:USDJPY
A short overview of the instruments I am looking at for today, multi-timeframe analysis down to what I will be looking at for an entry. Enjoy!


15.04.25 Morning ForecastPairs on Watch -
OANDA:XAGUSD
FX:EURNZD
FX:GBPUSD
FX:AUDUSD
A short overview of the instruments I am looking at for today, multi-timeframe analysis down to what I will be looking at for an entry. Enjoy!

BTC — Bullish Momentum in Play. Key Levels to WatchYesterday’s impulse lit up the market and set a bullish tone.
Short-term, I’d like to see continuation — 83,588 is the nearest resistance. Break above it, and bulls could easily push toward 88,500.
On the downside, keep an eye on 77,649 and 74,508 — the origin of the impulse and weekly low. Key spots for bears to defend.
Stay locked in. Big moves often follow clean structure.

11.04.25 Morning ForecastPairs on Watch -
FX:GBPAUD
FX:NZDCAD
FX:GBPUSD
A short overview of the instruments I am looking at for today, multi-timeframe analysis down to what I will be looking at for an entry. Enjoy!

ETH — Still Lagging Behind. Two Levels That MatterETH continues to underperform the market — and it's not just about Ethereum. Most alts showed weakness after yesterday’s front-running impulse ended in today’s fade-out.
Let’s see how they behave on BTC’s next leg up.
As for ETH — only two levels matter for now:
1689 to the upside, and 1485.7 to the downside.
I’ll take action only after a confirmed breakout and hold above or below one of these zones. Until then — just observing.
