25.07.25 Morning ForecastPairs on Watch -
FX:USDJPY
CAPITALCOM:DE40
FX:GBPUSD
FX:AUDUSD
A short overview of the instruments I am looking at for today, multi-timeframe analysis down to what I will be looking at for an entry. Enjoy!
Structureanalysis

AUDCHF expecting bullish contianution
OANDA:AUDCHF interesting structure, trend based analysis, here exepcting bullish continuation.
SUP zone: 0.52200
RES zone: 0.52900, 0.53200

24.07.25 Morning ForecastPairs on Watch -
FX:GBPCAD
FX:GBPUSD
FX:AUDNZD
A short overview of the instruments I am looking at for today, multi-timeframe analysis down to what I will be looking at for an entry. Enjoy!

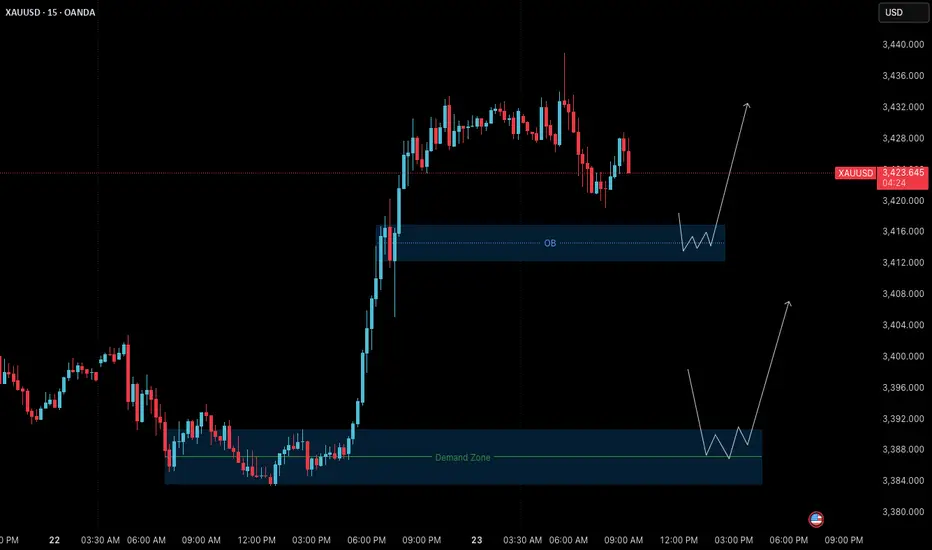
Gold Outlook (23 July): Bullish Structure Retesting Key ZonesGold (XAUUSD) – 23 July Analysis
Structure, patience, and precision define today's opportunity
The market remains in a clear uptrend , and the current M15 structure is undergoing a healthy pullback phase following yesterday’s strong bullish breakout. This retracement brings the price into key zones where continuation setups may form — if confirmed.
📊 Market Structure Overview
• Bullish Breakout: On July 22, price made a strong impulsive move upward from the demand base at 3384–3390 , confirming bullish strength and shifting short-term structure to the upside.
• Current Pullback: After printing a local high around 3439 , the market is retracing toward lower support zones. The pullback is expected and may offer long entries if price respects key areas and confirms.
🔑 Key Reversal Zones to Watch
1. Order Block (OB) Zone
Range: 3417 – 3412
– This zone is the origin of the last bullish impulse.
– Price is nearing this key zone.
– If M1 confirms with internal structure shift + BoS , we may have a valid long setup.
– Target: Previous high at 3438–3440
2. Deeper Demand Zone
Range: 3390 – 3384
– This is the base of the prior impulsive leg.
– If price breaks below the OB with momentum, this deeper zone may act as stronger support.
– Potential swing entry zone with better R:R
📌 Trade Scenarios for Today
🔹 Scenario 1: Rejection from OB Zone (Likely Intraday Setup)
– Wait for M1 to confirm via micro ChoCh + BoS inside 3417–3412 zone.
– If confirmed, plan for long entry with SL below zone.
– Target: 3438–3440
🔹 Scenario 2: Break Below OB → Retest at Deeper Demand Zone
– If OB zone fails, wait for price to drop into 3390–3384.
– Look for M1 confirmation before executing any long position.
– This setup may offer a higher-quality entry with improved R:R.
📈 Trade Plan:
– Wait for confirmation before entry (e.g., M1 structure shift + BoS)
– SL: 40 pips | TP: 120 pips
– Risk-Reward: Always 1:3 minimum
– No confirmation = No trade
🎯 Summary
• Primary Bias: Bullish — monitoring OB zone (3417–3412) for long setup
• Alternative Setup: Buy from 3390–3384 demand if deeper retracement unfolds
• Discipline: Let the market validate your plan. Never force a trade.
📘 Shared by @ChartIsMirror
23.07.25 Morning ForecastPairs on Watch -
FX:GBPUSD
CAPITALCOM:DE40
FX:NZDUSD
A short overview of the instruments I am looking at for today, multi-timeframe analysis down to what I will be looking at for an entry. Enjoy!

22.07.25 Morning ForecastPairs on Watch -
FX:GBPJPY
FX:AUDUSD
OANDA:XAUUSD
FX:GBPUSD
A short overview of the instruments I am looking at for today, multi-timeframe analysis down to what I will be looking at for an entry. Enjoy!

21.07.25 Morning ForecastPairs on Watch -
FX:GBPAUD
FX:EURUSD
FX:AUDUSD
OANDA:XAUUSD
A short overview of the instruments I am looking at for today, multi-timeframe analysis down to what I will be looking at for an entry. Enjoy!

EURUSD & US30 Trade Recaps 18.07.25A long position taken on FX:EURUSD for a breakeven, slightly higher in risk due to the reasons explained in the breakdown. Followed by a long on OANDA:US30USD that resulted in a loss due to the volatility spike that came in from Trump.
Full explanation as to why I executed on these positions and the management plan with both.
Any questions you have just drop them below 👇

18.07.25 Morning ForecastPairs on Watch -
FX:GBPAUD
FX:EURAUD
FX:EURNZD
FX:EURCAD
A short overview of the instruments I am looking at for today, multi-timeframe analysis down to what I will be looking at for an entry. Enjoy!

17.07.25 Morning ForecastPairs on Watch -
OANDA:US30USD
CAPITALCOM:DE40
FX:GBPJPY
A short overview of the instruments I am looking at for today, multi-timeframe analysis down to what I will be looking at for an entry. Enjoy!

16.07.25 Morning ForecastPairs on Watch -
FX:GBPJPY
FX:GBPNZD
FX:USDJPY
A short overview of the instruments I am looking at for today, multi-timeframe analysis down to what I will be looking at for an entry. Enjoy!

AUDUSD good structure for higher bullish
OANDA:AUDUSD whats next, we are have DESCENDING CHANNEL breaked, its followed by bullish push, but its not make to much in my op, at end price is make revers, its stop at end on strong sup zone (0.64900).
We are have in last day-two RBA and RBNZ today, price is start pushing looks like zone 0.64900 can be taked for valid zone, from which now expecting higher bullish push in next periods.
SUP zone: 0.65100
RES zone: 0.66300, 0.66600

15.07.25 Morning ForecastPairs on Watch -
FX:EURUSD
CAPITALCOM:DE40
FX:EURGBP
FX:GBPJPY
A short overview of the instruments I am looking at for today, multi-timeframe analysis down to what I will be looking at for an entry. Enjoy!

14.07.25 Morning ForecastPairs on Watch -
FX:NZDCAD
FX:USDJPY
FX:EURUSD
OANDA:US30USD
A short overview of the instruments I am looking at for today, multi-timeframe analysis down to what I will be looking at for an entry. Enjoy!

11.07.25 USDJPY Trade Recap + Re-Entry for +2.5%A long position taken on USDJPY for a breakeven, followed by a premature re-entry that I took a loss on. I also explain the true re-entry I should have taken for a 2.5% win.
Full explanation as to why I executed on these positions and also more details around the third position that I did not take.
Any questions you have just drop them below 👇

11.07.25 Morning ForecastPairs on Watch -
FX:EURUSD
FX:EURCAD
FX:EURAUD
A short overview of the instruments I am looking at for today, multi-timeframe analysis down to what I will be looking at for an entry. Enjoy!

GBPCAD bearish for expect
OANDA:GBPCAD last 4 ideas on this pair attached, we are have one strong fall, price is make few pushes on sup zone (violet doted), which taking for legal zone, currently price in ASCENDING TRIANGL better visible on 15TF (will make in note), expecting break of same and higher bearish continuation.
SUP zone: 1.85750
RES zone: 1.84500

EURAUD higher bearish for expect
OANDA:EURAUD bullish trend nearly last two months.
Good structure visible, we have breaked trend line, sup zone (1.79100) breaked and DESCENDINGING TRIANGL is breaked, we are have and RBA and RBNZ in last days.
EUR looks like is start losing power and like cant more pushing, from here expectations are for more bearish.
SUP zone: 1.79500
RES zone: 177500, 177000

10.07.25 Morning ForecastPairs on Watch -
FX:USDJPY (live position)
FX:EURNZD
FX:EURUSD
A short overview of the instruments I am looking at for today, multi-timeframe analysis down to what I will be looking at for an entry. Enjoy!

09.07.25 Morning ForecastPairs on Watch -
FX:GBPUSD
FX:EURAUD
OANDA:JP225USD
FX:USDCAD
A short overview of the instruments I am looking at for today, multi-timeframe analysis down to what I will be looking at for an entry. Enjoy!

08.07.25 Morning ForecastPairs on Watch -
FX:EURUSD
FX:USDJPY
A short overview of the instruments I am looking at for today, multi-timeframe analysis down to what I will be looking at for an entry. Enjoy!

07.07.25 Morning ForecastPairs on Watch -
FX:AUDCAD
FX:USDJPY
FX:EURUSD
A short overview of the instruments I am looking at for today, multi-timeframe analysis down to what I will be looking at for an entry. Enjoy!

EURNZD Trade Recap +3% 2nd July 2025A long position taken on EURNZD for +3%. Full explanation as to why I executed on this position and also my management plan I put in place.
Any questions you have just drop them below 👇
