GBPNZD Wait for Breakout to a Major Support or ResistanceHello Smart Trades,
GBPNZD price has a trap inside the triangle, however it would be great if you could wait for breakout the trendlines in order to get the clear of confluences and determine where the price will be move to create the directions either it will continuing up for Double top or breakout the trendlines to creating the lower high.
Mind the zones as critical price of trades physiology where the buyer and seller decide to and Use your core principles of your trade style to catch up the price.
Trade your plan and plan your trade, unto the next analysts.
Cheers,
Ochin_FX
Structuretrade

Another Short!! (ofcourse)Looks like I am very bearish on every stock!! anyways
Going with the trend on this trade which is down! it is a straightforward setup, no complex pattern or anything.
Price action hit the previous structure + Fib 38.2% zone with confirmation
I did not see this trade early enough i am a day late on this trade but the green candle yesterday is showing me, market is giving me another opportunity to get in.
Trading Plan
1. Trade at open
2. Stop loss outside of the zone as well the 50% fib level.
3. target to be at previous structure low.
Good luck!

EURUSD break previous lowEURUSD break previous low
and pulled back to structure
around 1.0940 will be a good area to short
SL : 1.0971
TP : Follow arrow

GBPUSD Daily ResistanceOn this pair (gbpusd) based on my analysis the price hits its previous daily structure which is the resistance level. to confirm that it will reverse to the up side is that we need to see rejecting candles so as false breakout, If not then price will break though daily structure and continue to the downside.

Potential Bearish GartleyHey Traders,
If you analyze this pair on the hourly you would notice that we have recently had a violation of structure, with that said we are unable to confirm a bearish bias till we get that 123 move. However, if price action rallies than there is a trading opportunity to short this market at 0.68367 using an advanced pattern strategy called the Gartley. For traders that are aware of this strategy will know that we enter multiple positions, one target taken off at 38.2 retracement and other at the 61.8. I cannot advise where your stops should go that is down to individuals risk management but all I can say it requires to be above the X leg.
Have prosperous week traders, keep tuned for more trading opportunities.

AUDUSD pulled back to structureAUDUSD pulled back to structure
around 0.6748 will be a good area to short
SL : 0.6790
TP : Follow arrow

USDJPY breakout from structureUSDJPY breakout from structure
wait for pull back
around 106 will be a good area to long
SL : 105.730
TP : Follow arrow

S&P500 pulled back to structure S&P500 pulled back to structure
good to long now
SL : 2900
TP : Follow arrow

USDCAD structure brokenUSDCAD structure broken
and pulled back to structure
good to short now
SL : 1.3150
TP : Follow arrow

AUDUSD break previous highAUDUSD break previous high
wait for pullback to long
around 0.7039 will be a good area to long
SL : 0.6992
TP : Follow arrow

GBPUSD pulled back to structure GBPUSD pulled back to structure
around 1.2520 will be a good area to long
SL : 1.2489
TP : Follow arrow

RIPPLE pulled back to structureRIPPLE pulled back to structure
around 0.32980 will be a good area to long
SL : 0.2670
TP : Follow arrow

USOIL pulled back to structure USOIL pulled back to structure
around 60.45 will be a good area to short
SL : 64.00
TP : Follow arrow

Potential Bullish Bat 4 HourHey Traders,
After analyzing this pair, we have a potential bullish Bat on the 4-hour timeframe. Completing at 1.6963, please do not trade this if it's not part of your trade plan. It's crucial to backtest any strategy you trade and should have solid money management in place. Targets are at 38.2 and 61.8, as for stop losses your on your own. I use the stop loss that I have backtested with.
Anyway, traders, wish you all the best and hope you a prosperous career in trading.

GBPUSD Bullish Opportunity With price approaching 1.3000 zone, multiple bullish opportunities can be available on a 1.30 level that has been tested multiple times in the past. Bullish AB-CD pattern could maybe complete in this Blue Zone. I will be conservative and wait for a Double Bottom to occur, but for more aggressive approaches a Bat Pattern could also be completed at this price level. Note RSI is also going into an Over-Sold state and Fibonacci levels confluence in the zone. Each opportunity has a positive Risk/Reward, Stop Loss is below Major structure for extra protection. FX:GBPUSD

GBP/AUDSignal 1 : waiting for a bounce off the pattern within a pattern to the upside.
Signal 2: if market reaches daily structure will be looking for a sell set up to the bottom of daily trendline structure. using a small pip stop ross Risk to reward is high.
With Brexit in the works and nothing confirmed as of yet, Trade can go either way but the probability is it will see the strength of the pound decrease.

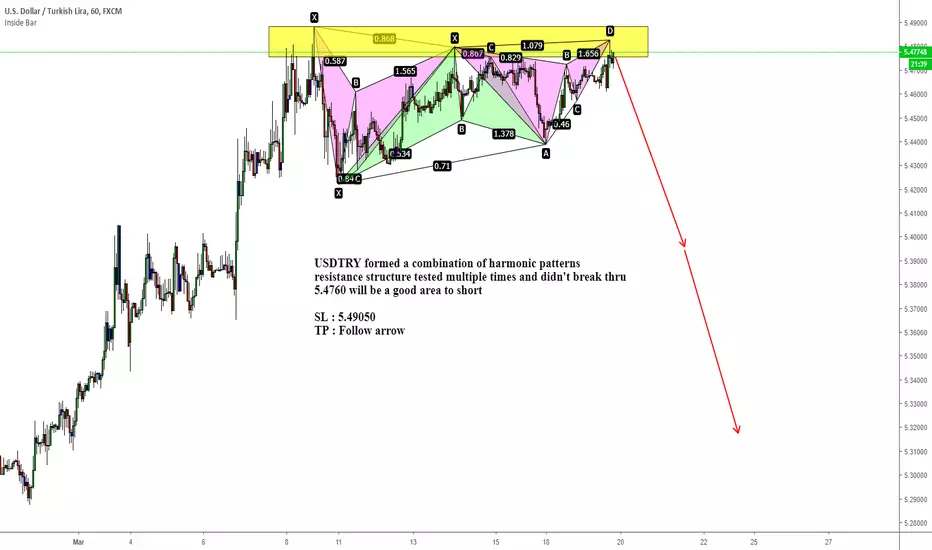
USDTRY formed a combination of harmonic patternsUSDTRY formed a combination of harmonic patterns
resistance structure tested multiple times and didn't break thru
5.4760 will be a good area to short
SL : 5.49050
TP : Follow arrow
GBPUSD-Weekly Market Analysis-Feb19,Wk1On the Daily Chart, I'm waiting for a double top to short GBPUSD at 1.3271, however, in the 4-hourly and 1-hourly zone, I'm waiting for GBPUSD to retrace back into the buy zone for a buying opportunity, minimum a double bottom.
Exact Entry; stops and targets will be shared with my subscribers.

USDCAD SHORT/ LONGER TRADE/ 240HR With a possible expanding flat completed, will be looking for a break of the 4hr trend line and confirmation. If a 1hr confirmation occurs then will be entering this with a target profit of the daily 270 price of 1.26274.

USDJPY-Weekly Market Analysis-Jan19,Wk3Market has to break above and close above the high on 1-hourly chart, then I will be looking for shorting opportunity at 108.91.
Having an ABCD formation that inline within the double top structure, further strengthen the potential downwards movement.
If you don't wish to miss any great trading ideas, just subscribe to us and join us in our inner-circle.
Have a look on our October 2018 results that we shared a total of 2,333pips of Net Profit in a single month. If not now, when?
forex100academy.com


EUR/JPY 1HR SHORT We have a corrective pattern forming this looks to be a contracting flat however cannot confirm this as of yet so will watch closely for confirmation, with this is mind will be looking for the third wave down to complete a 3 wave pattern using the 1hr 270 fib as a target profit at a price of 126.819..

EURUSD 1H BEARLISH GARTLEY PATTERN
Gartley Pattern in 1H timeframe
Stop Loss : 1.1560
Entry : 1.1495
Target 1 :1433
Target 2 :1370
