CYPHER FINISHING ON 1H EURJPYA Bearish Cypher pattern just finished on 1H EURJPY looking to retest .786 entry spot on previous structure. RSI hovering near overbought, favoring a SHORT entry. First target @.382 retracement of CD leg (previous structure resistance), secondary TP target @ .618.
Structuretrade

EURGBP 4 Hr Possible Breakout TradeI have a Long view on this pair up to the D point of the possible cypher.
Looking at how we may get there, as you can see the previous candle came all the way down to previous support and rejected this are and moved up. This current candle is in or around another are of previous support.
If we see the candle close above the trend line I feel we will see a move to the upside

EURJPY Weekly Double bottom PossibleI have been watching the 4hr and Daily Time frames and felt that we had reached the bottom, the pair has pushed a bit further lower as we can see with the wick on this weeks candle
If the cande doesn't close outside of this box I feel we could see a reversal in the coming weeks

EURJPY Double Bottom Forming Daily If the Daily candle doesnt close lower I feel we will see a rise from these levels.
Previous area of Support and has risen from here before

BULLISH BUTTERFLY FINISHING ON 1H EURAUDA nice Butterfly pattern is trying to get to the finish on 1H EURAUD. Price action is currently testing a support @ 1.53607. If the level gives there are 3 nice levels with previous structure lows to determine an ample Possible Reversal Zone. The possible XA extensions @ 1,27, 1.414 and 1.618 range from 1.52970 to 1.52125. What is interesting is that the support being currently tested is a nice target to test as a resistance once the pattern finishes. Watch the price action near the PRZ to make entry as well as the RSI to suggest oversold and long entry.

BEARISH CYPHER FINISHING ON 1H NZDUSDBearish Cypher pattern finishing on 1H NZDUSD. Entry near the .6800 handle, so look out for stop hunters. Entry on .886 recommended for better TP ratios. First target for profit @ .382 of CD. RSI on overbought favoring short entry with slight divergence. Overall trend down, secondary target @ .618 retracement of CD leg. SL placed with some slack above X due to closeness on .6800 handle.

BULLISH BAT PATTERN FINISHED ON 1H GBPUSDA nice Bat finishing on 1H GBPUSD, this trade is a continuation off a previous Cypher and an AB=CD pattern. TP are placed @.382 AD retracement, secondary @ .618. SL placed below X, taking into consideration previous structure lows, look left....This could retest previous support @ 1.4638. RSI oversold favoring a LONG entry.
We´ve done well with this pair hitting T1 on the Cypher, stacking up on the pullback for the Trend Continuation and AB=CD pattern all the way down to this D finish.

BULLISH GARTLEY PATTERN NEARING FINISH ON 1H EURNZDA Gartley pattern is coming to finish on 1H EURNZD. Trade is active on the CD leg of the move. Previous structure low suggests entry @+- the .886 retracement. RR ratio is acceptable to the .382 TP target which could help a further Trend Continuation Trade to the CD finish of another bigger pattern developing. RSI entering oversold limits which favor a long entry.

AB=CD PATTERN OFF PREVIOUS CYPHER FINISH ON 1H GBPUSDAn AB=CD pattern forming CD leg coming off a D finish on a Cypher pattern on the 4h GBPUSD. Trend continuation trade having taken profit on the AB leg continuing the downward momentum. Confluence @.786 retracement and RSI on overbought favoring a short entry.

GARTLEY PATTERN FINISHING ON 1H AUDUSDA Gartley pattern is finishing on th 1H chart of AUDUSD. First targets @ .382 retrecement of CD leg, secondary target @ .618. SL just above X. Previous patterns have completed in this pair as indicated by the shapes in green.

GBPUSD Double top on the Daily Double Top forming on the Daily, This ties in with my view that their is a possible Cypher formation happening

EURUSD - Potential Trend Continuation Opportunity 15 MI have my eyes on a potential 3 drives pattern on EURUSD 15 M, that is aligned with 0.786% Fibo of the last bearish move. If we add 1.618 Fibo Extension of the 2nd wave, look left you will see a small structure zone. If we combine all then we will get a nice kill zone.
In this kill zone I'll be looking for a short entry - the more conservative you can wait for Double Top or perhaps 2168, the more aggressive of you can enter once price is in the kill zone - you will get more than 1:1.5 R/R.
If you're patient you will get a nice Trend Continuation Opportunity.
Good Luck.

CYPHER PATTERN FINISHING ON 4H GBPUSDA Cypher pattern on GBPUSD completing the CD leg with RSI favoring a short position on oversold. First target @ .382 retracement of CD leg. The .786 retracement of the XA leg converging with previous structure.

GBPUSD 60 Min Cypher Complete2 targets the 318 and 618, some of the points are just shy of the exact points but within my own set of rules

AUDCAD short trend continuation trade on advanced fib formationIt´s been a slow week, market´s are still heavily trending, we had a trade on the NZDUSD yesterday a cypher at the resistance. Here today we got a trend continuation trade on this bearish trend with an advanced Cypher formation at the structure resistance. RSI is about to get over bought. Our PRZ level are 0,94670, stops above X structure resistance + the 0,94900 even handle number.. Possible looking for extented targets on this one. But the safe T1 is at 0,94370
Kind Regards
Thomas Jeff

GBPUSD 4hr Double BottomGood RR here
a straight forward Double bottom set up, looking at 2 possible areas for a bit of ressitance around teh 382 and 618 areas

AUDCAD Potential long on triple bottom and advanced formationHere on the AUDCAD we´ve been on a downtrend for a while, we´ve come to a structure support area were we have made a double top so far that have hold up the price. Right now we have formed a Bat formation at structure looking to make a potential triple top then push price up to our target, before price will eventually continue the trend. our PRZ levet are 0,94741
Kind Regards
Thomas Jeff

USDCAD 1hr Double BottomDouble bottom forming .....lookign at highlighted area for a 618 retracement and trend continuation

EURJPY 4 Hr Double bottom / possible 2618 setup We have had our Double Bottom and broken structure with our Impluse leg.
We are in teh oversold area of the RSI as highlighted.
Now im watching 2 areas for this outside return the .382 has shown previous support so could see a bounce from this level like we have very recently or we could come back down to the 618 area
will be watchign with interest for an entry

TCT Using An Advanced Pattern as an entry TechniqueI Spotted this High probability setup today and Just wanted to share with you guys.
its a bullish trend continuation trade using an advanced patten (Bullish Gartely) as our reason for entry.
Here are the list of elements i used to build a case for entry:
1. A break of major structure to the upside and then a retracement back towards it
2.ABCD harmonic move completing at or potential reversal zone
3. Fibonacci Cluster at our potential reversal zone
4. Potential Advanced pattern formation.
5. 55 Day EMA confluence on the daily time frame.
Please this is not trading advice, i'm just sharing my thoughts so make sure you know what you are doing and don't follow me blindly. Thank You.
Comments and constructive criticisms are most welcome.

EURUSD 4hr Double TopPossible double top formed / forming on around previous levels of ressistance
Couple of areas I will be watching

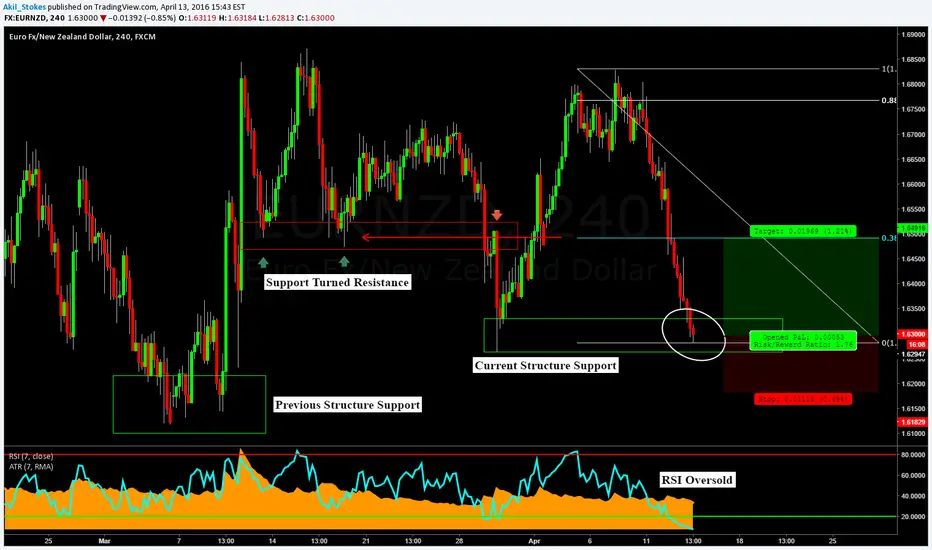
EURNZD: Potential Bullish Opportunity at Structure SupportAs mentioned in a previous post, I try to make a habit of looking at pairs outside of my trading portfolio in order to stay sharp and work on my technical analysis skills.
Today I found a nice potential opportunity on the EURNZD. Syndicate members I'll be talking about this setup in a little more detail in the video I'm about to produce for you, but essentially what I would be waiting for is a buying signal once we've been given confirmation that this level of support has importance.
I'm not sure if I'm going to do this or not, but keep an eye out for me on social media as I'm thinking about broadcasting the first 30 minutes of tomorrow's Live Trading Room session on Youtube. If that is the case I'll get the word out tomorrow morning for you.
Akil Stokes
Chief Currency Analyst & Head Trading Coach
www.TradeEmpowered.com -The Premier Online Trading Education Company
YouTube goo.gl
Facebook: goo.gl
Twitter: goo.gl
@AkilStokesRTM (Instagram, Periscope, Snap Chat & StockTwits)
GBPUSD Trend continuation into bullish GartleyA 2 part technical trading idea that starts with a Trend continuation trade where price action retraces to a recent structural level with 0.618 fib confluence (not shown) and bearish divergence on the RSI. Target 2 is a bit higher than I would normally take because I did not want to be short after completion of a bullish harmonic pattern.
Next, a bullish Gartley pattern completes with the 0.886 right on top of a previous support level. Target 1 is always the .382 retracement of AD. For target 2 I really wanted t o go for the next structural level since it appears to be a stronger resistance level with 0.786 confluence and, depending on how long it took to get there, also coming in at the descending trend line. I had to remind myself to follow my (admittedly unwritten) rules to take target 2 at the 0.618 unless the pattern is part of a retracement in an established trend resulting in buying the trend continuation. Trade your plan.
