AUDUSD Long on 4H Structure ShiftLooking at Dollar weakness and all time frame bias we can see the 1H could create the Inverted Head & Shoulder, 4H is still down, Daily have not violated and is Closed above the HL zone & previous last weekly candle have created the equal lows and now this weeks close is a sign of Liquidity Grab for an upside run.
Just waiting for an Impulsive Upside break of 4H shift to confirm the Buys
Structuretrading

XAUUSD 4H Double Bottom NecklineInteresting to see if Gold make a 4H Structure Shift with the break and retest if the Daily Double Bottom Neckline

AUDUSD 4H Daily Structure Shift for SellsWaiting to see a clear break of the Daily HL structure Shift for further sells on Monday. Lets wait and watch if we confirm the break.


EURJPY 4H ShortEURJPY View. After accumulation of prices and an impulsive break of it now needed a 1H corrective move to 128.940 area to get the Daily imbalance filled and 2nd push can be confirmed with a nice PA.


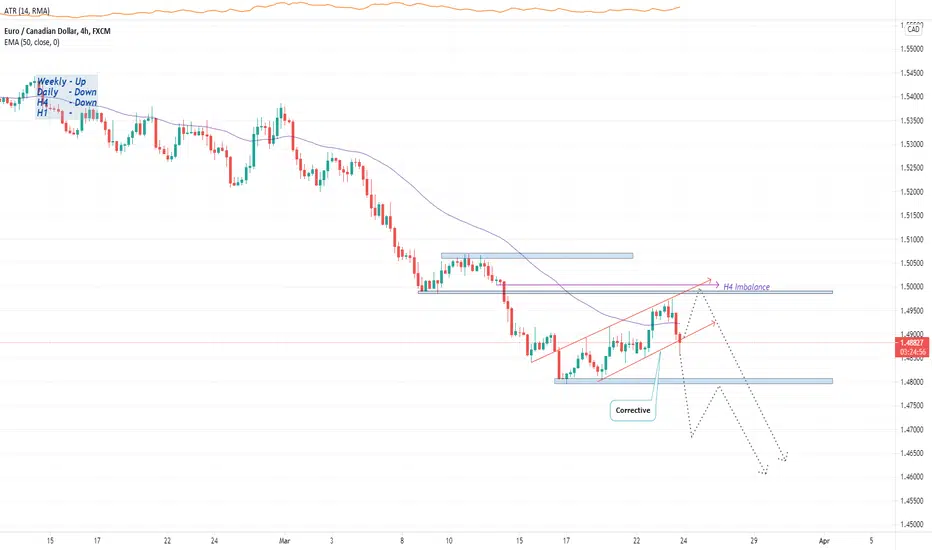
EURCAD 4H Counter - Double BottomEURCAD View. Daily and 4H TF showing Double Bottom Divergence signs which can be a Counter Trend Trade. Area 1.48000 is on the watch on Monday

NZDJPY Short 4HNZDJPY View. Seeing Double Top on the daily Time Frame and comparing it with 4H, the Daily Structure Point is now the Neckline of the Double Top for 4H and is also aligned with 61.80 Fib level.

USDCAD 4H ShortUSDCAD View. Waiting for the Shift of 4H structure to confirm sells as the prices are pushed above 50EMA. Therefore a break of 4H structure will bring the price below 50EMA and a better confirmation for sells

USDJPY 4H Long OpportunityUSDJPY View. 2 Areas to watch for. Corrective move to the Support for a retest and Daily Imbalance Zone where daily 61.80 Fib level aligns too.


AUDCAD 4H ShortLook for the possible Price Action form 61.8 Fib or 4H Imbalance to be filled after the correction


Dollar Index AnalysisLooking at the Dollar Index we can see a Double bottom and an Ascending Triangle formation on the neckline to break the barrier for the dollar to strengthen. Ascending Triangle is a continuation Price Action pattern
So we can see the Dollar strengthening against all the Major FX pair. Watch out for that move.

AUDUSD Long on 1H or 4H Structure ShiftAn inverse Head & Shoulder have been formed and a possible long entries await on Neckline Retest

GBPAUD Short OpportinityThe 4H Imbalance have reacted and now just waiting for the Daily structure shift to confirm the sells on the retest pullback strategy


AUDUSD Long on 1H & 4H Structure ShiftFor scalpers a 1H sniper entry will be an easy catch to jump in the move earlier. 1H structure break-retest and enter


NZDUSD H4 ViewSymmetrical Triangle Formation. Either Side break out can give a direction to the pair move
