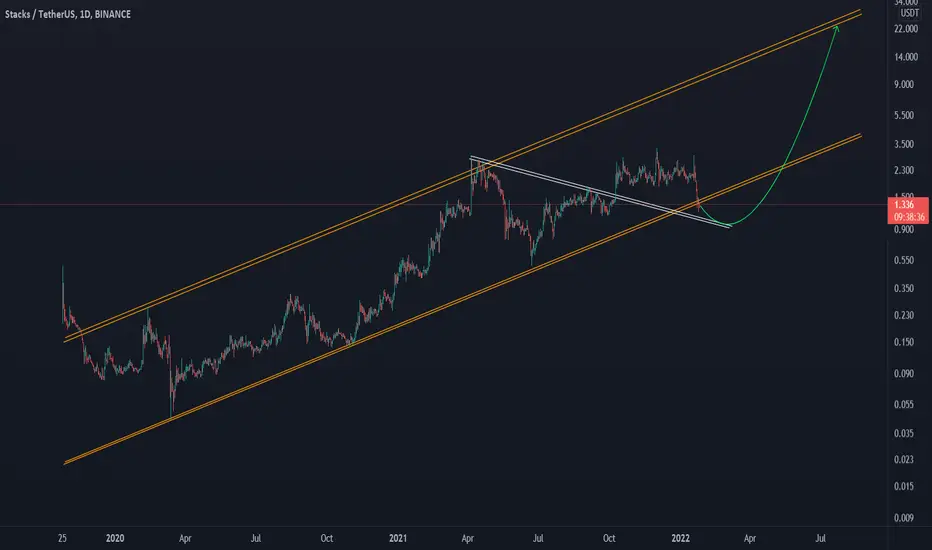
STXAt the bottom of the uptrend channel, the downtrend line has broken and is pulling back to it.
It can grow to the top of the canal after completing the pullback.
STX
Bag🎒 your STACKS once again! Stacks broke up this triangle 📐 and I think there is chance for run to 3.55 and even higher. Setting BUY LIMIT order to catch the pullback. STX just pamp eet! ⛽
ENTRY : local high @ 2.19
STOPLOSS (SL) : local low @ 1.94
TARGETS (TP) : TP1 - resistance @ 2.70 | TP2 - resistance @ 3.09 | TP3 - height of the triangle projected from midpoint of the local range (BUY LIMIT - SL) @ 3.55
REWARD RISK RATIO (RRR) : TARGET1 - 2.0 | TARGET2 - 3.6 | TARGET3 - 5.5
INVALIDATION : when SL level hit
My previous STX ideas 👇
Check my other stuff in related ideas.
Please like👍, comment🗣️, follow me✒️, enjoy📺!
⚠️Disclaimer: I'm not financial advisor. This is not a financial advice. Do your own due dilingence.

STXUSD Last dump before a multi-month rally.Stacks has been trading within a long-term Channel Up since the start of 2020 and is about to form a 1D MA50/ MA100 Bearish Cross. This is similar to the Bearish Cross of October 10 2020, which was the cross that paved the way for a 3 month rally. The 1D LMACD sequence between the two fractals is also identical. We should be expecting a bullish break-out by the first week of February.
--------------------------------------------------------------------------------------------------------
** Please support this idea with your likes and comments, it is the best way to keep it relevant and support me. **
--------------------------------------------------------------------------------------------------------

Stacks (STX) Hits New High Compared To April 2021 - Great News We are technical analysts and we love the charts.
We love the candles and the amazing tool that this is.
Since you can get everything from the charts, hardly ever we take the fundamentals into account.
Here is one exception though, we love Stacks as a project and we have been trading this pair for long.
STXBTC (Stacks) hits a new high today compared to April 2021.
Like most Altcoins vs Bitcoin pairs;
The bullish action started after the low set late 2020 early 2021, prices started to grow.
A peak was hit in April (others peaked in March/May) and then we had a correction that ended in a higher low.
Higher lows lead to higher highs...
And now we grow.
After almost 8 longs months, we have a new high which is extremely bullish for this pair and the rest of the Altcoins market as a whole.
Remember, they are all connected.
What one pair those, the rest is sure to follow.
We are set for at least 1 more year of higher highs and higher lows.
Thanks for reading.
Always hit LIKE to support my work and for more.
Namaste.

BTC plus DEFI - Smart Contracts - Next catalyst? STX Starting to become more confident that 40K will be the floor here with upside to 54K in the next 2-3 months.
Fundamentals- I believe defi on BTC will be the next catalyst.. Very small right now, STX is leading the way. A great article i came across today
www.hiro.so
Chart wise risk to reward seems to favor the bulls at this point.. upside to 54K vs 40K downside.. If btc breaks though 46K things become a lot more bullish.

STX buy signal a huge momentum breaks channel with force. we 75% of probability we will see a bullish trend after pull back

12/19/21 STXSeagate Technology Holdings PLC ( NASDAQ:STX )
Sector: Electronic Technology (Computer Peripherals)
Market Capitalization: 23.268B
Current Price: $104.51
Breakout price: $106.80
Buy Zone (Top/Bottom Range): $104.60-$100.00
Price Target: $123.00-$125.00
Estimated Duration to Target: 80-88d
Contract of Interest: $STX 3/18/22 105c
Trade price as of publish date: $8.15/contract

STX long$STX is showith strong bullish momentum. Correction after an explosive clear move stopped around Fibonacci 0.5 level which is also the support level from previous high. Bullish movement to fibonacci 1.2 Level is expected to happen.


$STX /USD, ATH and instant 20% $STX /USD
ATH and fast 20% on a new 2D Buy signal by UCTS
(I will take it😄)
Let see if it can hodl/flip this area and look for continuation after such breakout
#STX

stx/usdt analysishello my friends
this my idea about stx all things are clear on the chart
thank you

STXUSDT Hello Crypto Lovers,
Mars Signals team wishes you high profits.
We are in a daily time frame.
As you can see, the price has hit the support line for the third time and is currently fluctuating above that and can start moving up again.
You can enter the trade after the price breaks the resistance line and stabilizes above it to achieve the above targets.
But if the support line is broken and the price stabilizes below it, we can see more fall.
Warning: This is just a suggestion and we do not guarantee profits. We advise you analyze the chart before opening any position.
Wish you luck

Bullish momentum takes STX up to $2.20, gaining 7% moreStacks price analysis is bullish today.
Resistance is found at $2.29.
Strong support is present at $2.04.
The Stacks price analysis shows bullish momentum is taking the price higher every day. The recent bullish wave had brought brighter prospects for STX/USD as the crypto pair had gained significant value since 19th November, when the bulls took over the price function and started to elevate the price level by taking the bar higher every time.
Yet, there has been no considerable bearish hindrance seen as the bulls continue to rally high on a daily basis, however corrections have been observed on an hourly basis, but they have not impacted the daily uptrend. The next resistance for STX/USD is present at the $2.29 level. On the contrary, support for the coin is present at the $2.04 level, just above the psychological mark of $2.

STX/USDTesting/tracking elliot wave theory. Please do not trade off idea without S/L. Not financial advice.

Open LONG position STX target $4-6-8Know Sure Thing - KTS
Know Sure Thing , or KST , is a momentum oscillator developed by Martin Pring to make rate-of-change readings easier for traders to interpret. In a 1992 Stocks and Commodities article, Mr. Pring referred to the indicator as "Summed Rate of Change ( KST )," but the KST term stuck with technical analysts. The indicator is relatively common among technical analysts preferring momentum oscillators to make decisions.
KST : Above point 0 means long position (positive zone), below point 0 (negative zone) means short position.
I liked this indicator more than RSI because we can evaluate the breaking points of the channels we draw on the indicator according to the regions.
Plus area (positive area), breaking the channel upwards may indicate a very strong rise, and minus area (negative area) the channel downwards may indicate a very strong fall.

🆓Stacks (STX) Nov-10 #STX $STXThe buying power is continuing to push on STX at the $2.2 zone and it can increase strongly to the $2.6 and $3.6 zones in the near future. But if it loses the $2.2 zone, it will fall back to the $1.9 or even $1.6 zone
📈RED PLAN
♻️Condition : If 1-Day closes ABOVE 2.2$ zone
🔴Buy : 2.2
🔴Sell : 2.6 - 3.6
📉BLUE PLAN
♻️Condition : If 1-Day closes BELOW 2.2$ zone
🔵Sell : 2.2
🔵Buy : 1.9 - 1.6
❓Details
🚫Stoploss for Long : 10%
🚫Stoploss for Short : 5%
📈Red Arrow : Main Direction as RED PLAN
📉Blue Arrow : Back-Up Direction as BLUE PLAN
🟩Green zone : Support zone as BUY section
🟥Red zone : Resistance zone as SELL section

Stx cup formationstx 2. Technical analysis.
please give reputation points 👍.
bowl handle or cup formation compatible with #fib support resistances
remember everything depends on people's decisions
Telgram

STX - Future Projection SeriesIf you've read any "Future Projection" posts you can skip down to the conclusion as I say the same thing till then.
During the downturns in the market I spent time learning more about utilizing the charting functions in TradingView. I also watch a lot of youtube vids about crypto and charting concepts. I came across a good chunk of info on using the “log” function and what it could possible show me.
At this point in the crypto cycle, even though I feel we are nearing a parabolic stage, it is beyond the point to expect 50X or more from me or any basic Joe who “dabbles” in crypto investing. Think long term. What can I realistically (if that even exists in Crypto) expect a coin to perform in the next bull run. Well the log function gives me a level playing field to do just that.
Using the log function, I utilize a common start date as the beginning of my parallel channel. That date is the big drop Mar/20. The parallel channel runs from the bottom of the Mar/20 drop forward in time along the bottom dips. The top of the channel is the highpoint in the cycle.
The first future projection is created using the green trend lines, the first from the top of the cycle peak to the bottom, and another from that lowest point up forward in time to what I estimate as the timeframe for top cycle which approximates end of Q4, and my birthday Jan/7 so thats the future date for all graphs in this series.
The second future projection takes ratio’d growth into consideration. This is done using the blue trend line which starts at the first peak after the Mar/20 drop, using the top of arcs as the guidance. I carry this line forward to Jan/7.
Conclusion; At the time I drew this one the price was $1.81
First Projection $12.05
12.05 / 1.81 = 6.6 X
Second Projection $30.25
30.25 / 1.81 = 16.7 X
Now for a regular old fellow such as myself, a 6 to 16 X on my money within the next few months is a good investment. It literally involves 2 trades. Timing is not a great big deal as long as you get in near .55 otherwise the X factors changes a lot. Timing to get out is the top of the curve. This is a day time factor. It’ll be “at the top” for days or a week. You’re not chasing a pump or a knife here, its a month(s) trade. Or a parabolic week so watch close.
I’ve done this for a lot of coins now and the results are sometimes very interesting in that, a popular coin just doesn’t have the numbers or that it really has good numbers. I found as an average I like results in the 5 or above range for the first projection and 15 or above for the second projection. If I utilize this investment concept and choose coins with similar numbers I can reasonably expect a 10-15 X overall. I’ll post a few others I find interesting for this bull run in the coming posts.
My thoughts, not advice Oklah. Cheers

STXUSDTHello Crypto Lovers,
Mars Signals team wishes you high profits.
We are in a 4-hour time frame.
As you can see, the price goes up after hitting the support line and the price can form a twin floor and we can see a Gartley pattern.
If it can be stabilized above the resistance line, it can advance to our target, and we may have a correction after hitting the resistance line. We have to wait and see how the trend reacts with this resistance.
Warning: This is just a suggestion and we do not guarantee profits. We advise you analyze the chart before opening any position.
Wish you luck

Bag your STACKS again!Stacks recently pumped as predicted in the idea below:
After hitting my target it's consolidating in another triangle and now it seems to be ready to break up also this new triangle 📐. If successful I think there is chance for run to 2.94 and even higher. STX , just do it again! ✔️
ENTRY : local high @ 2.24
SL : local low @ 2.04
TARGET : height of the triangle projected from midpoint of the local range (BUY STOP-LIMIT - SL) @ 2.94
RRR : 3.4
INVALIDATION : when SL level hit
Check my other stuff in related ideas.
Please like👍, comment🗣️, follow me✒️, enjoy📺!
⚠️Disclaimer: I'm not financial advisor. This is not a financial advice. Do your own due dilingence.


Bag your STACKS!Stacks broke up this triangle 📐 and I think there is chance for run to 2 and even higher. Setting BUY LIMIT order to catch the pullback and add to my stack. Check the other triangle breakouts in related ideas STX just do it! ✔️
ENTRY : local high @ 1.377
SL : local low @ 1.277
TARGET : height of the triangle projected from midpoint of the local range (BUY LIMIT - SL) @ 1.99
RRR : 6.1
INVALIDATION : when SL level hit
Please like👍, comment🗣️, follow me✒️, enjoy📺!
⚠️Disclaimer: I'm not financial advisor. This is not a financial advice. Do your own due dilingence.

