STX Possible Next Market MovementsMarket form a falling wedge pattern
Broke above the trend line
Possible continuation to the upside
Watch out for fake outs
This is not a financial advice
I am not a financial Advisor
Do your own Research
Trade at your own risk
I am not responsible for any loses
STX


Too much weaknessHigh volume operations did not lead to new advance. It is likely fixing profits from longs when price jumped above 1.0 round level. The most likely is slow down drifting in this case.

STX USDT LONGBULLISH DIVERGENCE WITH STOCH-CCI-RSI-MACDI IN DAILY TF
KUMO SUPPORTING PRICE
NOTICE FOR RISK/REWARD RATIO ...

STXBTC - Long-Term Wedge Squeezing - Looking to Break Out Soon!Not advice - I'm a noob practicing TA.
Here we can see a long-term wedge starting to squeeze looking at the weekly chart.
Zooming in on the Daily - we can see the recent price action is trading in a nice channel - looks like this project will break-out to the upside.
SEC approved ICO for this project bodes well for the future - considering there may be stricter regulations coming in.
Testing the 200 MA and the down-trend line again - its only a matter of time before it breaks through. Could break to the downside - but everything looks bullish right now.
Targets:
Short-term - look at previous support/resistances for sell levels
Long term - look at fib levels for high-upside price targets.

STX usdt to push down to lower timeframe support levels.STX usdt to push down to lower timeframe support levels

STX potential target with Sperandeo at 1H chartHere is a Sperandeo target you can see at the top; the yellow line.
Sperandeo Analysis works very effectively these days. Let's wait and see if the target comes.


STXBTC forming Shark | Up to 59% profit expected aheadHi, friends hope you are well and welcome to the new update on Blockstack (STX) coin.
On the daily chart, the price action of the STX coin has completed a Gartley then a Shark and again it is completing the last leg of another bullish Shark pattern and soon it will be entered in potential reversal zone.
Buying and sell ranges:
The buying zone starts from 0.886 to 1.13 Fibonacci levels, and the sell zone can be the Fibonacci projection between 0.382 to 0.786 .
Stop loss:
The maximum extent of the potential reversal zone at 1.13 Fib level can be used as stop loss.
Possible profit and loss ratio:
As per the above targets, this trade has a profit possibility of 59%, and the loss possibility is 13.5%.
Note: Above idea is for educational purpose only. It is advised to diversify and strictly follow the stop loss, and don't get stuck with trade.

Blockstack (STX) Now Above MA200, Impulse Possible!Now that STXBTC (Blockstack) is trading above MA200, the black line on the chart, the doors are open for fast/strong growth.
This is a very important level and we have little resistance after this one.
Notice that also EMA300 (grey) and EMA200 (brown) has also been left behind.
The RSI is at 63 which is really strong and the MACD curving up and ready to blow.
We looking at a higher high since we already got a higher low... Additional details on the chart.
Namaste.

STX LongGood place to enter long here looking out for the $66 level for first zone. Volume is also an indicator here

STX Insider Selling of $86 Million Coupled with Potential H&S Insider selling of $86 Million final three days of December.
I anticipate an attempt at regaining $63 on Monday by this one and this is where I plan to initiate a short position by using February or March Puts.
Disclaimer: Not trading advice.
STX


Blockstack (STX) Rebound After Higher Low!STXBTC (Blockstack) is looking good with a strong rebound taking place after a higher low.
The RSI is above 50 which is really good with this current chart.
All that is needed is for the price to either continue growing and close today above the EMA50 line.
This would confirm this bounce as "real" and signal that additional growth is soon to follow.
Remember that you need a plan before you decide to trade.
Thanks a lot for reading.
This is Alan Masters.
Namaste.

STX could see tremendous gains in near future!Blockstack (STX) is starting to look hella bullish for the first time in it's history !
We can see that its price is always rejected in the 30/33cents area.
Right now it's consolidating near this HUGE resistance with low volatility printing smaller and smaller handles.
If the resistance is broken STX could be set for BIG gains in the near future!
Ideally we will like to see a continuation of low volatility for a couple of days and a clear breakout with STRONG volume !
Trade the breakout on the upside and trade safe !

STXUSDT completing Cypher | 29.9% expectedOn small time period one hour chart, the price action of Blockstack (STX) is completing the final leg of Cypher pattern , and soon it will be entered in potential reversal zone. There is also 200 simple moving average support in PRZ level.
Buying And Sell Targets:
The buying and sell targets according to BAT pattern should be:
Potential reversal or buying zone: $0.2704 to $0.2501
Fibonacci projection or sell zone: $0.2863 to $0.3249
Stop Loss:
The potential reversal zone area that is up to $0.2501 can be used as stop loss in case of complete candlestick closes below this level.
Possible profit and loss ratio:
As per above targets this trade has a profit possibility of 29.90% and as per the above-mentioned stop loss, the loss possibility is 8%.
Note: Above idea is for educational purpose only. It is advised to diversify and strictly follow the stop loss, and don't get stuck with trade.

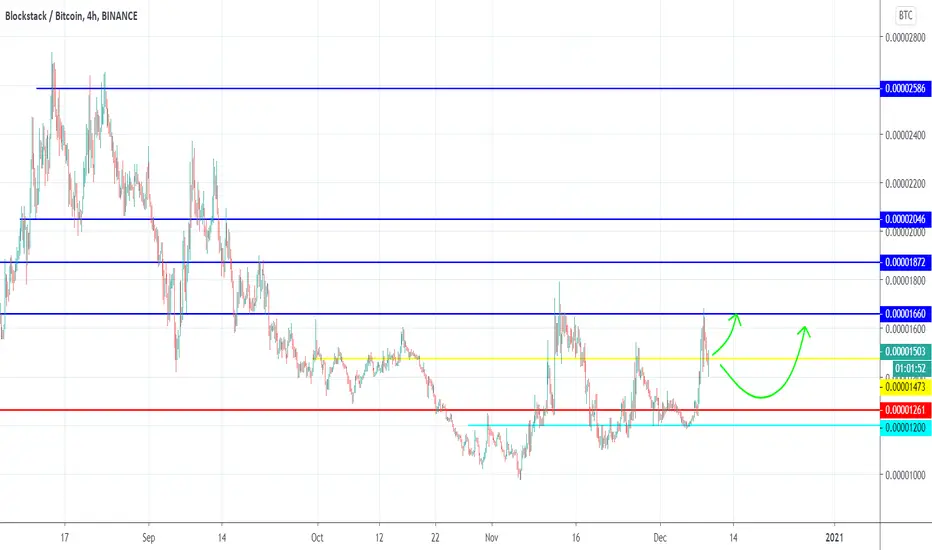
STXBTCSTXBTC
Buying around 0.00001473 - 0.00001261
1 - 0.00001660
2 - 0.00001872
3 - 0.00002046
4 - 0.00002586
Stop, fixing below 0.000012
✅ f you like what I do, put 👍 and subscribe
Waiting for your comment, what do you think about this?
STXUSDT LONG TRADESTXUSDT LONG TRADE
Signal: Blue -> Green
Context: Light Green
Trade close manually when: the above ribbons turns Yellow or better Red.
I appreciate your like or comment. Welcome to share your idea here.
DISCLAIMER
This is only a personal opinion and does NOT serve as investing NOR trading advice.
Please make your own decisions and be responsible for your own investing and trading Activities.

STX ( BlockStack ) Breakout | Fibs Retracement Setupready for price to break 1300 satoshi and enter into this coin we can see a really good move with volume when it breakout
0.786 Fibonacci bounce
support zone
1300 satoshi 200 ema breakout

Blockstack Breaking Above EMA50 (111% Mapped)STXBTC (Blockstack) moved up recently and challenged MA200, the black line on the chart.
A rejection happened at this level which ended in a higher low... We are now seeing its price recover, there can be additional growth.
STXBTC Chart Signals
Here we have prices moving above EMA10, EMA21, and EMA50.
The RSI is strong at 52.
The MACD is above zero (bullish).
The chart looks pretty healthy...
There can be additional growth.
Additional information, including targets and support levels, can be found on the chart.
Thanks a lot for reading.
Namaste.

Blockstack (STX) Bullish Momentum Increases (4H + D TF)We are looking at Blockstack (STXBTC) and things are starting to heat up... Let's start with the 4H chart.
In this timeframe, we have prices now trading above EMA300 and MA200, as well as strong bullish indicators.
The volume is going fully towards the bulls.
---
Now, looking at the daily chart, which is the main chart above, we can see prices challenging/moving above EMA200/EMA300 and MA200, all three very strong levels.
We can also see really strong volume.
Closing above this level would basically guarantee a very strong jump, based on TA.
Here we also have very strong indicators with RSI above 63 and the MACD entering the bullish zone.
The next target is marked on the chart with a dashed magenta line.
Namaste.

Blockstack (STX) Trade Signal (183%)Here are the numbers for Blockstack (STXBTC).
Use them to your advantage.
I am wishing you an amazing November and beyond.
Let's get started!
-------------
STXBTC
BUY: 0.00001000 - 0.00001250
TARGET:
1) 0.00001640
2) 0.00002000
3) 0.00002300
4) 0.00002700
5) 0.00003100
6) 0.00003400
STOP: Close weekly below 0.00000900.
-------------
Basic Tips
- Always take your time before trading.
- Diversify (exchanges, coins, sources of income, everything).
- When it doubt, don't trade!
- Make a habit of securing profits by selling on target and also withdrawing a portion of your earnings.
- Give it time (Patience is absolutely key).
Namaste.
----
All the information shared here is for learning and/or entertainment purposes only.
This is not financial advice.

STX/BTC (Bearish Flag Confirmed)💎Technical Analysis Summary💎
BINANCE: STXBTC
-STX confirms the bear flag a few days ago
-The rising channel broke to the downside
-If the bears can control this downward pressure
-The potential target is somewhere 1000s sat level
-That is strong support where we saw bullish price reaction
A big Thanks for donating 💰 via Tradingview coins this week to CITIZENCAINE 🙏🎉
``````````````````````````````````````````````
Trading Involves High Risk ⚠️
Not Financial Advice 💸
Please Exercise Risk Management 💱
``````````````````````````````````````````````
Thank You All!🙏😊💖For Supporting My Channel 📺
Through Leaving A Thumbs Up, Comment & Follow 💬
Happy Trading!😊💕💖
``````````````````````````````````````````````
