STX

STXBTC formed bullish reversal moves on supportMainnet launch:
The Blockstack has a significant event of mainnet launch expected on 30 Sep or earlier. This event is also mentioned on STX coin’s roadmap.
The Channel:
The priceline of STX was moving in a parallel channel and finally broke out the resistance of the channel. Now the previous resistance is working as support and the priceline is re-testing this support again. It can be a double bottom formation above this support.
Continuously harmonic moves:
While the price action of Blockstack is at the resistance of channel that is working as support it has also formed continuously second harmonic bullish BAT pattern and entered in potential reversal zone.
Strong resistance and SMA supports:
The priceline has found very strong resistance at 0.00002519 btc that is not broken out since Nov 2019. After being rejected by this resistance level the priceline is at 100 and 200 SMA supports.
Conclusion:
The price action of Blockstack has several support levels like: the previous resistance of channel, 100 and 200 SMAs and the potential reversal zone of BAT pattern. Therefore there are strong chances that the priceline may start another rally to the upside from here. How ever we should use the maximum extent of PRZ of BAT pattern as stop loss.

STXBTC formed bullish another BAT Upto 43% move expectedThe priceline of STXBTC is forming continuously 2nd BAT pattern. The targets are as below:
Buy between: 0.00001625 to 0.00001530 btc (this should be stop loss as well)
Sell between: 0.00001850 to 0.00002196 btc
Regards,
Atif Akbar (moon333)


STX - Possible Double bottomMainnet and other big news will arrive in September. Not really pumped yet. Big potential.

STXUSDT AnalysisPeople who bought STX from the BULL signal in July, enjoy your 68.22% PROFIT that you made less than 2 months!
There's also green cloud present as a buy signal.
if you are holding STX, do not hurry to sell since there are no sell signals present. If you want, you can take profit at the resistance level (0.37) or wait for EngineeringRobo's sell signals to sell.
Also, if you haven't bought STX, since there are 2 buy signals present & the risk-reward ratio is higher than 1, you can buy right now. If you buy, please watch out for EngineeringRobo's sell signals.

STXUSDT ANALYSISI have 4 positive signals.
If you hold this coin sell at the resistance line( $ 0,3758) and watch EngineeringRobo' s sell signal
It is ok to buy it but watch carefully EngineeringRobo' s sell signal.
Have a good trade If you want to use EngineeringRobo please dm me.

Blockstack Will Be Coin Of Sep 2020 | STX broke out the channelHey, friends hope you are well and welcome to the new update on Blockstack coin. In my previous article we have discussed that the STX coin was moving in a parallel channel and we also had received different bullish signals giving clear indications that the price action may breakout the resistance of the channel very soon. The moon phases indicator was showing the full moon was appeared at high altitude and the directional movement indicator also gave bullish signals as +DI crossed up –DI and the volume profile indicator was showing very low interest of the traders at the support of this channel.
Comparison between the movement of Tfuel and STX:
In my previous article we have already seen that the Tfuel also gave similar bullish signals before making the big bullish move of more than 1200%. The priceline of Theta fuel was moving in an up channel and before making the big move the price action did not hit the support of the channel and the volume profile was also showing less interest of the traders at the support of the channel. Finally the priceline broke out the resistance with a powerful bullish divergence. Same as like above the price action of Bockstack also stopped hitting the support of the channel and finally broke out the resistance with a powerful bullish divergence.
Why the priceline did not retest the resistance of parallel channel? :
After breaking out the channel there was a strong possibility that the price action of STX will move down to re-test the resistance of the channel as support before the next rally. But if we watch on the chart then the price action retraced back but without retesting the resistance of the channel the price action moved up. But if we take more closer look at the chart. Then it can be clearly observed that after mid of May 2020 the price action of STX started its movement within an up channel. Therefore the price action re-tested the resistance of this recent up channel rather to re-test the resistance of parallel channel. In the meanwhile the price action has also broken out all the simple moving averages with the time period of 25, 50, 100 and 200 and now having very strong support of all the moving averages.
The formation of new channel:
Now I would like to show you the new move of the priceline of STX coin. After breaking out from the parallel and up channels now the price action of Blockstack has formed and other up channel. If we have few more touches at the resistance and the support of this new channel then the price action will confirm its movement within this pattern on the long term. But if the price action will form higher lows then the pattern will be changed to rising wedge rather than up channel.
Conclusion:
After breaking out the resistance the price action is showing very positive gesture move up. But if the priceline of STX coin will confirm the rising wedge pattern then it can be little bit critical because this pattern is considered as a bearish reversal pattern among the traders community. Therefore keeping eye on the further move of the price action is very important.


Strike Energy: STX.AXWatchlist
Price in a rectangle pattern
See if price can break the top and move up
22c looks to be the key level
Trading above 21EMA


STX/BTC UpTrend Channel For Next TargetAfter Bitcoin Gonna Consolidate, We Will See the Price Continue channel to achieve Higher Targets, All Targets Are on Chart, Set Your Stop Loss Below The Trend Line.
Only Open Trade After Red Zone Breaks ...
Potential 10 % - 20 % Gain .
Always Do Your Analysis for Best Result.

STX x-BULL
30 September 2020 (or earlier)
Mainnet Launch
22 August 2020
Future Proof Conference
28 July 2020
Responsible Data Summit
06 August 2020
Binance AMA Series
06 August 2020
Rebrand Crash Course
31 July 2020
July Community Townhall
30 July 2020
CryptoZoom Arabia AMA

Blockstack is likely to breakout the channel soon for big moveHi, friends hope you are well and welcome to the new update on Blockstack coin. STX has a very big event of mainnet launch on 30 September 2020.
The effect of the announcement on price action:
Since this announcement is added on 12th of May on different sites at that time the priceline was moving at the support of the parallel channel. Then the price action started bullish rally that was more than 85% and at this time the priceline of STX has reached the resistance of the channel.
I have also placed the volume profile on the complete price action moving within this channel. That is showing the trader’s interest is very weak above the support of the channel. That is very clear indication that now the price action will not be able to move up to support and the Moon phases indicator is showing the new full moon is appeared at very high distance above the resistance. That is indicating to upcoming breakout.
The directional movement indicator is showing that positive directional indicator has crossed up the negative directional indicator and giving the bullish signals.
Tfuel also showed same signals before powerful bullish move:
If we watch the Tfuel chart then before the powerful bullish rally we also had received such signals. The volume profile was showing less interest of the traders above the support and for the long time period, before the breakout the price action did not hit the support and finally broke out the resistance of channel and started more than 1200% rally.
The SMAs have formed alligator mouth:
If we watch the simple moving averages on the daily chart with the time period of 25, 50, 100 and 200 then priceline has crossed up all these simple moving averages. Now we have the order of these moving averages in a sequence that the 25 SMA is above all then we have 50 then 100 and then 200 simple moving average is below all the other simple moving averages. Therefore a complete alligator opened mouth has been formed by the simple moving averages that can lift the prices action more up.
Conclusion:
At this time the priceline is at the resistance of the channel, therefore we need more volume in order to breakout from this pattern. If the buying volume will be not increased then we can see some correction rally before the next bullish move.


STXUSDT ANALYSISOnly I said you buy now and watch. Enjoying your benefit more than 100% and about %130.
However, you do not forget to sell it at the resistance line(0.3781) If you want, you will buy it later again.

STXBTC STXBTC
✅ 1 - 0.00001744
✅ 2 - 0.00002000
✅ 3 - 0.00002440
Breakdown of 0.000014, the price may fall below
If you like what I do, put 👍 and subscribe
Waiting for your comment, what do you think about this?

Blockstack [STX / BTC] on July 8 (#STX #STXBTC)STX is in the accumulation zone and ready for a jump. We can consider buying in the 1400sts zone, the target will be the 1750 - 2000 - 2500 or even 3500sts after September.
This analysis will be invalid if the price breaks the 1200sts zone


Triangle and Rectangle Patterns for STXSTX has been rising regularly and forming ascending triangle. There is also good rectangle pattern. It’s on the trend line
Let’s follow carefully
STX/BTCNot an expert!
Double bottom on the daily, trading within a range, if it breaks the diagonal trend line then it's more upside.
If you're not already in, you can wait for a possible triple bottom or S/R flip.

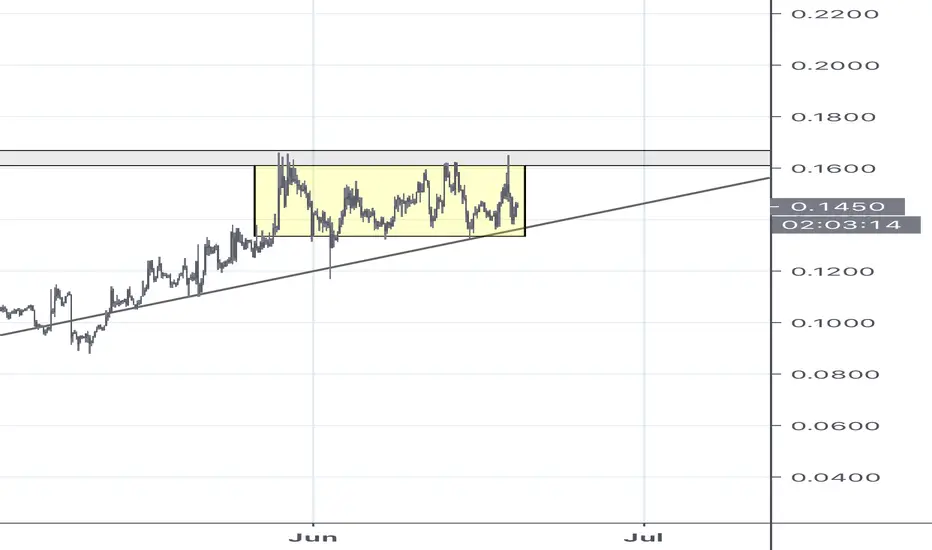
#STX/BTC (May 27)STX is trying to break out and its target should be 2000sts in June. But 1600sts is very strong that may make STX dump a little to the range of 1250-1350sts before pump to 2000sts.
