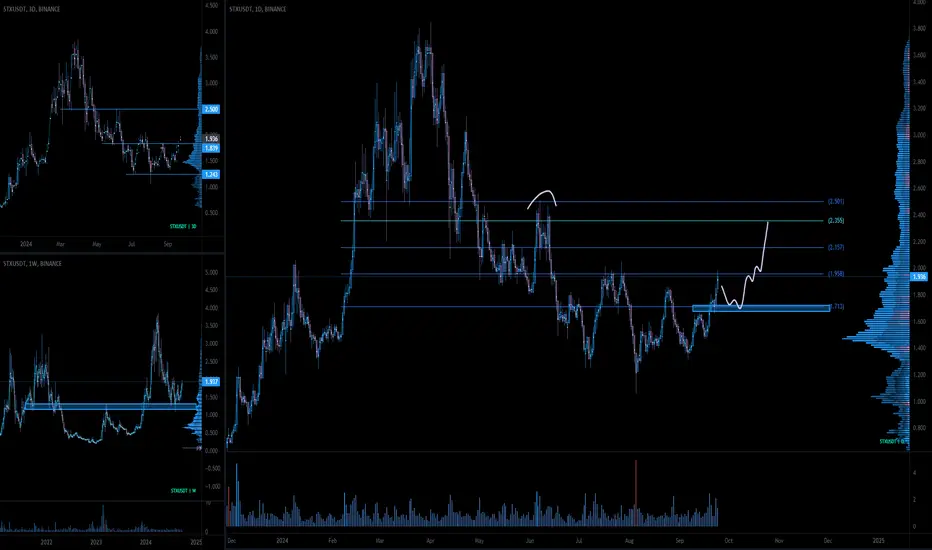
$STX Key levels to watchSTX (Stacks) is breaking out of a 3-month consolidation and is now nearing its horizontal and psychological resistance at $2
A bullish structure is forming, and we have significant upside potential if we can break through the immediate resistance, which has now been tested for the third time.
There's strong support between $1.70 and $1.65. In my view, any dip to this range is a buying opportunity. If this level holds, we could see a move up towards $2.3 to $2.5
STX
STX - USDTThe STX/USDT chart shows the price testing a crucial resistance zone (Blue). A successful breakout above the resistance zone (Blue) could trigger a strong bullish wave. Failure to break this level may lead to further consolidation or downward movement.

STX/USDT100 percent growth within a month or two seems possible. Keeping an eye. Looks boullish over EMA 100.
What do you guys think!??

STXUSDT Triangle BreakoutSTXUSDT technical analysis update
STX is breaking the symmetrical triangle resistance with high volume, and the price is trading above the 100 EMA on the daily chart. This is considered a strong bullish signal for STX.
Buy zone: Below $1.75
Stop loss: $1.55
Regards
Hexa

STX Looks Ready To 5x By End of 2024With this week's FOMC .50 Bp rate cut -- The Bull is Back Baby.
I've been buying BTC and SOL since last week, but now many of the alts are shaping up nicely.
One I like in particular is STX (Stacks) which essentially makes Bitcoin better.
The weekly chart looks very interesting here, coming out of a Buy Limit Order Block, and holding it's longer term trendline, back above it's 21 and 50 day EMA's.
The last local top was a projection from the prior dip and a 3.618 Fibonacci extension.
The same 3.618 projection points toward $10 which I think is a reasonable target by the end of 2024, which would be a 5x from here.
Plus our weekly Trend Strength Indicator is turning Green for first time since Jan 2023.
Many Alts are looking interesting, but I like this project and have been waiting for the ideal time to start building a position, so I'm going to start building here.
Let me know what you think, and your comments below.
Please 'Like' the analsys if you feel it's warranted (Trying to build a presence here on TV!)
Enjoy the next 3 months, Q4 should be interesting!
PS> I think we get a blow off top and a left-translated cycle. 2025 is a huge wildcard.

Stacks – Primed for a Breakout with Strong Bitcoin IntegrationAbout Stacks (STX): Stacks is a unique project that brings smart contracts and decentralized applications (dApps) to Bitcoin without altering Bitcoin’s core. It has a market cap of $2.52 billion and a 24-hour trading volume of $167 million, showing strong market interest.
Impact of Rate Cuts: With the Fed's recent 50 bps rate cut, risk-on assets like STX are expected to thrive as investors seek high-growth opportunities in the crypto space. Stacks, building on the strength of Bitcoin, stands to benefit from this macroeconomic backdrop.
Entry Point: STX is currently trading at $1.69, showing a 12.1% increase in the last 24 hours. Immediate support is at $1.17, and a breakout above $2.76 could set the stage for a strong bullish rally. The primary target is $4.33, while the maximal target in a moonshot scenario reaches $19.
📊 Technical Levels:
Support: $1.17
Primary Target: $4.33
Maximal Extension: $19 (Moonshot Scenario)
The chart is showing STX flirting with a breakout, and the combination of Bitcoin’s stability and smart contract capability could push STX higher.
If you like STX, perhaps it’s time to diversify with AI + Crypto unicorns like CRGPT 🤖🚀.
One Love,
The FXPROFESSOR 💙

Alikze »» BNB | Support zone failure🔍 Technical analysis: Support zone failure
- In the 4H time frame, after not being able to break the supply area, it has faced selling pressure.
- Currently, a bullish pattern is observed, which has extended to the supply area.
- Therefore, any pullback to a broken structure can face selling pressure again.
- So we should see an increase in selling pressure in the supply area to continue the corrective lag until the liquidity area.
- In addition, in case of breaking the liquidity area, the correction can continue up to the specified areas and Fibo 2.618.
Alternative scenario: In addition, if it can break and stabilize the supply area upwards, it can have a retest to the next supply area.
🛑Range of resistance or supply area: 531-547
🟢 Support area: 468-464
»»»«««»»»«««»»»«««
Please support this idea with a LIKE and COMMENT if you find it useful and Click "Follow" on our profile if you'd like these trade ideas delivered straight to your email in the future.
Thanks for your continued support.
Best Regards,❤️
Alikze.
»»»«««»»»«««»»»«««
BINANCE:BNBUSDT

STX USDTSTX is currently in a bearish trend and has been moving within a descending channel for approximately 157 days. The chart clearly shows the price making lower highs and lower lows, respecting the boundaries of this channel.
At the moment, the price is positioned near a critical juncture where it could potentially break out of this descending channel, signaling a reversal. For a bullish move to occur, STX must break above the channel’s upper boundary. This resistance has acted as a barrier to the price, preventing any significant upward movement.

STXUSDT 2DSTX ~ 2D
#STX Best strategy for COINBASE:STXUSD , Buy on breaking out of this descending pattern, or buy in the demand zone.

STXUSDT: Previous Resistance Acting as Strong SupportSTX technical analysis update
STX's price is bouncing from its major support level, with the previous resistance now acting as strong support. Above this support zone, the price has formed a descending channel and is currently trading within it. The price is now moving toward the channel resistance, potentially setting up for a breakout.
Regards
Hexa

STX NEW UPDATEFrom the data we have on the chart, we can identify a larger pattern for STX.
It looks like a larger correction pattern like the diametric is forming. This correction has started from where we placed the red arrow on the chart.
The price has reached a SWAP resistance range.
The F wave can end around here after a while.
G wave can have two targets ahead.
I marked the best place for rebuy on the chart.
Closing a candle above the invalidation level will violate the analysis.
For risk management, please don't forget stop loss and capital management
Comment if you have any questions
Thank You

Alikze »»GRT | Bearish Flag Pattern🔍 Technical analysis: Bearish Flag Pattern
According to the analysis presented in the previous post, after the completion of corrective wave B, an upward wave in the form of wave 3 or C grew to the size of 1.272 fibo of the previous wave itself.
- Therefore, this rising wave can be labeled as wave one.
💎 According to the structure and behavior of the three-wave correction, an ascending log equal to 61.8 fibo of the previous wave has been returned.
💎 In addition, this return wave was in a channel and formed a descending flag. Therefore, the bearish flag pattern can also correct as much as the bar.
- This descending log can return at least 100% of the previous wave, which will be the range of 0.1446.
- If it continues and breaks it, it can extend to the floor of the channel and shopping area.
💎 Resistance zone: limit 0.39 and fibo 61.8 channel ceiling
💎 Alternate scenario: If the 0.618 Fibo area breaks to the upside, the bearish scenario will be invalidated and should be re-examined and updated.
»»»«««»»»«««»»»«««
Please support this idea with a LIKE and COMMENT if you find it useful and Click "Follow" on our profile if you'd like these trade ideas delivered straight to your email in the future.
Thanks for your continued support.
Best Regards,❤️
Alikze.
»»»«««»»»«««»»»«««

Alikze »» FTM | Continue reforming on the descending channel🔍 Technical analysis: Continue reforming on the descending channel
- In the analysis presented in the previous post , after leaving the density to the first blue strip area it made the first correction.
- Currently, it is moving in a downtrend in a downtrend in a downtrend.
- Depending on the type of behavior and structure of this return, it can extend to the middle of the channel or the Test of the Neckline area.
- So we will expect to continue the correction after the middle of the channel to the floor of the canal, which can then continue with the channel breakdown to 0.26.
- This correction is generally for the completion of the 2 -correction wave that can have a complex combination modification.
- So we will continue to consider the upward trend after the short -term correction is completed.
💎 Alternative scenario: After supporting the blue and money -wide range, it can have a test to the supply area, which can continue up to the channel and fibo 1.272 if it fails.
»»»«««»»»«««»»»«««
Please support this idea with a LIKE and COMMENT if you find it useful and Click "Follow" on our profile if you'd like these trade ideas delivered straight to your email in the future.
Thanks for your continued support.
Best Regards,❤️
Alikze.
»»»«««»»»«««»»»«««
BINANCE:FTMUSDT

$stx Stacks over 60% retracement ...NASDAQ:STX Stacks has retraced by over 60% from an all time high of $3.8. Low Risk Buy!
Current Price: $1.60
Stacks current price action is currently in a huge falling wedge!
Up resistances: 1.8, 2.4, 2.9, 3.3, 3.6 then possibly new price discovery at 4.0, 4.4, 4.7, 5.1

Alikze »» AVAX | Head and shoulders pattern🔍 Technical analysis: Head and shoulders pattern
- It is moving in a downward channel in weekly and daily time.
- In the previous post , it was mentioned that if the supply zone fails, it can touch the next zones, which after retesting the zone, failed to break the red box and formed a corrective structure.
- According to the current corrective structure, a head and shoulders pattern is formed.
- Also, due to the failure of the neck line, any return can be a pole back to the broken structure.
- So the break of the $25 area will also lead to the break of the channel and it can have a triple correction with Fibo targets of 100 - then $12.5 and Fibo of 1.618.
💎 Alternate scenario: If the $25 zone is maintained and the supply zone fails, it can retest the next zone.
»»»«««»»»«««»»»«««
Please support this idea with a LIKE and COMMENT if you find it useful and Click "Follow" on our profile if you'd like these trade ideas delivered straight to your email in the future.
Thanks for your continued support.
Best Regards,❤️
Alikze.
»»»«««»»»«««»»»«««
BINANCE:AVAXUSDT

STX Potentially BullishNASDAQ:STX is still attempting to reclaim the bullish momentum and so far, the 1.760 zone (Previous Resistance now turned support) seems to be holding. A further bullish push just might lead the start of another bullish push.
This does not completely rule out the possibility of another dip in the market. As long as the now found support holds, the bulls will take the lead otherwise, the bears will dominate. I will keep an eye on this closely. Expect updates on #STX as market reveals itself more.

STXUSDT 1DSTX ~ 1D
#STX Make purchases gradually in this pattern. it is only a matter of time until this pattern is successfully broken and the bulls will dominate again.

Ethereum naming service, but on Bitcoinlooking at it because ENS has been stronger lately.
also STX has had a significant drawdown since the Ordinals hype.

Alikze »» STRK | Descending channel🔍 Technical analysis: Descending channel
- It is moving in a downward channel in the daily and 12H time frames.
- Currently, there is a demand in the green box and the bottom of the descending channel.
- After the demand in the green box area, it has re-entered the descending channel.
- According to the current structure, it can grow up to the middle of the channel and the range of 0.78 after the pullback.
- If it can stabilize above the 0.78 area, it can continue its growth until the neck line area and the supply area.
💎 In addition, if the green box is broken, the downward trend can continue up to the 0.39 area.
»»»«««»»»«««»»»«««
Please support this idea with a LIKE and COMMENT if you find it useful and Click "Follow" on our profile if you'd like these trade ideas delivered straight to your email in the future.
Thanks for your continued support.
Best Regards,❤️
Alikze.
»»»«««»»»«««»»»«««
BINANCE:STRKUSDT

Alikze »» SUI | Descending channel🔍 Technical analysis: Descending channel
- It is moving in a descending channel on a daily basis.
- Currently, there is demand at the bottom of the descending channel in the green box.
- If it can break the range of 0.78, it can continue its growth with a pullback to the support box until the supply zone.
- But if the green box area breaks down, the correction will be ongoing and should be re-examined and updated.
»»»«««»»»«««»»»«««
Please support this idea with a LIKE and COMMENT if you find it useful and Click "Follow" on our profile if you'd like these trade ideas delivered straight to your email in the future.
Thanks for your continued support.
Best Regards,❤️
Alikze.
»»»«««»»»«««»»»«««
BINANCE:SUIUSDT

STX Technical AnalysisThe STX/USDT pair analyzes daily price activity and provides major support and resistance levels, trend lines, and key zones of interest. This comprehensive review gives useful information for both traders and investors.
Daily Resistance Zone
The chart shows a strong resistance zone in the Purple area at the upper limit. This zone has consistently stopped upward price movements, indicating significant selling pressure and indicating that it is a critical level for bulls to cross.
Key Resistance Levels
Several resistance levels have been found, including $3.078, $1.959, Blue zone at $2.379 - $2.445, and Green zone at $1.833 - $1.726. Historically acted as barrier, keeping the price from rising. The price reactions at these levels indicate how important they are in the overall market structure.
Descending Channel Trend Lines
The chart shows a descending channel with lower highs and lower lows. The upper boundary of this channel acts as dynamic resistance, while the lower limit provides dynamic support. The price movement within this channel represents the existing downturn, and any break from this pattern could indicate a major change in market sentiment.
Crucial Support Zones
Several support zones are marked, each representing a region where buying interest has previously occurred. The key levels are $1.561, and $1.388, and the monthly support zone in Yellow at $1.162 - $1.282. The Yellow zone has been identified as a strong support level. This monthly support zone indicates a higher level of buying interest. The price has bounced recently from this zone.
Daily Support Zone
A daily support zone has been identified in the Pink at $0.938-$0.989 area. If the price continues to fall, this area might serve as a solid support, offering a potential floor for buyers.
The current price actions of STX show an overall downtrend within a decreasing channel. As the price approaches key support levels at $1.561 and $1.388, these levels will be critical in determining the next directional move. Holding above these support levels may result in a positive reversal move, especially if the price breaks out of the decreasing channel and surpasses the upper resistance levels.
Failure to maintain support at these important levels, on the other hand, might lead to further drops, with the next major support region being the monthly support zone Yellow at $1.162 - $1.282. If the price drops further we might see it to the next daily support zone inPink at $0.938 - $0.989. Traders should keep a careful eye on these key levels for potential trading opportunities, as a breakthrough above the channel trend line and resistance levels could signify a move to bullish momentum, but a breakdown below the support zones might indicate sustained bearish pressure.

#STX/USDT#STX
The price is moving within a bearish channel pattern on the 12-hour frame, which is a strong retracement pattern
We have a bounce from a major support area in green at 1.25
We have a tendency to stabilize above the Moving Average 100
We have a downtrend on the RSI indicator that supports the rise and gives greater momentum, upon which the price is based higher at the discount
Entry price 1.36
The first target is 1.66
The second goal is 1.91
Third goal 2.20

STX is one of the best coins now...Why? Because it follows BTC so well.
If BTC pumps, STX will also perform well, saving and growing your portfolio. Additionally, it is a fundamentally solid project.
Targets are on the chart.
Invalidation: if the price stays below $1.30 and fails to reclaim it.
Long-term hold until May 2025.
