Alikze »» JASMY | Ascending channel🔍 Technical analysis: Ascending channel
In daily time, 1D is moving in an ascending channel.
💎 According to the pullback to the broken structure and the major roof, this upward movement can continue until the next area and the roof of the channel.
Considering that it is currently in the middle of the channel, the candlestick above the area reinforces the bullish structure.
💎 Alternative scenario: In addition, according to the trading node in the range of 0.024414, which is also around the bottom of the channel, in case of a break, the correction zone can continue until the liquidity zone.
»»»«««»»»«««»»»«««
Please support this idea with a LIKE and COMMENT if you find it useful and Click "Follow" on our profile if you'd like these trade ideas delivered straight to your email in the future.
Thanks for your continued support.
Best Regards,❤️
Alikze.
»»»«««»»»«««»»»«««
STX

STXUSDT Trade SetupThis coin is trying it level best to breakout on shorter Time Frame, if that resistance market as daily res is broken, it should fly higher than expectation.
Confluences:
1. Daily/Weekly Falling Wedge Breakout.
2. Lying on daily demand zone.
Thanks me later. Do not miss this before bull run starts.

Alikze »» STRK | Move to the roof of the descending channelIn the 4H time, after a mixed correction, it has reached the $1 range, after which it has faced demand.
💎 It is currently moving in a downward channel.
According to the current momentum in the region, the current demand is suffering.
In the next step, it can continue to grow up to the supply area and the ceiling of the channel, which is a dynamic trigger.
💎 If it breaks the supply zone, it can fill the FVG gap in the 4H time frame. Therefore, if you fill the gap and pullback to the broken structure, the next target will be the next supply area.
💎 Alternative scenario: If the demand area breaks downwards, which is also in the midline of the channel, this correction can be extended and extended to the bottom of the channel and the origin of the OB movement.
»»»«««»»»«««»»»«««
Please support this idea with a LIKE and COMMENT if you find it useful and Click "Follow" on our profile if you'd like these trade ideas delivered straight to your email in the future.
Thanks for your continued support.
Sincerely.❤️
»»»«««»»»«««»»»«««

STX Analysis: Eyeing Bullish ReversalKey Levels:
Support Level:
1.92 USDT (marked on the chart)
1.56 USDT (next major support below)
Resistance Level:
2.15 USDT (immediate resistance marked on the chart)
2.38 USDT (secondary resistance above)
3.10 USDT (projected upper target)
Current Trend:
The price is currently in a downward channel, indicated by the trend lines converging downwards.
There has been a consistent lower high and lower low pattern, characteristic of a downtrend.
Technical Indicators:
Stochastic RSI:
The Stochastic RSI is currently around 53.10, which is in the neutral zone but close to being oversold. This could suggest a potential for a reversal if it moves further down into the oversold territory (below 20).
Volume:
The volume shows some green bars, indicating buying interest at lower levels, which could support a potential reversal or bounce from current levels.
Potential Scenarios:
Bullish Scenario:
First Target: The price may attempt to break the immediate resistance at 2.15 USDT.
Next Target: If it successfully breaks above 2.15 USDT, the next resistance level to watch is 2.38 USDT.
Upper Target: A significant bullish move could see the price reaching up to 3.10 USDT, as indicated on the chart.
Bearish Scenario:
Immediate Support: The price might retest the support level at 1.92 USDT.
Next Support: If the 1.92 USDT level fails to hold, the next support is at 1.56 USDT.
Trading Strategy:
Long Position : Consider entering a long position if the price shows a strong reversal signal from the support level at 1.92 USDT, with a stop loss just below the support.
Short Position : Consider shorting if the price breaks below 1.92 USDT, targeting the next support at 1.56 USDT, with a stop loss just above 1.92 USDT.

STX - both entrys filled ✅This surge needed to correct at some point either we are going down now or we are pushing up a bit before correcting either way we should be falling in the near future and we want to place two entrys here on STX. The first entry is on the 4H FVG and the second DCA entry on the edge of the demand down below. We are using the same hard stopp on both entrys and the same target, the 12H supply zone. This target is just the first very big resistance you can hold it longer or close it before that. As always please try to think by yourself when trading and adopt your trading style and risk management to it.

Stacks (STX)Stacks started its upward impulse wave sooner than others. Back when a harmonic pattern ended and price settled on 0.618 Fibonacci level, STX started a strong upward wave. After a 500% growth, corrective wave started. Now it seems STX posed for continuation. Let's see what happens.

DCA on STXDCA on STACKS STX
We will have to be patient but I am convinced that in the long term it has potential.

STX STACKS WYCKOFFMarvelous Wyckoff distribution happening on STX. I will only be interested once it has completed its distribution.

STX/USDT It shows a strong bounce and Bullish momentum for STX!💎 Paradisers, #STX is indeed a coin worth closely monitoring.
💎 With a strong bounce from the support area accompanied by a significant green candle, STX is showing signs of bullish momentum, supported further by a MACD golden cross and bullish divergence.
💎 The next step for STX is to break above the resistance trendline to sustain its upward movement and potentially test our target strong resistance area.
💎 However, if STX fails to break above the resistance, there's a possibility of it retracing back to test the support around $2.06. STX must bounce from this level to maintain its bullish trajectory.
💎 Failure to bounce and hold above this support could lead to a breakdown, signaling a bearish turn. In such a scenario, the next level to watch would be the demand area around $1.74.
💎 Should STX reach the demand area, it needs to bounce and reclaim a position above the $2.06 support to resume its upward movement. However, if STX fails to bounce and breaks below the demand area, it could confirm a continuation of the downward trend, indicating further potential losses.
MyCryptoParadise
iFeel the success🌴

STX Holders! FOLLOW ME~!Hello, guys!
This is ESS team.
We've got STXUSDT analysis.
If Candles are supported by the bottom GREEN uptrend line and make an upward move, We expect candle break through the RED long-term downtrend line.
After the break, It expect to make a parrallel channel with GREEN lines, and rise up.

📈Market Volatility:STX Potential Trading Opportunities⚡️🔍In today's ever-evolving crypto landscape, marked by its characteristic volatility, it's imperative to conduct a thorough examination of potential trading opportunities. Focusing our attention on STX, a project with substantial potential within the realm of Bitcoin's second-layer solutions, we embark on a detailed analysis aimed at identifying strategic entry points amidst market uncertainties and fluctuations.
🌐STX's price action, observed through the lens of historical performance, reveals a compelling narrative. Having demonstrated an impressive uptrend, the recent retracement from the $3.7084 peak has given rise to a consolidation phase. This consolidation, encapsulated within a range-bound pattern, underscores the current state of market indecision.
📊Employing technical indicators such as Fibonacci retracements, we discern critical levels within STX's price structure. The retracement to the $2.2197 support level, coinciding with the 0.5 Fibonacci level, serves as a pivotal juncture for potential bullish momentum to resume. Furthermore, the SMA25 indicator, acting as a dynamic resistance level, adds another layer of significance to our analysis, warranting close observation as price dynamics unfold.
💡In devising entry strategies, a judicious approach is paramount given the prevailing market conditions. While awaiting confirmation of a breakout above the golden zone presents an opportunity for traders seeking higher probability setups, alternative entry points exist at key resistance levels, notably $3.0863 and $3.7084. However, it's crucial to underscore the inherent risks associated with trading during periods of heightened volatility, necessitating stringent risk management protocols to mitigate potential losses.
📈Delving into volume analysis, the point of control (POC) within the fixed range profile emerges as a critical metric, offering insights into price involvement and market sentiment. As market participants await further clarity, a cautious sentiment prevails, urging traders to exercise prudence and patience in their trading decisions.
📉Zooming out to a broader perspective, STX's long-term trajectory warrants consideration. While short-term fluctuations may present trading opportunities, adopting adaptive strategies capable of navigating evolving market dynamics is essential for sustained success in the volatile cryptocurrency landscape.
In conclusion, as we navigate the intricacies of STX's market dynamics, a holistic approach encompassing technical analysis, risk management, and sentiment considerations is indispensable. By remaining vigilant, adaptable, and disciplined in our trading endeavors, we position ourselves optimally to capitalize on emerging opportunities while mitigating potential risks.
🧠💼It's important to acknowledge the inherent risks in futures trading, with the potential for margin calls if risk management is neglected. Always adhere to strict capital management principles and utilize stop-loss orders, ensuring that the initial target offers a risk-to-reward ratio of 2

📉📈 STX Trading Analysis 📊💹📊 Current Status:
STX is holding at a significant support level.
📉 Potential Downside:
Losing this level could lead to a revisit of $1.80.
$1.80 aligns with the previous range high, the 0.618 Fib, and the 200 Day Moving Average (MA), forming a potential bottom and reversal zone.
🎯 Take Profit Targets:
Take Profit 1: $2.50
Take Profit 2: $4.00
📣 Stay attentive to market dynamics and adjust strategies as needed! 🌐💱 #STX #TradingAnalysis #CryptoMarket 📊💡
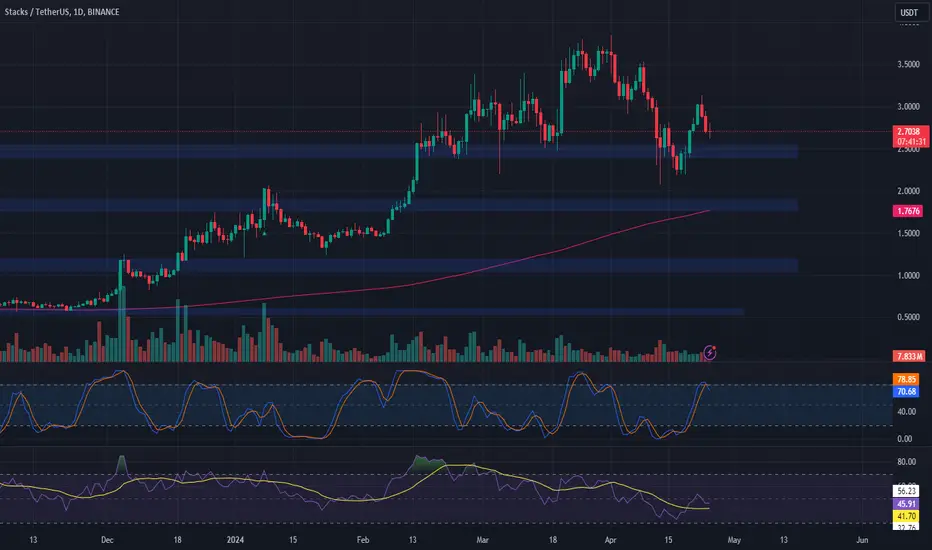
STX Price ReactionSTX is in an overall uptrend. Prices have moved within an ascending channel, forming higher lows and higher highs.
After breaking through a resistance marked in orange and performing a pullback, the price has reached the channel's upper boundary. Currently, with the formation of bearish candles, the price is reacting to the resistance at the top of the channel and may move towards the channel's lower boundary. Daily analysis also indicates a corrective phase.

STX STACKS Rising Bearish WedgeA rising wedge is generally a bearish signal as it indicates a possible reversal during an uptrend. Rising wedge patterns indicate the likelihood of falling prices after a breakout through the lower trend line.

Seagate Technology Stock Received Upside from Morgan StanleySeagate Technology Holdings Plc, known for its expertise in designing and manufacturing data storage devices, has recently received the attention of Morgan Stanley analysts and is earning a positive outlook. This endorsement comes amid expectations of the company reaching new price highs and making significant advancements in data storage technology.
Morgan Stanley's optimism is partly driven by the ongoing recovery in the data centre market, which is expected to continue. The upcoming cycle of storage hardware upgrades and the burgeoning demand for artificial intelligence (AI) technologies presents a fertile ground for Seagate's growth. As AI services often rely on extensive databases, the demand for substantial storage solutions becomes apparent, positioning Seagate favourably within the market.
Given this positive backdrop, a technical analysis of Seagate Technology's stock (STX) could provide valuable insights into its future price movements.
On the daily (D1) chart, Seagate's stock has established a support level at 85.26 USD and a resistance level at 98.80 USD, creating a wide trading channel with potential for an upward breakout. This pattern suggests a bullish outlook, with the stock potentially breaking through the resistance level and reaching new highs.
For traders looking at the hourly (H1) timeframe, a breach above the 98.80 USD resistance level could indicate a favourable entry point for long positions. A short-term price target is identified at 106.80 USD, with a medium-term goal extending up to 117.69 USD if the stock maintains its momentum beyond the initial breakout.
—
Ideas and other content presented on this page should not be considered as guidance for trading or an investment advice. RoboMarkets bears no responsibility for trading results based on trading opinions described in these analytical reviews.
The material presented and the information contained herein is for information purposes only and in no way should be considered as the provision of investment advice for the purposes of Investment Firms Law L. 87(I)/2017 of the Republic of Cyprus or any other form of personal advice or recommendation, which relates to certain types of transactions with certain types of financial instruments.
Risk Warning: CFDs are complex instruments and come with a high risk of losing money rapidly due to leverage. 66.02% of retail investor accounts lose money when trading CFDs with this provider. You should consider whether you understand how CFDs work and whether you can afford to take the high risk of losing your money.

STX / USDT FUTURES LONG ON SIGHTRight now i am in short position opened nearby last high, but i don't see strong reaction in this place. I will try to look for LONG positions and maybe some additional bags for my spot account.
Actual downward movement leaves so much liquidity to grab - means that it don't have much power/momentum.
We also need spring in this little reacumulation (if it's it)
I don't know if the price will come there in recent hours, days or in weeks or months.
I will try to seek long in golden hot zone
Target - new high

STX/USDT bullish reversal form key support? 👀 🚀STX analysis💎Paradisers! #STXUSDT looks like it's getting ready to climb. If it can keep up its energy at a crucial support level $2.3741 and bounce back, there's a good chance it'll start moving up, aiming to get past a big obstacle.
💎 Watching Closely: Right now, the price of #STACKS is heading towards an important level, and we're waiting to see how it behaves. Being patient and keeping a sharp eye out is crucial in trading. Looking back, we've seen the price respect this spot twice. However, on its third approach, a break occurred due to factors like Fair Value Gap (FVG), liquidity and OB right below the support.
💎Plan B: As smart traders, we always have a backup plan. If our hope for a rise at this spot doesn't happen and the price falls further, we'll change our game plan. We're looking at a potential bounce back from a lower spot at $2.0669, attracted by some strong market interest there that could push the price up again. If it falls below this, we might see it drop more.
💎 Flexible Moves: Paradisers, this situation shows why it's important to be flexible with our trading strategies. By watching closely and being ready to change plans based on what's happening, we set ourselves up for success. Your ParadiseTeam is here to help guide you through these market waves, making sure you're ready for whatever comes next.

#STX/USDT#STX
The price is moving in a triangle on the 12-hour frame and we have a green support area at the 2.50 level
We have a higher stability moving average of 100
We have a good bounce being set up from the lower border of the triangle
The RSI indicator has a downtrend that is about to break higher
Entry price 2.78
The first target is 2.90
Second goal 3.11
Third goal 3.33

The last bullish chance of STX in Mid term!Hi.
BINANCE:STXUSDT
😊Today, I want to analyze STX for you in a 3D time frame so that we can have a Mid-term view of STX regarding the technical analysis. (Please ✌️respectfully✌️share if you have a different opinion from me or other analysts).
STXUSDT produced an inverse Head & Shoulders on 3D and is about to break out the neckline of the one💡
✅ Due to the Ascending structure of the chart...
- High potential areas are clear in the chart.
- HEAD and SHOULDER
- AB=CD
Stay awesome my friends.
_ _ _ _ _ _ _ _ _ _ _ _ _ _ _ _ _ _ _ _ _ _ _ _ _ _ _ _ _ _ _ _ _
✅Thank you, and for more ideas, hit ❤️Like❤️ and 🌟Follow🌟!
⚠️Things can change...
The markets are always changing and even with all these signals, the market changes tend to be strong and fast!!

STX Re-Accumulation About to RipSTX is in the last stages of a re-accumulation here that should see the price significantly increasing in the coming days. Altcoin season is in full swing and this one is going to be a gem!

STXUSDT Buying the DipBINANCE:STXUSDT has done relatively well in the last few weeks and it is my opinion that STX still has some potential to move further. I am buying the dip at 2.8858
Do your due diligence and do not assume.
Thanks

$stx stacks rounded bottom pattern... Bigger Picture!NASDAQ:STX Stacks price action is currently forming a rounded bottom pattern on the weekly timeframe!
Current price: $2.9
#stacks price action is around it's previous all time high of 2021, forming a neckline resistance between 2.7-2.9.
NASDAQ:STX continuous rejection of neckline resistance will make for buy the dips opportunities at these supports: 2.4, 2.2, 1.8
Else A break out neckline resistance will lead to price discovery with resistances: 3.3, 3.6, 4.0, 4.4, 4.7, 5.1, 5.4

STX (Y24.P1.Video2).We are going ParabolicHi Traders,
We have hit our ATH and hence in price discovery.
We only have elliot wave and fibonacci as our toolset to forecast levels and targets.
Really depends on what BTC does for this to play out as well.
I explain the 2 scenarios that I have as a general approach.
Please give me a like and share,
Regards,
S.SAri
