STX: Navigating the Ups and DownsStacks (STX), a pivotal token in the blockchain ecosystem, has been charting an interesting course. A coin integral to the functioning of the decentralized apps and smart contracts on the Bitcoin network, STX has been showing signs of volatility, encouraging traders and investors to examine its performance closely.
Snapshot: Current Market Scenario
As of our analysis, the price of Stacks is at 0.7078, representing a drop of approximately 4% over the past 24 hours. This indicates a recent bearish sentiment in the market. However, as seasoned traders would affirm, the tide in the crypto market can turn swiftly, and current bearish trends do not rule out a potential bull run in the near future.
The Short-term Picture: 1 Hour Time Frame Analysis
On the one-hour chart, we observe an RSI value at 40, a level typically regarded as the brink of the oversold territory. This suggests that we might expect a potential price reversal or at least a pullback in the near future. Confirming this speculation is the MACD reading of -0.0068, which could indicate a shift in the market momentum towards the upside.
The Fibonacci Retracement, a tool used by traders to identify potential levels of support and resistance, shows 0.6988 as the 0 level, 0.7480 as the half level, and 0.7871 as the first level. These levels could play a significant role in the future price movement of STX. A volume oscillator at -18% suggests that trading volume has decreased, a trend often preceding a significant price movement.
Mid-Term Prospects: 4 Hour Time Frame Analysis
Zooming out to the four-hour time frame provides us a wider perspective. The RSI and MACD continue to indicate a potential bullish reversal, reaffirming the readings from the one-hour chart. The Fibonacci Retracement levels for this time frame are 0.7111 (0 level), 0.797 (half level), and 0.8829 (first level). An increase in trading volume may be required for the price to reach these levels.
The Long Game: Daily Time Frame Analysis
On the daily time frame, the indicators paint a slightly different picture. The RSI is sitting at a neutral 56, the MACD at 0.0358, and the stochastic is at 57, all hovering around the middle of their respective ranges. This neutrality suggests an equilibrium between buying and selling pressure, and we might be in for a period of consolidation.
Fibonacci levels are also of interest, with 0.8829 as the 0 level, 0.66 as the half level, and 0.4371 as the first level. These will likely be the critical levels to watch out for in the near to mid-term.
Wrapping Up
To sum up, despite the recent downward movement, the technical indicators suggest a possible change in market sentiment for Stacks (STX). The divergences between the different time frame charts underline the importance of considering multiple perspectives when forming a trading strategy.
The crypto market is dynamic and rapidly evolving, and while technical analysis can provide us with a roadmap, it’s important to stay abreast of the broader market news, changes in regulations, and macroeconomic factors that can impact the crypto landscape. Remember, trading always involves risks and it's crucial to trade responsibly based on thorough research and analysis.
In the case of STX, a coin that plays such a fundamental role in the Bitcoin network, both the micro trends (as indicated by the hourly and four-hourly charts) and the macro perspective (
from the daily chart) offer crucial insights. The technical indicators suggest a potential upward trend in the short term, while the daily chart may indicate a period of consolidation. As always, staying tuned to market fluctuations is key in this exciting and unpredictable realm of cryptocurrency trading.
STX

[UPDATE STX] Nothing to say. Short any squeezeLevel is clear.
I'm wrong above 0.95.
Will increase my short position if I see any bounce at 0.62-0.77-0.84 (if)
Bye.

Stacks emerges top gainer with 13% surge 🔋👽STACKS was a great entry for us yesterday and a very promising one for the future.
1.17 mid of ascending channel
1.795 technical resistance
2.38 end of ascending channel
19$ potential for 2025/early 2026 (where i see end of next cycle)
Stacks is a blockchain protocol that leverages bitcoin’s security and state through the innovative proof-of-transfer (PoX) consensus mechanism. With this integration, Stacks seeks to enable smart contract capabilities on the bitcoin network and bolster scalability.
Per data from price-tracking platforms STX, its native token, has been the biggest gainer among the top 100 assets by market capitalization in the past 24 hours. With a13% surge, STX has outperformed bitcoin (BTC) over seven times within this timeframe.
Let's go STACKS!
The FXPROFESSOR

🔔 Jingle all the way, oh what fun it is to ride the STX train🚄🔔Merry Xmas to all SEC and Powell bears:
🔔reference:
🔔Dashing through the snow
In a one-horse open sleigh
O'er the fields we go
Laughing all the way
Bells on bobtails ring
Making spirits bright
What fun it is to ride and sing
A sleighing song tonight, oh!🔔
🔔Jingle bells, jingle bells
Jingle all the way
Oh, what fun it is to ride
In a one-horse open sleigh, hey!🔔
🔔🔔🔔MERRY XMAS JEROME, MERRY XMAS SEC!🔔🔔🔔 HAPPY NEW YEAR BEARS!!
The FXPROFESSOR 🎅
OH I FORGOT: STX IS A TRAIN 🚄🚄🚄🚄🚄🚄🚄🚄

🅱️ Bitcoin Short-Term (Another Shakeout, Why?) +AltcoinsThe reason why shakeouts are happening to the downside is to kill the longs, as many longs as possible.
The only reason to "kill longs" is because prices are about to grow strong on a mid-term basis.
If Bitcoin was set to drop as the main move, not short-term noise, then instead of whales killing the longs they would be letting them pile up and instead kill the shorts.
Many longs can pile up and then all be removed in one hit with a long squeeze, this is what will happen to the shorters soon enough...
Tomorrow is an important day, read the latest update on this trade idea below, about the 4/5 consecutive days pattern, it will break everything we've seen since January 2023; Tomorrow is the decisive day!
🅱️ Bitcoin 1,2,3,4 Steps Pattern ($35,000 August 2023)
Remember how we are using XRP as it is leading the market?
It is already giving signs of a higher low... Green Monday or bull trap?
Only hours left!
✴️ XRP | Higher Low, Starts Recovery?
Thanks for reading.
Remember to boost, comment and follow.
Visit my profile for update on all the main Altcoins (BNB, SOL, LINK, ICP, FIL, STX, FET, UNI, DYDX, etc.)
Namaste.

✳️ Stacks vs Bitcoin Long-Term | Complete Cycle MappedHello my dear Cryptocurrency trader, let me show you why I am bullish on Stacks vs Bitcoin long-term.
November 2022 marks the "All-Time Low", left side of the chart. After we hit bottom, the only place left to go is up and this leads to a massive bull market.
A bull market leads to a bear market and this is also clearly marked on the chart.
The bear market most come to and end by hitting a new low and in this case a long-term higher low (January 2023 higher low vs November 2020 all-time low).
Between June 2022 and January 2023 is the "consolidation phase", same as Bitcoin and the rest of the market and then comes a bullish breakout, recovery, the new bullish phase and it starts with 333%.
Such growth needs a correction, now taking place, a "steep correction" on the chart... This correction will lead to a new bullish wave, the continuation of the initial breakout. This is true for the ENTIRE CRYPTOCURRENCY MARKET.
Thank you for reading.
Namaste.

Stx Getting Ready for 1.50$Seems Like getting Ready to Make New High Consolidating In Descending Channel since Long time Incase Of breakout Expecting Move towards 1.50$

STXUSD Making a strong bullish breakoutSTXUSD / Stacks crossed yesterday over the 2.5 month Channel Down and today over the 1day MA50 for the first time since April 14th.
This is second buy signal after the rebound 2 days ago on the 1day MA200.
Buy and target Resistance A at 0.82000.
If the price then closes a 1day candle above Resistance A and pulls back near the 1day MA50, buy again and target Resistance B at 1.010000.
Follow us, like the idea and leave a comment below!!

STXUSDT Signals Potential Bullish Breakout with Falling Wedge 💎 STXUSDT pair has formed a falling wedge pattern on the 4-hour timeframe, indicating a potential bullish reversal.
💎 As the trading volume gradually decline. This signifies reduced selling pressure and accumulation by buyers. An increase in volume during the breakout can further confirm the bullish outlook.
💎 If the breakout occurs above the upper trendline of the falling wedge, it could lead to a potential upward price movement.
Disclaimer: This is Not Financial Advice ❗️ Trade at Your Own Risk ⚠️

✴️ Stacks, Bullish Chart SetupStacks has been in a correction since late March, even though we had a strong market shakeout yesterday it looks good today.
STXUSDT Bullish Signals
We have a higher low this month vs 10-March.
We have a falling wedge pattern.
Bullish divergence with the RSI.
Volume breakout.
This chart looks like a great setup.
Low risk with a potential that can go beyond 80% in the short-term.
Wishing you a lovely Wednesday.
Namaste.

STACKS- Time to Un-stuck the Stacks 🥞🥞🥞Very volatile but that's not a bad thing (for me at least).
STACKS is very promising and i keep it in spot with patience.
CHART:
Between 0.52-0.63 lies great support.
TARGETS:
🥞0.779 Interim resistance/target
🥞1.07 Target 1
🥞1.78 main resistance/Target for 2023
🥞19$ is the potential i see for 2025-2027
One Love,
The FXPROFESSOR 🌅

STX on crucial support zone#STX dumped -14% since perfect breakdown
Now it's testing support zone, wait for proper bounce or breakdown - retest confirmation before LONG or SHORT!

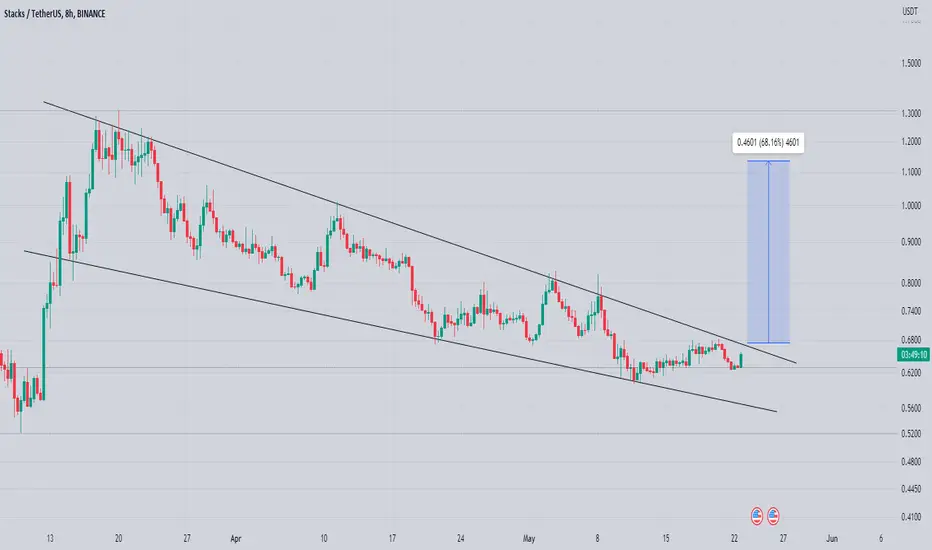
Stx Getting Ready For Massive Bullish impulse Seems Like getting Ready For Upside Continuation formed Falling Wedge In h8 Timeframe Incase Of Breakout expecting 65 to 70% bullish Wave
Indicators Signal Short-Term Buying Opportunity for STX (Stacks)I aspire, and expect Bitcoin to recover and resume its upward movement, with $STX ultimately closing the weekly candle above $0.84. Nevertheless, in technical analysis and trading, wishful thinking is not enough and holds no weight. The key is to identify conditions with a high likelihood of success.
Presently, $STX has fallen below $0.84 and is expected to continue its downward trend for the time being. Nonetheless, there is still hope for the short term.
The 'ZigZag Fibonacci Tool' has automatically mapped out several Fibonacci levels that could potentially serve as support zones in the future (see my green arrows)
Additionally, the Chris Moody Slingshot tool indicates a high probability of an upward tick around $0.77. The green candle colour suggests a conservative buying opportunity at present.
Furthermore, the TD Sequential countdown to 9 on the daily chart indicates a buying opportunity as it identifies turning points in asset or index price trends, printing a TD9 after nine consecutive candles above/below the previous four candles' closing price.
In conclusion, although Stacks has slipped through its support zone, favourable days are expected in the short term.
The current undervaluation of $STX makes it an attractive bargain.

STX DROP MORE VERY SOONHi, dear traders. how are you ? Today we have a viewpoint to BUY/SELL the STX symbol.
For risk management, please don't forget stop loss and capital management
When we reach the first target, save some profit and then change the stop to entry
Comment if you have any questions
Thank You

STX USDT LONG SWING | STXUSDT | LONG @ 0.75 - 0.78 | TP @ 0.79, 0.8, 0.81, 0.82, 0.83 | SL @ 0.66 | PATTERN = ASCENDING CHANNEL | BINANCE |
Swing trade idea. Kindly follow targets and stop loss. Will update with new targets once all 5 are achieved. Mostly trading with PNF charts, MACD, RSI, Stoch, BPI, Cipher, MA/EMA, Support/Resistance on hourly timeframes and higher time frames
BINANCE:STXUSDT BINANCE:STXUSDT.P BYBIT:STXUSDT.P KUCOIN:STXUSDT COINBASE:STXUSD COINBASE:STXUSDT OKX:STXUSDT.P OKX:STXUSDT OKX:STXUSDC KRAKEN:STXUSD BINANCE:STXBUSD MEXC:STXUSDT.P

STXUSD near the bottom of its Rising Wedge.Stacks (STXUSD) had a Double Top rejection this week on its 1D MA50 (blue trend-line) and is approaching the bottom of the long-term Rising Wedge pattern. With the presence also of the 0.382 Fibonacci, this is the strongest buy signal since February 15. The 1D MA200 (orange trend-line) is right below it and the 1D RSI is close to the 30.00 oversold level. We are turning into buyers again, targeting the 0.786 Fibonacci at 1.80000.
-------------------------------------------------------------------------------
** Please LIKE 👍, FOLLOW ✅, SHARE 🙌 and COMMENT ✍ if you enjoy this idea! Also share your ideas and charts in the comments section below! **
-------------------------------------------------------------------------------
💸💸💸💸💸💸
👇 👇 👇 👇 👇 👇

STX Coin Price Prediction✅ STX COIN PRICE ✅
🔥STX is trading at a nice resistance area but I will wait for Daily Candle Close🔥
If We see a Bearish Daily Candle closure ..
🚀There will be a 12%-28% Gains Opportunity🚀
👉 Follow me for more opportunities.

STX/USDT Looks bullishBINANCE:STXUSDT now stronger than other coins. Massive buy, when BINANCE:BTCUSD was falling.
Opened position at 0.73, good luck for me )

Stx Getting ready For Another Breakout Seems Like Getting Ready for Another Bullish impulse Forming bullish Pennant in h8 timeframe Incase Of Breakout expecting Bullish Move towards 1.50$

$STX looking bullishCOINBASE:STXUSD is looking pretty bullish. As you can see on the chart, price has been consolidating in a falling wedge, and it looks like it's about to break out.
It could either go up here, or it could retest the $.75 region before heading higher. Either way, price looks like it wants higher.
I entered a position at $.7375. My bias leans towards the $.99 - $1.10 region as the short term top, then I could see price retesting this structure before heading much higher.

Short $STXI wanted to share with you some insights into my trading strategy. I have developed a system where I identify "buy zones" (indicated in green) and "sell zones" (indicated in red) to help me make informed decisions about when to buy and sell securities or assets.
Based on my analysis, I have noticed that in the red sell zones, there are typically two bounces, with the first bounce being a liquidation of short sellers. As of now, I believe it's time to sell, as I have identified a red zone where I anticipate prices to decrease.
Please keep in mind that trading strategies always involve risk, and it's important to have a solid understanding of market conditions and trends. I highly recommend conducting extensive research and seeking advice from a professional financial advisor to minimize your risks and increase your chances of success.
Thank you for your attention, and I hope that this information has been useful to you.

