STXUSDT on the Edge: Massive Rally or Sharp Drop Incoming? Yello! Are you prepared for what’s about to unfold with #STXUSDT? The price action is heating up, and the next move could be explosive. #STX is flashing signs of a critical Elliott Wave structure, and what happens next will determine whether we’re headed for a massive rally or a sharp correction. Let’s dive into the details.
💎#STXUSDT has just completed a corrective Wave 4 within the Elliott Wave structure. Right now, we’re expecting an impulsive 5th wave to kick in, supported by key indicators. Both RSI and MACD are showing bullish divergence, suggesting that the corrective ABC wave may be complete, setting the stage for a potential bullish breakout.
💎However, the critical support level at $0.915 will be key. If this level holds, we expect bullish momentum to continue, confirming the start of Wave 5. But if $0.915 fails, we’ll be watching for a bullish rebound from the imbalance zone. A break below this area could invalidate the bullish wave count and open the door for further downside.
The next move will separate the pros from the amateurs. Stay sharp, stay strategic, and as always trade smart, Paradisers. 💪
MyCryptoParadise
iFeel the success🌴
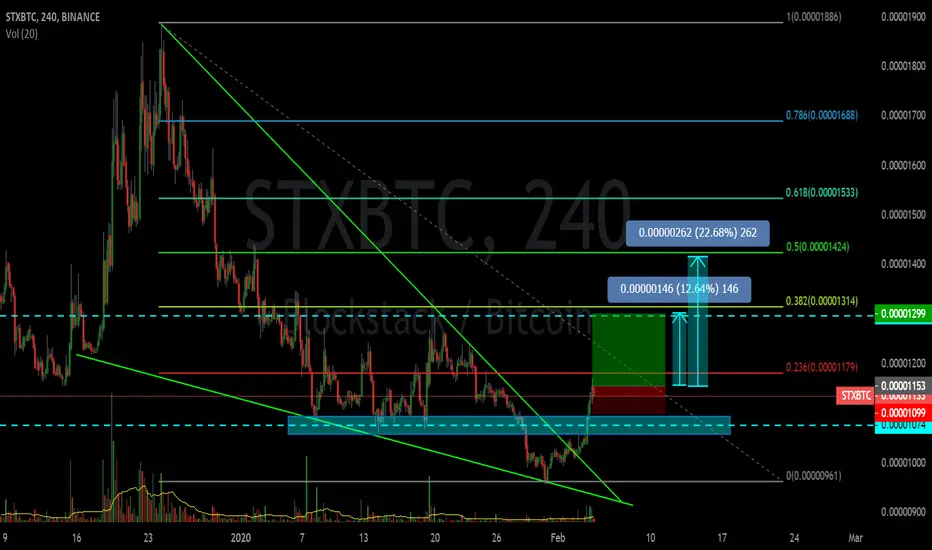
Stxlong

STX 1$ Resistence ZoneBINANCE:STXUSDT
✅Before we start to discuss, I would be glad if you share your opinion on this post's comment section and hit the like button if you enjoyed it. Thank you.
Possible Targets
➡️globally we came in to -0.27 Zone (usually play like accumulation zone for investors)
➡️Main support area in case if BTC drop again to test 19-17K STX should hold 0.30 cent
➡️ We going out of global downtrend line since November 2021
➡️ Next resistance zones where we can going down again marked on chart
➡️ Main resistance zone and psychological level is 1$ where I think we will find huge sales and come back to test main support zone in September-October again.
Hope you enjoyed the content I created, You can support with your likes and comments this idea so more people can watch!
✅Disclaimer: Please be aware of the risks involved in trading. This idea was made for educational purposes only not for financial Investment Purposes.
* Look at my ideas about interesting altcoins in the related section down below ↓
* For more ideas please hit "Like" and "Follow"!

#STX/USDT / Ready to go up#STX
The price is moving in a descending channel on a 1-day frame and sticking to it well
We have a bounce from the lower limit of the descending channel, this support is at 1.46
We have a downtrend, the RSI indicator is about to break, which supports the rise
We have a trend to stabilize above the 100 moving average
Entry price 1.78
First target 2.00
Second target 2.23
Third target 2.50

STXUSDT 2DSTX ~ 2D
#STX Best strategy for COINBASE:STXUSD , Buy on breaking out of this descending pattern, or buy in the demand zone.

STX Accumulation / Massive Pump IncomingSTX has a perfect accumulation that just put in a spring right here. We're right near the bottom of what's about to become a massive pump. Altcoin season is in full swing and this is the next top gainer! TD Sequential has 789 on the daily and oscillators are showing daily bullish divergence.

#STX/USDT#STX
The price is moving in a triangle on the 12-hour frame and we have a green support area at the 2.50 level
We have a higher stability moving average of 100
We have a good bounce being set up from the lower border of the triangle
The RSI indicator has a downtrend that is about to break higher
Entry price 2.78
The first target is 2.90
Second goal 3.11
Third goal 3.33

STX Has A very good Investment Opportunity Hi Everyone;
today we have one of the best risk to reward Investment opportunity
it is more than 860 times the risk and the chart is look very promising.
I expect breaking the previous bear market key point will clear the way to the final target

STX/USDT Looks bullishBINANCE:STXUSDT now stronger than other coins. Massive buy, when BINANCE:BTCUSD was falling.
Opened position at 0.73, good luck for me )

STX 4H BUYSTX 4H support is now at $0.72
Enter 50% at the current price
and try to set some BUY orders near the support zone
If STX stays above the trendline,
the Take-Profit target would be 5%, 10%, and 15% from your entry
Cheers

STX LONG & HOLDSTX insight.
Stacks has shown a formidable growth in the last few weeks and the best approach at the moment would be to buy some of this coin at the pullback to the highlighted zone.
The possible targets of this move are highlighted by lines for you.
Just hold and rebuy.

STXUSDT: Flexible Trading PlanLet's consider an excellent situation on the STXUSDT.
Based on the current wave structure, I plan the opening of a long position or the opening of a short position.
On the one hand, the current corrective in wave 4 may end up forming a WXY pattern; on the other hand, the current corrective pattern in wave 4 may end up forming a triangle pattern.
It is advisable to open a long position at a breakdown of the top of the presumed wave 1 in wave C of wave Y (after the completion of wave 1 and the formation of a local correction in wave 2).
Opening a short position is relevant in case of a breakdown of the low of the triangle pattern - the minimum of wave D.
In both cases, with a moderately aggressive approach, it is possible to extract a good profit in a short period of time.

STXUSDT trade I the best trading pointSTXUSDT trade in the best situation where it can boost up 3X. Trade will be between 78% fib level and 261% fib level. We will update further about analysis if we find any change in idea. Stay tune.


Stacks/USD LongStacks has been going up with several retest but on the long run, we can see an uptrend anyways. I have forecasted a bullish trend for Stacks. Let me know what you think about this pair.


#STX chart Looks healthy #STX charts Looks healthy, 12H candle Closes in Green, #Breaktout the falling wedge, good #BUY signal from here, it's time to see a higher level at resistance level as shown on the chart.
#DYOR