STXUSDT Resistance Line Breakout!STXUSDT Technical analysis update
Buy zone: Below $0.330
Stop loss: $0.290
Take Profit 1 : $0.360
Take Profit 2 : $0.410
Take Profit 3 : $0.520
spot trade
Always keep stop loss
Thanks
Hexa
Stxusd

STX/USDT | Pretty Solid Breakout..!!
#STX Falling Wedge Breakout has Confirmed in the Daily TF Chart..!!
Looks Promising for the Midterm Hold..
Expecting +200-250% Bullish Wave in the Midterm So Keep it under the Radar.
Please like the idea for Support & Subscribe for More ideas like this and share your ideas and charts in Comments Section..!!
Thanks for Your Love & Support..!!

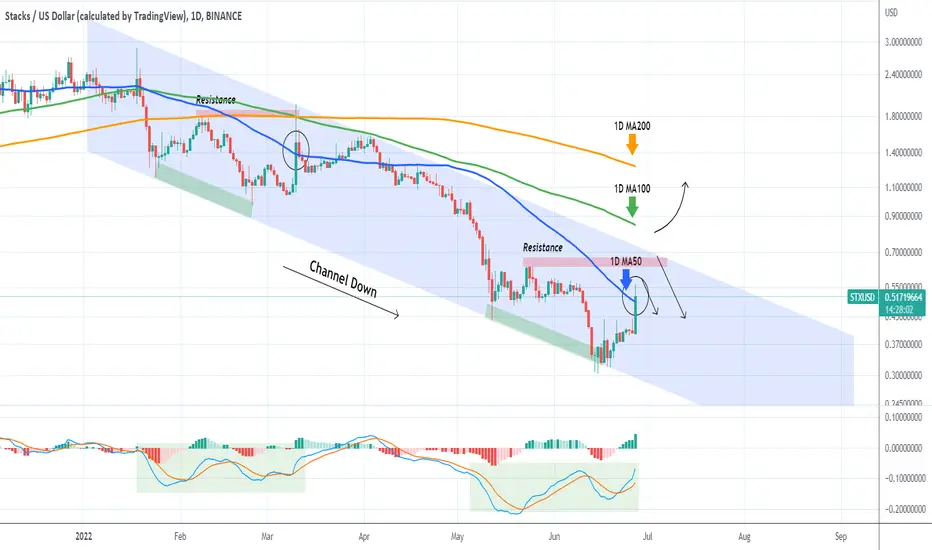
STXUSD Rebound contained below the 1D MA100Stacks (STCUSD) has had a +50% rebound on today's peak but we see the effect retracing as it almost hit the 1D MA100 (green trend-line). As long as it fails to close a candle above it, expect a Lower Low within the Channel Down pattern that it has been trading in since May 31. A break above the 1D MA100 targets the 1D MA200 (orange trend-line) which has been unbroken since January 21. A closing above it would still be limited to the top (Lower Highs trend-line) of the Channel Down but still a major bullish development for the long-term nonetheless. In order to sustain an uptrend in this case, the 1D MA50 (blue trend-line) has to be tested and hold as a Support.
-------------------------------------------------------------------------------
** Please LIKE 👍, SUBSCRIBE ✅, SHARE 🙌 and COMMENT ✍ if you enjoy this idea! Also share your ideas and charts in the comments section below! This is best way to keep it relevant, support me, keep the content here free and allow the idea to reach as many people as possible. **
-------------------------------------------------------------------------------
You may also TELL ME 🙋♀️🙋♂️ in the comments section which symbol you want me to analyze next and on which time-frame. The one with the most posts will be published tomorrow! 👏🎁
-------------------------------------------------------------------------------
👇 👇 👇 👇 👇 👇
💸💸💸💸💸💸
👇 👇 👇 👇 👇 👇

Stacks Attempting Falling Wedge Breakout on Higher TimeframesWe have the slightest bit of Bullish Divergence here on the RSI with Declining Volume to the Downside and are just about to test the Strength of this Wedge's Supply Line for the first time Since the start of the year. If we can break free from this Wedge we can very well see a Reciprocal ABCD move that would take us back to the 88.6% Retrace Above.

STXUSDT: Flexible Trading PlanLet's consider an excellent situation on the STXUSDT.
Based on the current wave structure, I plan the opening of a long position or the opening of a short position.
On the one hand, the current corrective in wave 4 may end up forming a WXY pattern; on the other hand, the current corrective pattern in wave 4 may end up forming a triangle pattern.
It is advisable to open a long position at a breakdown of the top of the presumed wave 1 in wave C of wave Y (after the completion of wave 1 and the formation of a local correction in wave 2).
Opening a short position is relevant in case of a breakdown of the low of the triangle pattern - the minimum of wave D.
In both cases, with a moderately aggressive approach, it is possible to extract a good profit in a short period of time.

STXUSD First time above the 1D MA50 since April!Stacks (STCUSD) hit today and broke above its 1D MA50 (blue trend-line) for the first time since April 18 2022. The coin has been trading within a Channel Down pattern since the January 18 High. The long-term trend remains bearish as despite today's impressive 1D candle, the price remains both below the previous Resistance level and the Lower Highs trend-line (top) of the Channel Down.
Both in candles and in 1D MACD terms, today's formation resembles the 1D MA50 test of March 10. This candle not onl broke above the 1D MA50 but also marginally above its prior Resistance Zone and the 1D MA100 (green) and 1D MA200 (orange trend-line) periods (which at the time converged and transitioned into the bearish trend), but still got rejected at the top of the Channel Down.
As a result, we can only take a short-term buy here towards the Resistance and top of the Channel but not a long-term one. In order to buy comfortably on a medium-term horizon, the price needs to break and close above the 1D MA100 (green trend-line). In that case the target will be the 1D MA200.
--------------------------------------------------------------------------------------------------------
Please like, subscribe and share your ideas and charts with the community!
--------------------------------------------------------------------------------------------------------
Stacks has bottomed at the 0.618 Fibonacci retracementSTXUSDT has put down a textbook 0.618 Fibonacci retracement correction on the weekly chart.
In my Elliott Wave count, the last impulsive wave was a truncated fifth. In a new wave count, the retracement to the 0.618 Fibonacci is a corrective wave 2. Such a correction is not unusual for a corrective Wave 2.
The Tom Demark (TD) Sequential Indicator indicates a 9-candle count. This usually means that a bottom has been reached and a trend reversal will occur. It indicates a set-up to take a position in the market.
I have additionally used the Chris Moody Indicator "RSI Strategy Lower". This indicates by means of the RSI that a bottom has been reached. This can also be seen by the formed horizontal green line; this is now starting to move upwards.
If STXUSDT is preparing for an impulsive wave 3, interesting times are coming...

STX based on the analysis STX is going to 0.78 but in my opinion as soon it breaks 0.97 level the correction is completed before hits the target.
peace:)

💡Don't miss the great buy opportunity in STXUSD @StacksTrading suggestion:
". There is a possibility of temporary retracement to the suggested support line (1.295).
. if so, traders can set orders based on Price Action and expect to reach short-term targets."
Technical analysis:
. STXUSD is in a range bound, and the beginning of an uptrend is expected.
. The price is above the 21-Day WEMA, which acts as a dynamic support.
. The RSI is at 75.
Take Profits:
TP1= @ 1.595
TP2= @ 1.769
TP3= @ 1.988
TP4= @ 2.195
TP5= @ 2.465
SL= Break below S2
❤️ If you find this helpful and want more FREE forecasts in TradingView
. . . . . Please show your support back,
. . . . . . . . Hit the 👍 LIKE button,
. . . . . . . . . . Drop some feedback below in the comment!
❤️ Your support is very much 🙏 appreciated!❤️
💎 Want us to help you become a better Forex / Crypto trader?
Now, It's your turn!
Be sure to leave a comment; let us know how you see this opportunity and forecast.
Trade well, ❤️
ForecastCity English Support Team ❤️

💡Don't miss the great buy opportunity in STXUSD @StacksTrading suggestion:
". There is a possibility of temporary retracement to the suggested support line (1.295).
. if so, traders can set orders based on Price Action and expect to reach short-term targets."
Technical analysis:
. STXUSD is in a range bound, and the beginning of an uptrend is expected.
. The price is above the 21-Day WEMA, which acts as a dynamic support.
. The RSI is at 74.
Take Profits:
TP1= @ 1.595
TP2= @ 1.769
TP3= @ 1.988
TP4= @ 2.195
TP5= @ 2.465
SL= Break below S2
❤️ If you find this helpful and want more FREE forecasts in TradingView
. . . . . Please show your support back,
. . . . . . . . Hit the 👍 LIKE button,
. . . . . . . . . . Drop some feedback below in the comment!
❤️ Your support is very much 🙏 appreciated! ❤️
💎 Want us to help you become a better Forex / Crypto trader ?
Now, It's your turn !
Be sure to leave a comment; let us know how you see this opportunity and forecast.
Trade well, ❤️
ForecastCity English Support Team ❤️


STX BOUNCE OR MORE CORRECTION?STX is a good project. You can earn BTC by staking your STX coins.
STX is standing on the red trendline. If this trendline going to be broken, I guess it can fall back to 0.5$. In my opinion, this area is a strong buy area.
In case of bounce, if it can menage to go above 2.8$ next target will be the upper trendline.
This is my trial. Not a financial advice.

Bag🎒 your STACKS once again! Stacks broke up this triangle 📐 and I think there is chance for run to 3.55 and even higher. Setting BUY LIMIT order to catch the pullback. STX just pamp eet! ⛽
ENTRY : local high @ 2.19
STOPLOSS (SL) : local low @ 1.94
TARGETS (TP) : TP1 - resistance @ 2.70 | TP2 - resistance @ 3.09 | TP3 - height of the triangle projected from midpoint of the local range (BUY LIMIT - SL) @ 3.55
REWARD RISK RATIO (RRR) : TARGET1 - 2.0 | TARGET2 - 3.6 | TARGET3 - 5.5
INVALIDATION : when SL level hit
My previous STX ideas 👇
Check my other stuff in related ideas.
Please like👍, comment🗣️, follow me✒️, enjoy📺!
⚠️Disclaimer: I'm not financial advisor. This is not a financial advice. Do your own due dilingence.

STXUSD Last dump before a multi-month rally.Stacks has been trading within a long-term Channel Up since the start of 2020 and is about to form a 1D MA50/ MA100 Bearish Cross. This is similar to the Bearish Cross of October 10 2020, which was the cross that paved the way for a 3 month rally. The 1D LMACD sequence between the two fractals is also identical. We should be expecting a bullish break-out by the first week of February.
--------------------------------------------------------------------------------------------------------
** Please support this idea with your likes and comments, it is the best way to keep it relevant and support me. **
--------------------------------------------------------------------------------------------------------

$STX /USD, ATH and instant 20% $STX /USD
ATH and fast 20% on a new 2D Buy signal by UCTS
(I will take it😄)
Let see if it can hodl/flip this area and look for continuation after such breakout
#STX

Stacks (STXUSD) to break some resistancesStacks (STXUSD) to break some resistances.
Those are at current price level for a new ATH.
But also in the OBV and later at the critical RSI-level.
But specifically the OBV is rising in a stable way.
And still some space until the above mentioned RSI "danger zone" 😎
Drop me a nice comment if you'd like me to analyze any other cryptocurrency or do another comparison.
*no financial advice
do your own research before investing

stx/usdt analysishello my friends
this my idea about stx all things are clear on the chart
thank you

Stacks (STX) - November 25Hello?
Welcome, traders.
If you "follow", you can always get new information quickly.
Please also click "Like".
Have a nice day.
-------------------------------------
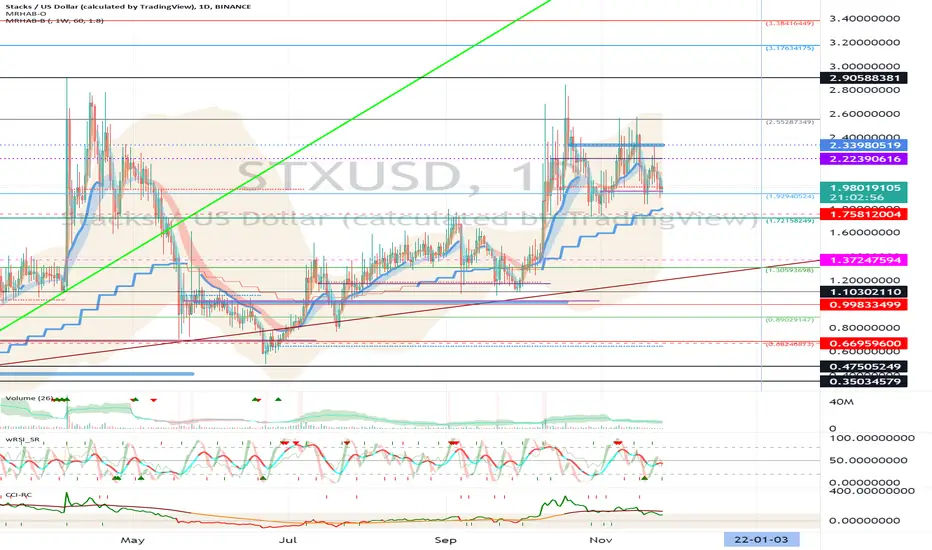
(STXUSD 1W Chart) - Mid-Long-Term Perspective
Above 0.35034579-0.47505249 section: expected to continue upward trend
0.99833499-1.10302110 or higher: Expected to create a new wave.
(1D chart)
First resistance section: near the 2.55287349 point
Second resistance section: 3.17634175-3.38416449
Support section: 1.72158249-1.92940524
If the price is maintained in the range of 1.92940524-2.55287349, it is expected to renew ATH.
It should rise above the 2.33980519-2.55287349 section to accelerate the uptrend.
If the price declines from the support zone, it may move towards the 1.10302110 point, so trade cautiously.
------------------------------------------
(STXBTC 1W chart)
Above the 2735 Satoshi point, we need to see if we can continue the uptrend along the uptrend line.
------------------------------------------
We recommend that you trade with your average unit price.
This is because, if the price is below your average unit price, whether it is in an uptrend or in a downtrend, there is a high possibility that you will not be able to get a big profit due to the psychological burden.
The center of all trading starts with the average unit price at which you start trading.
If you ignore this, you may be trading in the wrong direction.
Therefore, it is important to find a way to lower the average unit price and adjust the proportion of the investment, ultimately allowing the funds corresponding to the profits to regenerate themselves.
------------------------------------------------------------ -----------------------------------------------------
** All indicators are lagging indicators.
Therefore, it is important to be aware that the indicator moves accordingly as price and volume move.
However, for the sake of convenience, we are talking in reverse for the interpretation of the indicator.
** The MRHAB-O and MRHAB-B indicators used in the chart are indicators of our channel that have not yet been released.
(Since it was not disclosed, you can use this chart without any restrictions by sharing this chart and copying and pasting the indicators.)
** The wRSI_SR indicator is an indicator created by adding settings and options to the existing Stochastic RSI indicator.
Therefore, the interpretation is the same as the traditional Stochastic RSI indicator. (K, D line -> R, S line)
** The OBV indicator was re-created by applying the formula to the DepthHouse Trading indicator, an indicator disclosed by oh92. (Thanks for this.)
** Support or resistance is based on the closing price of the 1D chart.
** All descriptions are for reference only and do not guarantee a profit or loss in investment.
(Short-term Stop Loss can be said to be a point where profit and loss can be preserved or additional entry can be made through split trading. It is a short-term investment perspective.)
---------------------------------
STX/USDTesting/tracking elliot wave theory. Please do not trade off idea without S/L. Not financial advice.

Bag your STACKS again!Stacks recently pumped as predicted in the idea below:
After hitting my target it's consolidating in another triangle and now it seems to be ready to break up also this new triangle 📐. If successful I think there is chance for run to 2.94 and even higher. STX , just do it again! ✔️
ENTRY : local high @ 2.24
SL : local low @ 2.04
TARGET : height of the triangle projected from midpoint of the local range (BUY STOP-LIMIT - SL) @ 2.94
RRR : 3.4
INVALIDATION : when SL level hit
Check my other stuff in related ideas.
Please like👍, comment🗣️, follow me✒️, enjoy📺!
⚠️Disclaimer: I'm not financial advisor. This is not a financial advice. Do your own due dilingence.

Bag your STACKS!Stacks broke up this triangle 📐 and I think there is chance for run to 2 and even higher. Setting BUY LIMIT order to catch the pullback and add to my stack. Check the other triangle breakouts in related ideas STX just do it! ✔️
ENTRY : local high @ 1.377
SL : local low @ 1.277
TARGET : height of the triangle projected from midpoint of the local range (BUY LIMIT - SL) @ 1.99
RRR : 6.1
INVALIDATION : when SL level hit
Please like👍, comment🗣️, follow me✒️, enjoy📺!
⚠️Disclaimer: I'm not financial advisor. This is not a financial advice. Do your own due dilingence.


Stacks/USD LongStacks has been going up with several retest but on the long run, we can see an uptrend anyways. I have forecasted a bullish trend for Stacks. Let me know what you think about this pair.
