Stacks · Major Flush Reveals End of Correction · New CycleStacks all-time high was hit April 2024. This ATH comes as a long-term double-top because it happened within the same November 2021 peak price range.
After a major wave there is always a correction. A correction can happen in any direction. If the trend is bearish, the correction is an up-move. If the trend is bullish, the correction is a down-move. Very simple.
The 2021 all-time high is the natural end of a major bullish cycle and thus a correction follows. The correction lasted from November 2021 until November 2022. Naturally, a major market bottom signals the start of a change of trend.
Here STXUSDT produced a bullish cycle from November 2022 until April 2024, 504 days. In April 2024 we have a new major high and this signals the start of a bearish wave. The bearish wave went from April 2024 through April 2025. The end of the down-move would signal the start of a new bullish cycle but, how do we know the down-move is over? Answer: A major market flush.
On the 12-May week there was a major market flush with a session reaching lower than the 7-April low. This is the bottom signal. It reveals itself as a bottom signal because instead of a new lower low close the week recovered and closed very high. After a higher low in June compared to April we now have four green weeks and we know what the rest of the market is doing so we can predict easily a bullish continuation; a price increase.
The size of the drop between April 2024 and May 2025 reached -92.49%. That's a huge drop. Almost all the gains from the previous 504 days bullish cycle was erased. The market has no reason nor need to move lower, for what? There is no need to dig for anything down there and that's the signal that reveals the bottom is in. Because the correction was so strong, we can expect a change of trend. We are aiming up.
Stacks major market flus in May 2025 reveals the correction is over. With the end of a strong bearish cycle confirmed, we can now expect a strong bullish cycle to develop next. If we go by past history, we can see sustained growth, it can happen for years or in the least many months.
How long will the bullish cycle last?
I don't know.
From March 2020 to November 2021 we have 630 days. The other cycle I just mentioned lasted 504 days. We can use these numbers to make some predictions but it is hard to say because market conditions are not the same.
504 days from May's low into the future gives us a date of September 2026. 630 days puts us at February 2027.
If we go by the law of alternation, we had a long cycle in 2020/2021 so this time we get a short one, say 38% or half the past bull market, this would give us 239 and 315 days. These two will give us dates between January and March 2026 for a new all-time high or cycle top.
Now, I cannot predict how long the bull market will last but I can predict that prices are going up. Since we know we will have a major rise lasting at least 6 months, the next logical step is to buy and hold. When Stacks starts trading 1,000% up, you won't care how the long bull market will last, you will just be very happy and grateful with the results.
The easy target is $6.19, but if we get an extended bull market we can go to $9.83 or even $13, or higher. It all depends on how it all develops, but we are going up. We are talking profits between 600% and 1,400% coming from current prices.
Thanks a lot for your continued support.
Namaste.
STXUSDT

$STX Stacks Bullish Continuation? 70% retracement from ATHNASDAQ:STX (Stacks) – Bigger Picture: Uptrend/Bullish Continuation
3-Day Timeframe
Current Price: $1.00
NASDAQ:STX has retraced over 70% from its all-time high of $3.80, indicating a deep correction phase that may now be reaching exhaustion.
If the price breaks out of this falling channel, which is often a bullish reversal signal. This breakout, if sustained, could set the stage for a move toward previous all-time highs and beyond.
🚀 Bullish Targets (TP):
$2.60 – Previous resistance level
$3.70 – Near the all-time high
$5.20 – Extended target on strong momentum
Invalidation Level:
The bullish thesis is invalidated if price falls below $0.80, signaling potential continuation of the downtrend.
#STX #Stacks #Crypto #Altcoins #Breakout #BullishSetup #CryptoTrading
@Stacks

STX/USDT Weekly Outlook Golden Accumulation Zone
📌 Overview:
STX (Stacks) is currently retesting a crucial demand zone in the $0.63 – $0.72 range — the same area that previously served as the launchpad for a massive rally toward the $3.80 highs. This chart highlights a strategic opportunity for swing traders and long-term investors who understand market cycles.
🧠 Price Structure Insight:
A well-established demand zone (highlighted in yellow) has acted as a base of accumulation since late 2022 through mid-2023.
Price is now consolidating above this zone, suggesting a potential bullish reversal.
A potential Double Bottom pattern is forming, with a neckline around the $1.00 level — a breakout above this could spark a significant bullish impulse.
🟢 Bullish Scenario (Upside Potential):
If STX maintains support and bounces from this accumulation zone, we could see a stair-step rally toward the following targets:
1. $0.90 – $1.00 → Psychological resistance & neckline of reversal pattern
2. $1.2975 → Historical supply and consolidation area
3. $1.9447 → Previous lower-high resistance zone
4. $2.20 – $2.71 → Key Fibonacci retracement levels from prior highs
5. $3.66 – $3.84 → All-Time High resistance, long-term bull target
🔍 A confirmed weekly close above $1.00 would significantly strengthen the bullish thesis and validate the reversal structure.
🔴 Bearish Scenario (Downside Risk):
If price breaks down below $0.6380, this could invalidate the current structure and lead to deeper corrections, targeting:
$0.45 → Minor support from early 2023
$0.20 → Historical macro bottom and extreme support
❗ A breakdown below this accumulation zone could trigger a longer-term bearish continuation.
🔄 Strategic Trading Notes:
This is a high-probability reversal zone, ideal for gradual accumulation (DCA) or swing entries with tight stop losses below support.
Watch for a spike in volume as a signal for institutional or smart money involvement.
Confirmation from bullish candlesticks (e.g., bullish engulfing on weekly) could provide additional entry confidence.
📚 Conclusion:
STX is testing a key structural level that previously led to exponential price growth. As long as the $0.63–$0.72 zone holds, the mid-to-long-term bias remains bullish. However, traders should remain disciplined and responsive to any invalidation signals.
#STXUSDT #Stacks #CryptoAnalysis #AltcoinSetup #TechnicalBreakout #WeeklyChart #BullishReversal #AccumulationZone #SmartMoney

Stacks Short- Mid- & Long-Term Bullish Signals (PP: 900%+)Stacks is a very interesting project and I believe it has many fans. Here the signals are really good and by good I mean strong.
This pair, STXUSDT, has been a top performer but the action bearish since March 2024.
Between March 2024 and April 2025 we have a classic ABC correction, a long-term one. Needless to say, this type of correction is always followed by an impulse, a bullish impulse and this is a sequence of 1,2,3,4,5 waves. Three waves up and two waves down in-between.
The August 2023 low produces a rounded bottom and then a new wave of growth. This low is preceded by another bullish wave. This pair has been growing long-term.
Then a new rounded bottom shows up but this one a long-term higher low compared to August 2023. That is April and June 2025. So mixed bullish signal. Short-term, mid-term and long-term all being combined to give us a bullish mix. Ultra-bullish in short.
The last all-time high happened around $3.84, so the next one can happen around $7.11 or $9.65. The $7.11 projection gives more than 900% profits potential.
Oh, and this week is young and already full green. The candle's real body trades above the two previous weeks open and close.
Thank you for reading.
Your support is appreciated.
Namaste.

STXUSDT 1W Analysis STX ~ 1W Analysis
#STX Buy back gradually from here with a short-term target of at least 20%++.

STXUSDT LONGPrice has broken out of a consolidation range and retested previous structure support at 0.6299. Bullish momentum followed with a clean engulfing candle on the 1H timeframe, confirming potential continuation.
Entry: $0.6299 (demand zone retest)
Stop Loss: $0.6186 (below demand)
Target: $0.6900 zone (key resistance, can be extended depending on the market conditions)

TradeCityPro | STX: Watching Triangle Breakout and RSI Reaction👋 Welcome to TradeCity Pro!
In this analysis, I’m going to review the STX coin, which belongs to the Stacks project—a Layer 2 solution for Bitcoin.
🔍 STX, with a market cap of $1.45 billion, is currently ranked 59 on CoinMarketCap.
🔄 In the previous analysis, I drew an expanding triangle and mentioned that if this triangle breaks to the upside, we can enter a long position or even make a spot purchase.
✨ The trigger for the triangle breakout was at the 0.731 level. After breaking out and pulling back to this level, the price moved up to 1.049 and is now once again in a consolidation phase.
📅 Daily Timeframe
Currently, after RSI got rejected from the 73.58 zone and exited the overbought area, the price has undergone some correction. A pullback to the 0.871 level is possible.
🧩 If a pullback or deeper correction occurs, as long as RSI remains above 50, I still consider the market momentum to be bullish and believe the price can continue moving upward.
📈 If we see a solid bullish candle confirming continuation, we can enter a long position. However, the main long trigger is the breakout of 1.049. The RSI trigger for sharper moves would also be a breakout above 73.58.
📊 The next resistance level is at 1.332. If this level breaks, the coin enters a new price zone, and we’ll need to see whether it can establish support above that area.
🔽 For a bearish scenario, we should wait for the market to form a structure and provide a valid trigger to confirm a short position. At the moment, it’s better to wait for that setup.
🔑 If the market turns bearish, the key support zones to watch are 0.731, 0.571, and 0.453, which could potentially halt further decline.
📝 Final Thoughts
This analysis reflects our opinions and is not financial advice.
Share your thoughts in the comments, and don’t forget to share this analysis with your friends! ❤️

STX ANALYSIS (2D)The STX pair has reached a demand zone.
A price movement fractal seems to be repeating (highlighted by the orange and white boxes).
In the orange boxes, every time STX has dropped more than 72%, it has made a rebound move to the upside.
We are looking for buy/long positions around the demand zone.
The targets for STX are $0.93 - $1.10 - $1.30.
A daily candle close below the invalidation level will invalidate this analysis.
For risk management, please don't forget stop loss and capital management
When we reach the first target, save some profit and then change the stop to entry
Comment if you have any questions
Thank You

STXUSDT Potentially BullishWe saw BTCUSDT gain some momentum and this effect is being seen on many ALT coins. BINANCE:STXUSDT is no different!!! At the moment, STX is breaking out of a consolidation phase on the Daily TF. Will this breakout mean #STXUSDT is regaining its bullish momentum? That remains to be seen, However a close above the 0.78 will likely bring us into the bullish phase.
Until then, fingers crossed.
Do your analysis before taking any trade, results are not typical, past results does not guarantee future results

STXUSDT Potentially BullishBINANCE:STXUSDT is beginning to take shape and is looking good to go long. Broken the consolidation phase and retested it. The bulls are setting in however, we just might see the market slow down around the 1.152 area which turns out slightly below the EMA 200 and also aligns with a resistance point on the weekly TF. On futures trade, I will target this area while i will lock down some profits on my spot trading at this point.
This is not a trade advice as such do your due diligence
Past results does not guarantee future results

Stacks: Psychological Effects Of Trading & Technical AnalysisI was about to call it quits for now but I saw Stacks.
There was a guy here, a few years back. You know these people that are a true pain in the muladhara? That type of guy. He was always going about STXUSDT and as usual, I would give him the entry, the levels, the exit and he would always get it wrong.
Write, write, write, comment, comment; back and forth but never right, always wrong.
Jesus Christ!
Brahman please help!
I have positive impressions on my mind for this pair. That is because some time ago I shared a chart and it did great. This happens. When the prediction goes as planned, it records pleasant memories and each time I go through the pair the sanskaras are activated. It also works the other way. When a trade goes wrong, when I see the pair I tend to feel, "Yuck!"
Each time, good or bad, I have to overcome my mental attachments to be able to look a the pair fresh, with a new perspective, new!
If you get attached to the positive outcome, you are likely to jump in before the time is right.
If you get attached to the negative outcome, you are likely to miss it the next time prices are about to rise.
Both these need to be avoided if you are looking at charts or doing your own numbers. Detach completely and look at it fresh.
Today it is a new day. Whatever happened in the past, good or bad, has nothing to do with this present moment.
I am looking at Stacks, STXUSDT, what does the chart have to say?
A long-term support zone, mid-2023, has been activated.
All the action in 2024 has been removed. We are back to baseline, back to baseline is good for the bulls.
This pair allows buying at support in expectation of long-term growth.
Namaste.

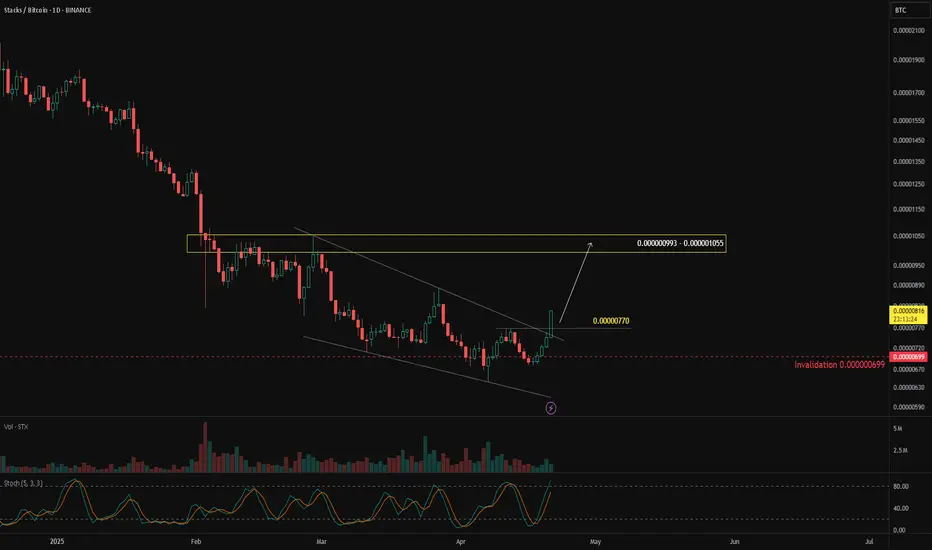
Will STX Outperform Bitcoin?In the crypto market, if you want to beat the market, your benchmark is $CRYPTO:BTCUSD. That means to outperform the crypto market, you need to outperform Bitcoin.
One way to measure this is by watching crypto/BTC pairs, such as $BINANCE:STXBTC. If $BINANCE:STXBTCgoes up, it means STX is stronger than BTC. If it goes down, BTC is stronger than STX.
On the daily chart, BINANCE:STXBTC has been moving downward, but over the past month, sellers seem to be losing momentum—indicated by a falling wedge reversal pattern.
A bullish breakout above 0.000000770 would confirm the pattern, with a potential upside target at 0.000000993 – 0.000001055. This scenario remains valid as long as price holds above 0.000000699.
TradeCityPro | STX: Watching for a Breakout in Bitcoin’s L2 Star👋 Welcome to TradeCity Pro!
In this analysis, I want to review the STX coin for you. This coin is one of Bitcoin’s layer-2 projects and, with a market cap of $933 million, ranks 67th on CoinMarketCap.
📅 Daily Time Frame
In the daily time frame, as you can see, this coin has been in a downtrend. Its most recent upward move began after breaking 1.332, and then it dropped within an expanding triangle structure down to the 0.533 area.
🔍 Currently, the main price support is at 0.453, which the price hasn't reached yet, but the 0.533 area is also strong and could mark the end of the downtrend.
✨ If the price bounces from the 0.533 area and starts moving upward, the likelihood of the triangle breaking to the upside increases. Since the price hasn’t reached the triangle’s bottom and could form a higher low, bullish momentum may enter.
📊 Market volume during the last bearish leg was decreasing, and now with supportive candles forming, volume is increasing—which, if it continues, also increases the likelihood of the triangle breaking.
🛒 If this happens, the buy trigger in spot is at 0.731, which, besides being suitable for a spot entry, can also provide a good futures position in lower time frames.
✔️ The RSI oscillator is also near the 50 level, and if it breaks above that and moves up, the price can head toward higher targets.
📉 On the other hand, for short positions, the 0.533 support is very important, and breaking it could justify opening a short. But note that this area is very close to 0.453, so if you're opening a short, be aware it's very risky and the price could reverse at any moment.
❌ If you already hold this coin and are looking for a good stop-loss level, a break and confirmation below 0.453 is appropriate. However, keep in mind that if your stop-loss is triggered and the price moves back above the support area, you should find a new trigger and buy again so you don’t miss the move.
📝 Final Thoughts
This analysis reflects our opinions and is not financial advice.
Share your thoughts in the comments, and don’t forget to share this analysis with your friends! ❤️

STX Bulls Beware: Is This the Calm Before a Massive Drop?Yello, Paradisers! Are you seeing what we’re seeing on STXUSDT? If not, now’s the time to pay attention—our recent predictions on bearish setups are starting to unfold again, and this one might catch many off guard. Let’s break it down.
💎Currently, STXUSDT is flashing some serious warning signs. We’re spotting a clear bearish Change of Character (CHoCH) in play, which is being reinforced by a Head and Shoulders pattern—a combination that significantly increases the probability of a downside move.
💎To make things worse for the bulls, there’s an unfilled Fair Value Gap (FVG) sitting just below the current price. This acts like a magnet and could drag the price downward as liquidity gets targeted.
💎However, if STXUSDT manages to bounce from current levels, we’ll be closely watching the Order Block (OB) and Fibonacci Golden Zone as potential entry points. These could offer an excellent risk-to-reward (RR) setup if the bearish scenario gets temporarily rejected.
💎But here’s the key invalidation point: if price breaks and closes above the OB zone, the entire bearish thesis falls apart. In that case, we’ll step aside and wait for stronger confirmation before jumping back in. No need to rush—better opportunities always come with clear setups.
🎖Trade smart, Paradisers. The market doesn't care about your bias—it rewards only patience, precision, and discipline. Stick to your trading plan, and don’t let FOMO or fear drive your decisions.
MyCryptoParadise
iFeel the success🌴

#STX/USDT#STX
The price is moving within a descending channel on the 1-hour frame, adhering well to it, and is heading for a strong breakout and retest.
We are experiencing a rebound from the lower boundary of the descending channel, which is support at 0.600.
We are experiencing a downtrend on the RSI indicator, which is about to break and retest, supporting the upward trend.
We are looking for stability above the 100 moving average.
Entry price: 0.670
First target: 0.691
Second target: 0.714
Third target: 0.739

STXUSDT 1WSTX ~ 1W Analysis
#STX Buy gradually from here if you still have a Conviction on this coin with a short -term target of at least 20%+.

Time to buy? STXUSDT
You can see the support line is broken down last week. Now, it's trading around 0.62x, do you think can buy this time, this price?
I think not yet. I expect BINANCE:STXUSDT hit the first all time high zone 0.4-0.5
So wait and see

TradeCityPro | STXUSDT Reached Weekly Support👋 Welcome to TradeCityPro Channel!
Let's go together to analyze and review one of the popular cryptocurrency coins and Bitcoin's second layer and update our triggers
🌐 Overview Bitcoin
Before starting the analysis, I want to remind you again that we moved the Bitcoin analysis section from the analysis section to a separate analysis at your request, so that we can discuss the status of Bitcoin in more detail every day and analyze its charts and dominances together.
This is the general analysis of Bitcoin dominance, which we promised you in the analysis to analyze separately and analyze it for you in longer time frames.
📊 Weekly Timeframe
On the weekly time frame, stx is one of the coins that started its upward trend before the start of 2024, which caused the formation of its ATH and new ceiling
You can also see one of the best weekly trends in this coin, which is that after each time we hit this support trend line, we rose and made a sharper move.
Also, when this trend line was broken, we made a pullback to it and as we had given the weekly exit trigger with a break of 1.299 in the previous analysis, after the break of the trigger of the trend line, we experienced a sharp decline and reached the support level of 0.796 and now we need to form a structure.
📈 Daily Timeframe
On the daily time frame, but after the rejection of the important weekly resistance 2.745 and getting rejected, we started to correct the price and fall until this price correction turned into a trend change in the daily time frame
After forming the lower ceilings and floors, we reached important support and the trigger for the spot exit, which after the daily failure and pullback to that daily candle, engulfed the previous 3 candles and caused further decline, which led to us reaching the important support of 0.859
Currently, after hitting the support of 0.859 twice, our fall volume has not increased much and it can be said that the sellers do not intend to take the price below 0.859 for the time being, and this will cause us to go into the range and form a new structure. However, I will open a short with a failure of 0.859, but there is no buying at the moment.
⏱ 4-Hour Timeframe
We suffered enough in the four-hour time frame and formed a structure and we are in a range box that we can take a position from both sides
📉 Short Position Trigger
For my short position I open a position with a break of 0.859 and accept the stop loss. Since it is an important support, I try to place my stop loss in a logical space and not make it small.
📈 Long Position Trigger
For the long position, we have two triggers, one risky and one somewhat certain. You can open a position with a break of 0.953 and 1.005, respectively. The difference is that with a break of 0.953, the possibility of a stop loss is higher, and with a break of 1.005, the possibility of losing the position is higher. I choose to take the stop loss myself.
📝 Final Thoughts
Stay calm, trade wisely, and let's capture the market's best opportunities!
This analysis reflects our opinions and is not financial advice.
Share your thoughts in the comments, and don’t forget to share this analysis with your friends!


STX at Key Support: Perfect Spot for Accumulation!STX is currently trading within the blue support zone at $1.279–$1.364, an ideal range for accumulating spot positions. This higher timeframe support has historically held the price multiple times. Waiting for a clear reversal confirmation before entering is recommended.
The green resistance zone at $1.873–$1.954 is a critical level to watch. A breakout above this zone, accompanied by strong volume and momentum, could pave the way for further price movement. Potential targets include the pink resistance zone at $2.396–$2.467 and the yellow resistance zone at $3.018–$3.111.

TradeCityPro | STXUSDT Sellers Final Attempt👋 Welcome to TradeCityPro Channel!
Let’s analyze one of my favorite coins, STX, which serves as Bitcoin's layer 2 and is currently in a better condition compared to other altcoins.
🌐 Overview Bitcoin
As always, before analyzing STX, we’ll take a quick look at Bitcoin on the 1-hour timeframe. Bitcoin bounced off the 102873 support, with its recent fluctuations caused by the Trump-related events and their accompanying market noise.
Bitcoin dominance continues to climb, and it’s likely we’ll see a new high along with bullish movement in Bitcoin dominance. It’s a good idea to either open long positions on Bitcoin or hold your existing long positions. Altcoins paired with Bitcoin that are showing bullish signs might also see upward movement.
📊 Weekly Timeframe
On the weekly timeframe, STX stands out as one of the most bullish coins in the market, alongside Solana, Doge, and Sui. This highlights the strong current position of this project.
The key resistance level is at 2.708, while the 3.696 ATH can be considered a fake breakout. For trading, it’s better to base your entries and positions on the 2.708 resistance.
The coin has been moving along an important supportive trendline that had multiple successful retests. However, this trendline has been broken, a pullback occurred, and the trendline trigger activated with the breakout at 1.299, which currently serves as a critical support.
This level is both a major weekly support and the 0.382 Fibonacci level. If broken, the price could drop further to 0.738.
For new entries, either wait for the 1.765 level in lower timeframes or the primary trigger at 2.708. Exiting below 1.299 in profit might be a smart move. If the price reclaims this box, you can re-enter. Although this strategy reduces the number of coins, it ensures no USD losses.
📈 Daily Timeframe
On the daily timeframe, the price is at the 1.355 significant support level, with lower highs and relatively flat lows forming a compression pattern and a trendline.
I won’t exit my spot holdings below 1.355, but I may take the risk of opening a short position after breaking this trigger. Part of the profits from this short position can be used to accumulate more STX coins for long-term holding.
For re-entry on the daily timeframe, momentum or a trend reversal is necessary. This could happen with a fake breakout of 1.355, which is a critical support level.
Buyers will likely make an effort to defend it. Alternatively, you can wait for the trendline breakout and the 1.674 level to open your spot positions with a risky stop-loss below 1.355. A breakout above RSI 50 can also serve as confirmation.
⏱ 4-Hour Timeframe
On the 4-hour timeframe, the chart shows consolidation near the 1.355 critical support, oscillating within the 1.355 to 1.674 box, with sellers slightly stronger.
📉 Short Position Trigger
The short position trigger is clear. After breaking 1.355, I’ll open a short position. If the price moves closer to this level, I might also place a stop-sell order if bearish volume increases.
📈 Long Position Trigger
Long positions are trickier with this chart. For such positions, I’d either check other charts or wait for a higher high and low or a fake breakout of 1.355 before considering opening a long position.
www.tradingview.com
📝 Final Thoughts
Stay calm, trade wisely, and let's capture the market's best opportunities!
This analysis reflects our opinions and is not financial advice.
Share your thoughts in the comments, and don’t forget to share this analysis with your friends!

STX 1$ Resistence ZoneBINANCE:STXUSDT
✅Before we start to discuss, I would be glad if you share your opinion on this post's comment section and hit the like button if you enjoyed it. Thank you.
Possible Targets
➡️globally we came in to -0.27 Zone (usually play like accumulation zone for investors)
➡️Main support area in case if BTC drop again to test 19-17K STX should hold 0.30 cent
➡️ We going out of global downtrend line since November 2021
➡️ Next resistance zones where we can going down again marked on chart
➡️ Main resistance zone and psychological level is 1$ where I think we will find huge sales and come back to test main support zone in September-October again.
Hope you enjoyed the content I created, You can support with your likes and comments this idea so more people can watch!
✅Disclaimer: Please be aware of the risks involved in trading. This idea was made for educational purposes only not for financial Investment Purposes.
* Look at my ideas about interesting altcoins in the related section down below ↓
* For more ideas please hit "Like" and "Follow"!
