Is STXUSDT Setting Up for a Big Move? Don’t Miss These Key LevelYello, Paradisers! Is STXUSDT quietly building momentum for a major breakout? Let’s dive into the current market structure to see if we’re on the verge of a bullish opportunity — or if caution is the smarter play.
💎STXUSDT is showing bullish I-CHoCH (Internal Change of Character) and BOS (Break of Structure) on higher timeframes — a good sign that buyers are gaining control. The current retracement adds more weight to this setup, making it an attractive opportunity if we see further confirmation on lower timeframes.
💎The double-bottom pattern forming is another bullish signal. However, instead of jumping in early, it’s smarter to wait for a bullish I-CHoCH confirmation on lower timeframes to increase the probability of success.
💎If we get a deeper retracement or sudden panic selling, our focus will shift to the strong support zone below. This is where we expect a bounce, and once again, we’ll be watching for bullish I-CHoCH on lower timeframes to confirm the reversal.
💎If STXUSDT respects that support, we’re in a good position. But...
💎If the price breaks down and closes a candle below the strong support zone, that will invalidate the entire bullish idea. In that case, we step back and wait for better price action to form. No need to rush — the market will always give more opportunities if you stay patient and disciplined.
Play It Smart, Paradisers! At this point, it’s all about waiting for confirmation and avoiding emotional trades. The crypto market loves to punish impatience, but the disciplined traders always win in the end.
MyCryptoParadise
iFeel the success🌴
STXUSDT


STXUSDT 1WSTX ~ 1W
#STX if you still have Conviction on the coin,. This support block would be a very good buying place for now,. Target at least 20%+ from here.

STX buy/long setup (4H)Considering the breakout of the trigger line, the price structure shift, and the creation of a demand zone, we can look for buy/long positions on STX during pullbacks.
The target could be the red zone.
We should enter the position at the green zone to minimize risk.
Closing a daily candle below the invalidation level will invalidate this analysis.
For risk management, please don't forget stop loss and capital management
Comment if you have any questions
Thank You

The last bullish chance of STX in Mid term!As you can see, the price is in an ascending triangle and is also forming the handle of a cup and handle pattern. Each of these patterns indicates a bullish trend in the medium term. We just need to wait for these patterns to break out to reach the desired target.
Give me some energy !!
✨We spend hours finding potential opportunities and writing useful ideas, we would be happy if you support us.
Best regards CobraVanguard.💚
_ _ _ _ __ _ _ _ _ _ _ _ _ _ _ _ _ _ _ _ _ _ _ _ _ _ _ _ _ _ _ _
✅Thank you, and for more ideas, hit ❤️Like❤️ and 🌟Follow🌟!
⚠️Things can change...
The markets are always changing and even with all these signals, the market changes tend to be strong and fast!!

STXUSDT in coming daysHi
Stacks is in an overall uptrend, moving within an ascending channel💁♂️
After testing the upper boundary of the ascending channel, the price pulled back🫠
After breaking down below the MA 50, expect a potential move towards the lower boundary of the channel🔻
Stay awesome my friends.
_ _ _ _ _ _ _ _ _ _ _ _ _ _ _ _ _ _ _ _ _ _ _ _ _ _ _ _ _ _ _ _ _
✅Thank you, and for more ideas, hit ❤️Like❤️ and 🌟Follow🌟!
⚠️Things can change...
The markets are always changing and even with all these signals, the market changes tend to be strong and fast!!

The Future of STXUSDT: A Look at the Key Catalysts - Stacks◳◱ On the BINANCE:STXUSDT chart, the Bband Breakout pattern suggests a consolidation phase that could precede a trend continuation or reversal. Traders might observe resistance around 2.817 | 3.178 | 3.998 and support near 1.997 | 1.538 | 0.718. Entering trades at 2.49 could be strategic, aiming for the next resistance level.
◰◲ General Information :
▣ Name: Stacks
▣ Rank: 56
▣ Exchanges: Binance, Kucoin, Gateio, Mexc
▣ Category / Sector: Infrastructure - Smart Contract Platforms
▣ Overview: Stacks (formerly Blockstack) provides software for internet ownership, which includes infrastructure and developer tools to power a computing network and ecosystem for decentralized applications (dApps). Its focus is to replace the reliance on centralized cloud service providers and apps that harvest and monetize user information. The Stacks network allows users to directly own digital assets like usernames, domain names, computer programs, etc. On the Stacks blockchain, computing is done on the edges (i.e., client devices), and applications on the platform store data individually and use the blockchain only when necessary.
◰◲ Technical Metrics :
▣ Current Price: 2.49 ₮
▣ 24H Volume: 85,569,157.492 ₮
▣ 24H Change: 3.063%
▣ Weekly Change: 2.63%%
▣ Monthly Change: 25.12%%
▣ Quarterly Change: 68.55%%
◲◰ Pivot Points :
▣ Resistance Level: 2.817 | 3.178 | 3.998
▣ Support Level: 1.997 | 1.538 | 0.718
◱◳ Indicator Recommendations :
▣ Oscillators: NEUTRAL
▣ Moving Averages: STRONG_BUY
◰◲ Summary of Technical Indicators : BUY
◲◰ Sharpe Ratios :
▣ Last 30 Days: 3.91
▣ Last 90 Days: 2.21
▣ Last Year: 1.28
▣ Last 3 Years: 0.53
◲◰ Volatility Analysis :
▣ Last 30 Days: 1.01
▣ Last 90 Days: 1.00
▣ Last Year: 1.12
▣ Last 3 Years: 1.17
◳◰ Market Sentiment :
▣ News Sentiment: N/A
▣ Twitter Sentiment: N/A
▣ Reddit Sentiment: N/A
▣ In-depth BINANCE:STXUSDT analysis available at TradingView TA Page
▣ Your thoughts matter! What do you think of this analysis? Share your insights in the comments below. Your like, follow, and support are greatly valued and help sustain high-quality content.
◲ Disclaimer : Disclaimer
The content provided is for informational purposes only and does not constitute financial, investment, or trading advice. Always conduct your own research and consult a qualified professional before making any financial decisions. Use of the information is solely at your own risk.
▣ Explore the Power of Charting with TradingView
Unlock a wide range of financial analysis tools, data, and features to elevate your trading experience. Take a tour and see the possibilities. If you decide to upgrade your plan, you can receive up to $30 back. Discover more here - affiliate link -

STXUSDT: %100 VOLUME SPIKE DAILY | Key Zones IdentifiedSTXUSDT has seen a 100% increase in trading volume within the past 24 hours.
🔵 Key Zones: The highlighted areas on the chart are potential demand zones, designed to prepare for possible bearish market conditions as we approach year-end.
📈 Entry Strategy: Avoid acting on these zones unless confirmed by upward breakouts on the 15-minute time frame.
⚠️ Risk Management: Exercise caution, as buyers have yet to show significant activity. Always manage your risk carefully.
This is not investment advice. Trade wisely and plan for market volatility!
I keep my charts clean and simple because I believe clarity leads to better decisions.
My approach is built on years of experience and a solid track record. I don’t claim to know it all, but I’m confident in my ability to spot high-probability setups.
My Previous Analysis
🐶 DOGEUSDT.P: Next Move
🎨 RENDERUSDT.P: Opportunity of the Month
💎 ETHUSDT.P: Where to Retrace
🟢 BNBUSDT.P: Potential Surge
📊 BTC Dominance: Reaction Zone
🌊 WAVESUSDT.P: Demand Zone Potential
🟣 UNIUSDT.P: Long-Term Trade
🔵 XRPUSDT.P: Entry Zones
🔗 LINKUSDT.P: Follow The River
📈 BTCUSDT.P: Two Key Demand Zones
🟩 POLUSDT: Bullish Momentum
🌟 PENDLEUSDT.P: Where Opportunity Meets Precision
🔥 BTCUSDT.P: Liquidation of Highly Leveraged Longs
🌊 SOLUSDT.P: SOL's Dip - Your Opportunity
🐸 1000PEPEUSDT.P: Prime Bounce Zone Unlocked
🚀 ETHUSDT.P: Set to Explode - Don't Miss This Game Changer
🤖 IQUSDT: Smart Plan
⚡️ PONDUSDT: A Trade Not Taken Is Better Than a Losing One
💼 STMXUSDT: 2 Buying Areas
🐢 TURBOUSDT: Buy Zones and Buyer Presence
🌍 ICPUSDT.P: Massive Upside Potential | Check the Trade Update For Seeing Results

The Road to $66 for STXUSDT (Stacks)$STXUSD has now beautifully broken out of the triangle after an impressive textbook correction at the 0.618 Fibonacci retracement.
This type of correction is a typical feature of wave 2 in an Elliot wave count, which indicates that $STXUSDT is now ready to embark on its third impulsive wave, often referred to as the most explosive one.
Considering the increasing volume, an explosive surge in the number of transactions on the network, and the oscillators, we can expect a swift development in the price towards the following resistance levels:
— 0.57
— 1.06
— 2.85
— 5.96
— 8.16
— 13.17.
#stxusdt #stxusd #BNS #DeFi #BitcoinNFTs #Stacks

STX has gained over 200%.From the point where we placed the green arrow on the chart, it appears that STX has entered a large diametric pattern.
It now seems that wave D has completed, and the price has entered wave E.
As long as the green zone is maintained, it can move toward the target above $7.
Closing a daily candle below the invalidation level will invalidate this analysis.
For risk management, please don't forget stop loss and capital management
Comment if you have any questions
Thank You

TradeCityPro | STX : A Healthy Uptrend with Promising Momentum👋 Welcome to TradeCity Pro!
In this analysis, I’ll review STX, the native token of the Stacks project, a prominent Layer 1 blockchain. The analysis focuses on the weekly timeframe.
⏳ Weekly Timeframe: A Healthy Uptrend
On the weekly chart, a strong uptrend has been in place since reaching the low of 0.201. Thus far, two bullish legs have propelled the price to 3.737, with the price currently testing the resistance at 2.471.
📊 Buying volume continues to increase, showing robust support for the ongoing trend with no signs of weakness. A visible ascending trendline has interacted with the price three times, further reinforcing the bullish momentum.
🔼 The 37.65 support level on the RSI is critical. As long as the RSI remains above this level, the probability of a bullish scenario outweighs the bearish one.
📈 If the price breaks above 3.737, it could move toward new all-time highs. In the event of such a breakout, I will update the analysis to include new targets.
🔽 Bearish Scenario
If the ascending trendline and the 1.264 support level are broken, the possibility of a trend reversal arises. In this case, the first major support level to watch would be 0.442.
📝 Final Thoughts
This analysis reflects our opinions and is not financial advice.
Share your thoughts in the comments, and don’t forget to share this analysis with your friends! ❤️

STXUSD - 50MA Supporting the Bull MoveThe 50MA in blue shows one successful bounce this run and one that is about to prevail
from the current point at the 50MA I see price moving up a comparable amount to the previous bull run (2k%)
This also puts price within a broadening structure that I have plotted in green.
Bullish target about ~7

Are #STXUSDT Bulls Ready to Upheld the Bullish Momentum?Yello, Paradisers! Is #STXUSDT ready for a bullish breakout or will it fall? Let's discuss the latest analysis of #Stacks and see what's happening:
💎After months of grinding downward, #STX has finally reached a tipping point. The price is currently testing the upper boundary of a Descending Broadening Wedge, spurred by a solid rebound from the key support zone at $1.38–$1.51. But the big question is this: Can the bulls maintain this momentum, or are we looking at another fakeout?
💎#STXUSDT must conquer the critical resistance level at $2.28 for a true breakout. This area, which previously acted as strong support (tested twice), has now flipped into a stubborn barrier. Bulls will need a decisive move above this level, supported by increasing trading volume and the 20 EMA, to confirm the start of a genuine rally. If they succeed, the next target lies at the next major resistance zone, which could spark a significant upside move.
💎However, failing to sustain momentum could lead to a pullback toward the $1.38–$1.51 range, potentially retesting the breakout point. Losing this zone might open the door to further downside, with #Stacks slipping to the $1.05 demand zone.
💎The real danger begins if $1.05 fails to hold. A breakdown below this level would likely signal a shift in control back to the bears, leading to a deeper correction and extinguishing any short-term bullish hopes.
Stay focused, patient, and disciplined, Paradisers🥂
MyCryptoParadise
iFeel the success🌴

#STX/USDT / Ready to go up#STX
The price is moving in a descending channel on a 1-day frame and sticking to it well
We have a bounce from the lower limit of the descending channel, this support is at 1.46
We have a downtrend, the RSI indicator is about to break, which supports the rise
We have a trend to stabilize above the 100 moving average
Entry price 1.78
First target 2.00
Second target 2.23
Third target 2.50

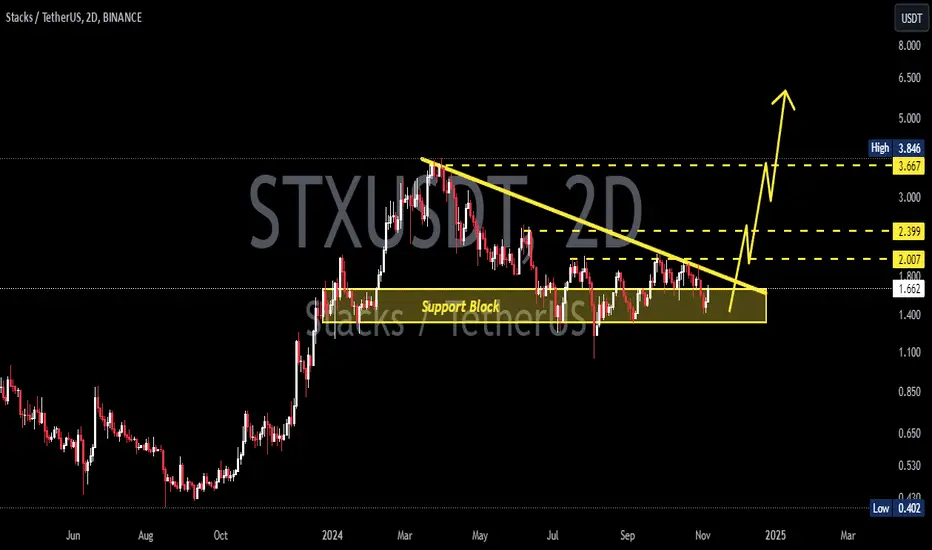
STXUSDTSTX ~ 2D
#STX So far it continues to maintain this support Block. Buy gradually on this support block,. with a minimum target of 15%++. If you have Conviction on this coin.
Stacks | STX The price of Stacks is $0.79 today with a 24hour trading volume of 204 million dollar. This represents a 14% price increase in the last 24 hours and a 11% price increase in the past 7 days
Stacks is a crypto project on a mission to unlock the full potential of the Bitcoin network by bringing smart contracts and dApps to Bitcoin. It's designed as a Layer 1 solution that utilizes Bitcoin as its base layer. The Stacks token powers the performance of smart contracts, transaction processing, and registration of new cryptocurrencies.
as you can see the chart and candles still following the uptrend and are in green zone, the RSI are above average and volume goes up which shows bulls are in control
our today daily candle going to break 50 EMA line which is another bullish sign. bulls next targets are 0.83, 0.85 and 0.89. stop loss at 0.69 and 0.67 levels are necessary as well

STX Consolidation and Potential Rally AheadMarket Overview:
STX has been consolidating within a range established since June, currently testing potential resistance in the October 25th bearish gap ($1.701–$1.768).
Bulls are showing strength in this zone, hinting at the possibility of a rally, especially if traders begin "selling the news" following an upcoming release.
Key Levels to Watch:
Resistance Targets:
First target: Stops above the October 24th swing high at $1.842.
Next resistance: $1.884 (October 20th level).
Further resistance around relatively equal highs at $1.962, $2.000, and $2.074.
Support Levels:
Initial support: $1.652 (last week's candle tail midpoint).
If bearish pressure continues, further support may be tested near $1.560 and $1.530.
Potential profit-taking could occur around September 16th's swing low at $1.470.
Outlook:
A sustained bullish momentum could propel STX towards the upper resistance targets, supporting a continued rally.
Conversely, if bearish sentiment prevails, the price may test lower support levels, indicating a need for caution among traders.
#STX #CryptoMarket #Consolidation #BullishPotential #TechnicalAnalysis

Stacks (STX), LONG opportunity🟢 Here is a LONG opportunity on STX/USDT:
Potential Buy Zones:
1- 1.80 $
2- 1.65 $
3- 1.50 $
Potential Sell Zones:
1- 2.17 $ (20%)
2- 2.39 $ (32%)
3- 3.00 $ (66%)
4- 3.46 $ (93%)
About Stacks (STX):
Stacks (STX) enhances Bitcoin by enabling smart contracts and decentralized applications (DApps) without altering Bitcoin’s core protocol. Using Proof-of-Transfer (PoX), Stacks leverages Bitcoin’s security, enabling scalable and efficient transaction processing. STX tokens are essential for executing smart contracts, processing transactions, and rewarding network participants. The Stacks project is notable for being the first SEC-qualified token offering in the U.S., highlighting its regulatory compliance and potential for wide adoption.
Disclaimer
The information provided here should not be construed as financial advice. Always conduct your own research and consult with a licensed financial advisor before making any investment decisions. The author is not responsible for any losses or gains resulting from investment activities based on the information provided.

5x Potential Gains on STX From Here (Fibs, Channels & More)STX has been looking good and in a nice upward trending parallel channel since Dec 2022.
Just trading that channel would have yielded some great returns, but we can also look to the Fibonacci retracement from the previous high to low, which we can see exactly forecast the next high as shown in the video.
From there, we can run the Fib tool from the most recent high to low, which we seem to be coming out of in the ower edge of the bullish channel, giving us a $10 price target (5x).
This coincides with the fractal I took from the last bullish pump to the previous high, and it looks like this is a viable path to $10, judging from the rounded bottoming pattern and the 50 day EMA turning higher.
Let me know what you think of this video, leave a comment, and if I get 10 likes I'll try to do more of these weekly if not daily!
More information is in my bio, and I'd love to hear your thoughts on this study 🚀

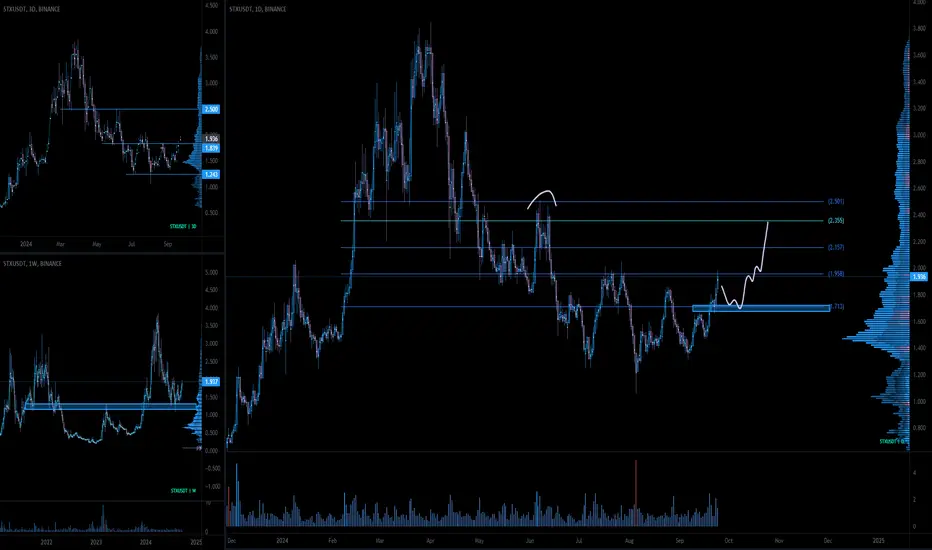
$STX Key levels to watchSTX (Stacks) is breaking out of a 3-month consolidation and is now nearing its horizontal and psychological resistance at $2
A bullish structure is forming, and we have significant upside potential if we can break through the immediate resistance, which has now been tested for the third time.
There's strong support between $1.70 and $1.65. In my view, any dip to this range is a buying opportunity. If this level holds, we could see a move up towards $2.3 to $2.5
STX - USDTThe STX/USDT chart shows the price testing a crucial resistance zone (Blue). A successful breakout above the resistance zone (Blue) could trigger a strong bullish wave. Failure to break this level may lead to further consolidation or downward movement.

STX/USDT100 percent growth within a month or two seems possible. Keeping an eye. Looks boullish over EMA 100.
What do you guys think!??

STXUSDT Triangle BreakoutSTXUSDT technical analysis update
STX is breaking the symmetrical triangle resistance with high volume, and the price is trading above the 100 EMA on the daily chart. This is considered a strong bullish signal for STX.
Buy zone: Below $1.75
Stop loss: $1.55
Regards
Hexa
